
Abstract
Background:
Multiple sclerosis (MS) slowly expanding lesions (SELs) are defined on magnetic resonance imaging (MRI) as contiguous regions of pre-existing focal non-contrast-enhancing T2 lesions with constant and concentric local expansion on conventional T1-weighted and T2-weighted images. SELs are associated with an increased risk of disability progression.
Methods:
Myelin-related changes detected using myelin water fraction (MWF) and magnetisation transfer ratio (MTR) in SELs and T2 lesions were measured over 192 weeks in participants with relapsing MS.
Results:
In participants with SELs (SEL+), SELs (MWF: 0.12 ± 0.03, MTR: 33.1 ± 3.6 pu) showed reduced myelin measures at baseline compared to T2 lesions (MWF: 0.13 ± 0.02, MTR: 35.1 ± 2.4 pu). In participants without SELs (SEL−), T2 lesions had higher myelin measures (MWF: 0.15 ± 0.02, MTR: 36.2 ± 2.0 pu) compared to T2 lesions in SEL+. Over 4 years, only SELs showed decreases in MWF (−11.4%). The percentage of abnormal voxels within normal-appearing white matter was higher in SEL+ and increased over time (SEL+ MWF Week 0: 0.56%, Week 192: 0.98%; SEL− MWF Week 0: 0.13%, Week 192: 0.25%).
Conclusion:
Our results indicate progressive focal and global demyelination in SEL+ participants and that the presence of SELs might be a biomarker for participants with ongoing diffuse or smouldering inflammation within the whole brain.
Keywords
Introduction
Multiple sclerosis (MS) is a chronic neuroinflammatory and neurodegenerative disease characterised by focal white matter lesions. These lesions can display a range of pathology including demyelination, inflammation, edema and axonal loss. A subset of lesions termed ‘chronic active’ or ‘smouldering’ show an accumulation of microglia/macrophages at their rim which may be associated with slow expansion and/or iron accumulation over time,1–4 and with disability progression.
Slowly expanding lesions (SELs) can be detected using serial conventional T1-weighted and T2-weighted (T2w) magnetic resonance imaging (MRI) data. 5 SELs were defined as contiguous regions of pre-existing T2 lesions that show constant and concentric expansion as assessed by the Jacobian determinant of the non-linear deformation between reference and follow-up scans. 5 By examining both the constancy over time and concentricity of their expansion (heuristic score ⩾ 0), candidate SELs can be further classified as either definite or possible SELs. 6 SELs are thought to represent lesions with chronically active inflammation, presumed leading to ongoing demyelination and axonal damage.1,2 However, the time course of tissue damage, especially demyelination, within SELs is not yet well understood. Furthermore, another aspect that has not yet been examined is whether more widespread demyelination and inflammation throughout the normal-appearing white matter (NAWM) are influenced by the presence or absence of SELs, referred to here as SEL+ and SEL− participants, respectively. Therefore, MRI measures that are related to myelination were included as additional sequences to the OPERA II clinical trial.
Myelin water fraction (MWF)7,8 and magnetisation transfer ratio (MTR)9,10 are both quantitative MRI measures that decrease with demyelination. Increases in quantitative T1 relaxation times (qT1) are found with both increases in water content and demyelination.11,12 The influence of water concentration differs across measures with MWF appearing to be the least affected based on previous work. 13 Previous studies on SELs have found decreases in MTR and T1 intensity over time. 5 The objective of this study was to monitor myelin-related changes over time in lesions (SELs and non-SELs) as well as NAWM using MWF, MTR and qT1 in people with relapsing MS.
Materials and methods
Participants
MS participants recruited into the OPERA II trial (clinicaltrials.gov NCT01412333) double-blind, double-dummy, active-controlled relapsing MS trial of ocrelizumab (OCR) (600 mg intravenous (IV) every 24 weeks) versus interferon β-1a (IFN) (44 μg subcutaneous, three injections weekly) 14 at the University of British Columbia (Vancouver, Canada) were invited to participate in an advanced MRI substudy. During the double-blind period, advanced MRI was performed at baseline (week 0), week 24, week 48 and week 96. During the open-label extension phase of the trial, where participants maintained or switched to OCR, advanced MRI was performed at week 144 and week 192. Healthy controls (HC), matched for age and sex on a group level with MS participants, were recruited as a reference to standardise MS participant findings for physiological, non-MS-related changes in MR measures. For HCs, MRI was performed at baseline (week 0), week 48 and week 96. The UBC Clinical Research Ethics Board approved the trial and the substudy protocol (H11-02278) and all participants provided written informed consent.
MRI data acquisition
All participants were scanned with an eight-channel phased array head coil on a 3.0T Philips Achieva MRI system (Best, The Netherlands). The Myelin Water Imaging sequence was the multi-component-driven equilibrium single-pulse observation of T1/T2 (mcDESPOT). 15 This sequence allows rapid acquisition of high-resolution whole-brain data, which yields quantitative maps from which MWF can be extracted. The mcDESPOT protocol was composed of a series of sagittally oriented spoiled gradient recalled echo (SPGR) and balanced steady-state free procession (bSSFP) acquisitions across a range of flip angles (α) and an inversion-recovery-prepared SPGR (IR-SPGR) scan for correction of flip angle inhomogeneity. 16 The MRI sequence parameter list is given in Table 1. Only a subset of MS participants agreed to have the MTR scan as it was optional in our protocol. A 3D T1-weighted scan (3DT1) was collected for image registration and white matter segmentation. For lesion identification, a proton density-weighted (PDw), a T2w and a fluid attenuated inversion recovery (FLAIR) sequence were collected.
MRI sequence parameter list.
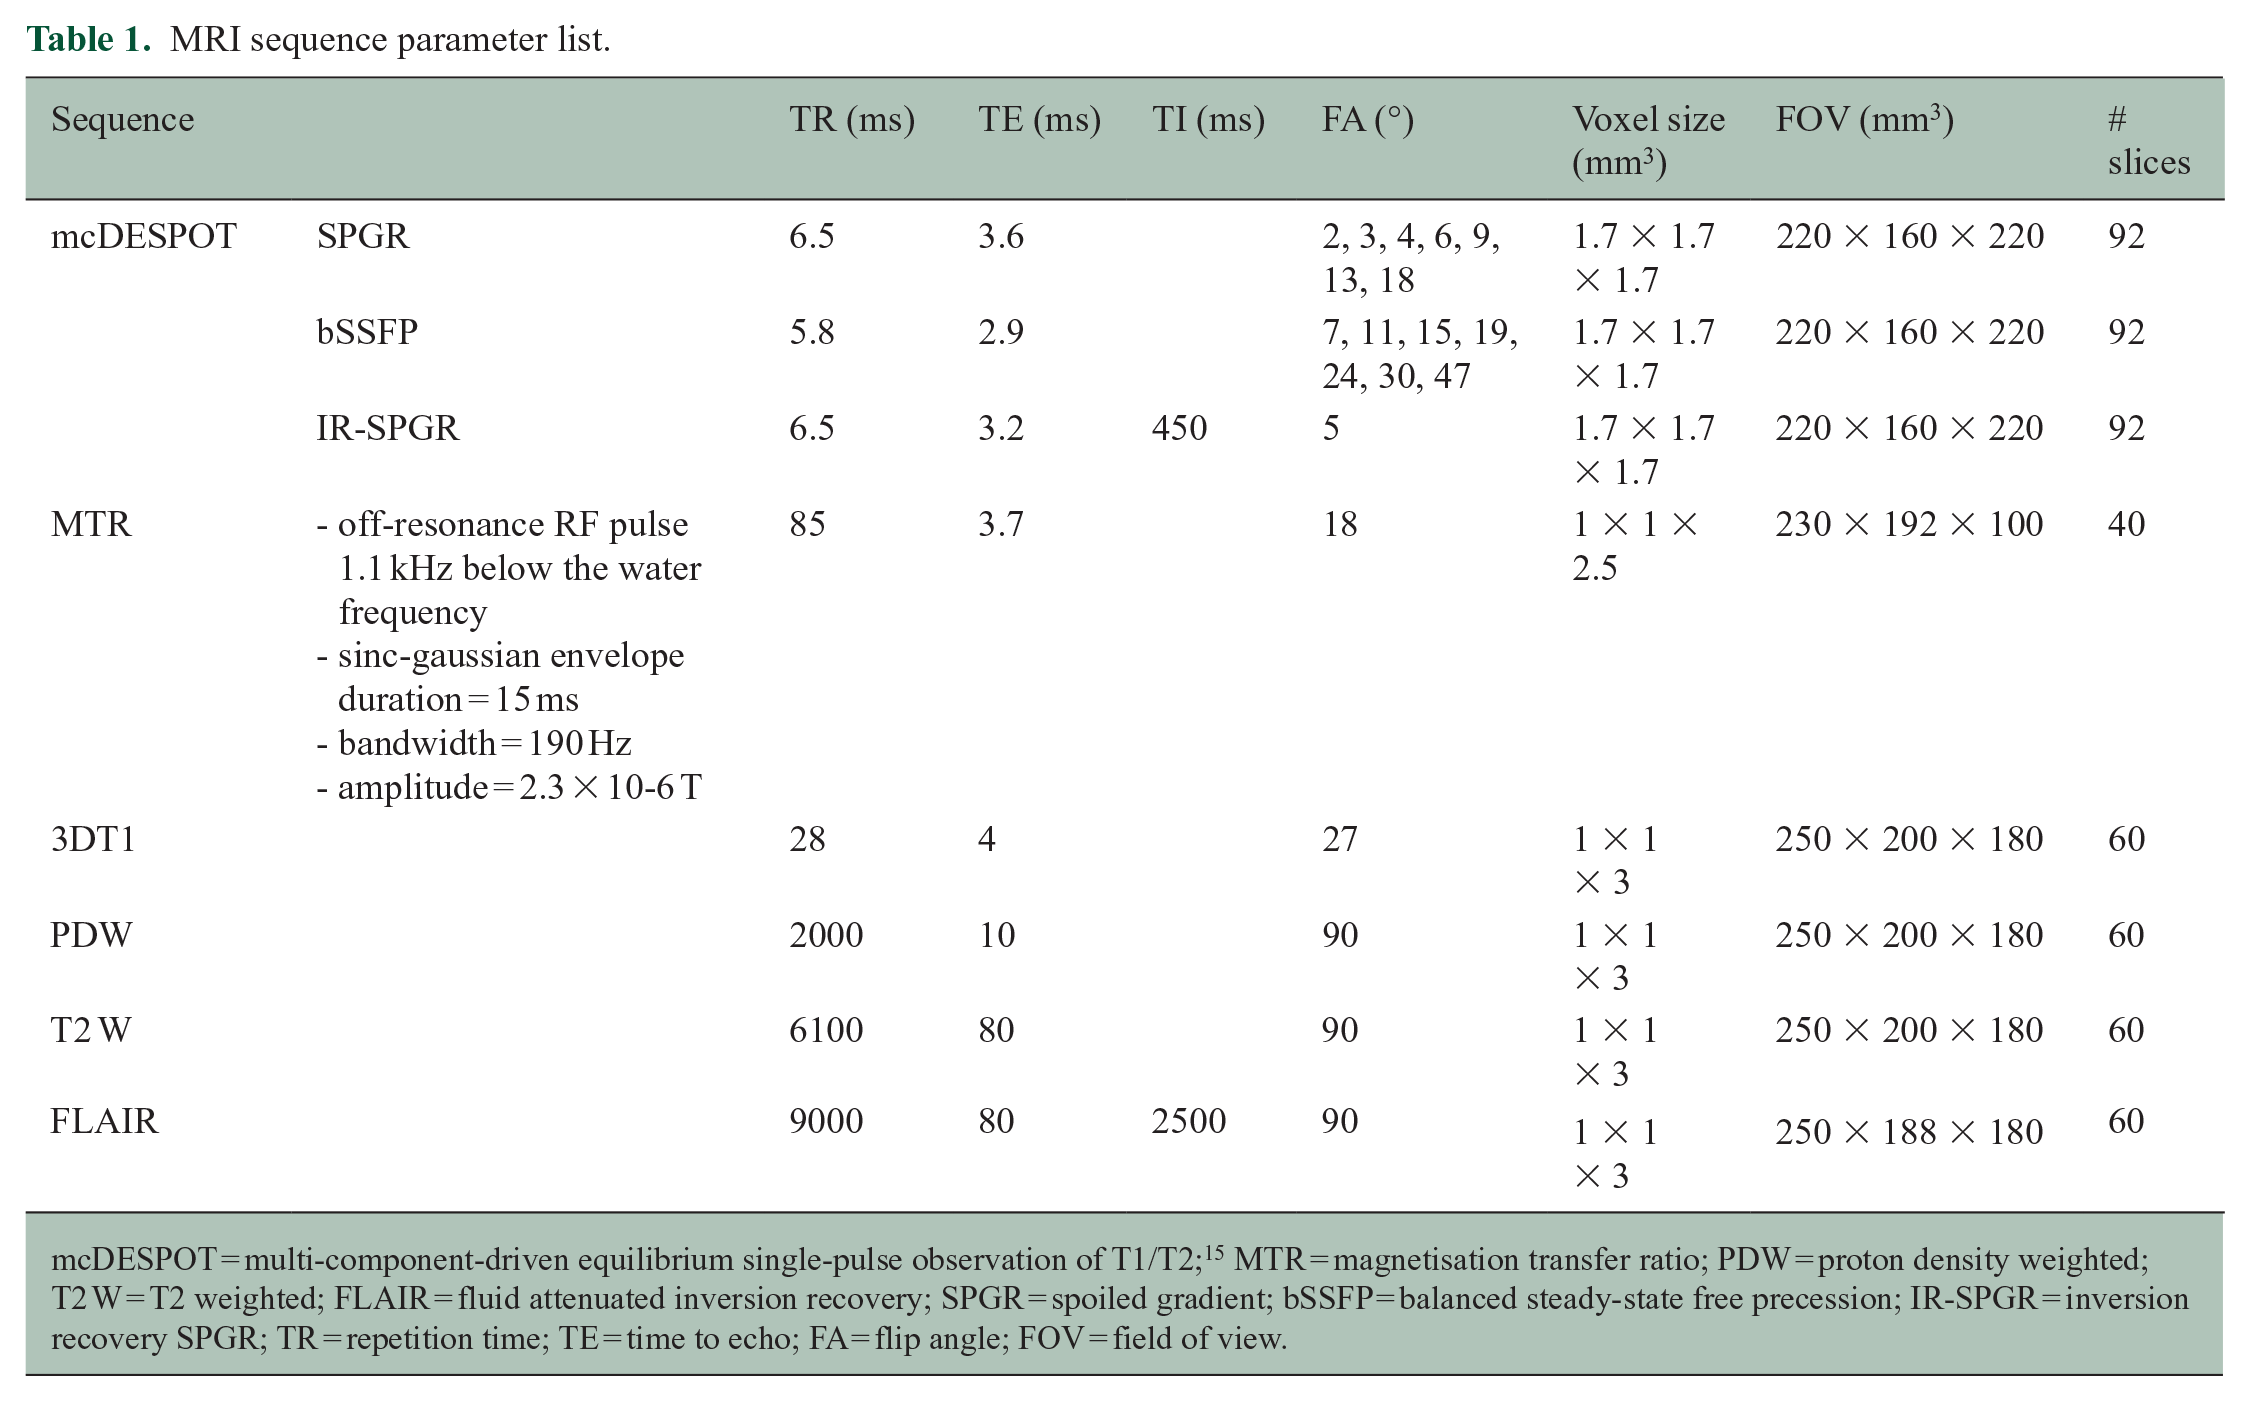
mcDESPOT = multi-component-driven equilibrium single-pulse observation of T1/T2; 15 MTR = magnetisation transfer ratio; PDW = proton density weighted; T2 W = T2 weighted; FLAIR = fluid attenuated inversion recovery; SPGR = spoiled gradient; bSSFP = balanced steady-state free precession; IR-SPGR = inversion recovery SPGR; TR = repetition time; TE = time to echo; FA = flip angle; FOV = field of view.
Analysis
MWF maps were calculated from the mcDESPOT images using the processing methods outlined in Deoni and Kolind; 17 briefly, the SPGR and IR-SPGR scans were used for DESPOT1 with High-speed Incorporation of RF Field Inhomogeneities (DESPOT1-HIFI) analysis, 18 resulting in maps of the global quantitative T1 (qT1) and the B1 field. The bSSFP data and the global qT1 and B1 maps were then used to calculate global T2 and B0 field maps using DESPOT2 with full modelling (DESPOT2-FM) analysis. 19 Finally, the B0 and B1 maps combined with the SPGR and bSSFP (with both phase-cycling schemes) were used to calculate the MWF using stochastic region contraction. 17
For each participant, a subject-specific template was created using all the high-flip-angle T1-weighted SPGR images collected between 0 and 96 weeks, using ANTs (Advanced Normalization Tools). 20 The MWF, MTR, qT1, T2W and 3DT1 images at each time point were then registered to this template using ANTs (T2W, MWF and qT1) or FLIRT from the FSL toolbox (3DT1 and MTR).
Lesions identification and classification
Prior to identification of SELs, T2 lesions were identified in baseline scans using a semi-automated method, where a fully automated segmentation 21 was subsequently manually reviewed and corrected by trained MRI readers. SELs were derived from the T1-weighted and T2w images using only the timepoints from baseline to week 96 (not the full 192 weeks of the study) as outlined in Elliott et al. 5 using the Jacobian analysis method. Non-SELs were defined as all pre-existing T2 lesions not identified as SELs. SEL masks were based on the baseline T2w lesion mask (the portion of the baseline mask that showed expansion over time). Individual lesions were not tracked over time (due to the difficulty of separating confluent lesion) but lesion Regions of Interest (ROIs) were tracked and kept constant over time unless an area of the ROI became CSF and then those voxels were excluded. The SEL boundaries did not consider the lesions masks at the final 96-week scan (although the algorithm considered the 96-week scan directly when assessing lesion expansion). Final SELs were determined by filtering based on minimum combined concentricity/constancy z-score, as outlined in the original methods paper. 5 The minimum rate of expansion for SEL definition is 12.5% annually for the core area and a minimum expansion of 4% annually for any adjoining voxels also included as part of the SEL. Lesion masks were registered to the subject-specific template using the T2W registration matrix.
Three lesion categories were defined
From participants without SELs:
1. Non-slowly expanding T2-hyperintense lesions (T2LSEL−)
From participants with SELs:
2. Non-slowly expanding T2-hyperintense lesions (T2LSEL+)
3. SELs (SELSEL+).
Mean MWF, MTR and qT1 were extracted in T2LSEL−, T2LSEL+ and SELSEL+ at each timepoint up to week 192.
Z-scores
Voxel-wise comparisons of quantitative MRI measures (MWF, MTR, qT1) were made between individuals with MS and an HC atlas, as described in Dvorak et al. 22 In summary, the HC subject-specific anatomical templates were registered to a common anatomical template using ANTs and averaged. Each MS subject-specific anatomical template was registered to this new HC template. These registrations were then applied to the MWF, MTR and qT1 maps. The mean and standard deviation from all the registered control MR maps were determined and used to derive z-score maps for each MS participant using

NAWM masks, created using FAST on the high-flip-angle T1-weighted SPGR images and subtracting the lesion masks, 23 were also registered to the common template, and the percentage of abnormal voxels (defined as number of voxels with a z-score < −4 for MWF and MTR or > 4 for qT1) within this NAWM mask was determined for each participant.
Statistics
A Wilcoxon rank-sum test was used to compare baseline measures from T2LSEL−, T2LSEL+ and SELSEL+. For longitudinal analysis, MR measures were fit to a linear mixed effects model to account for repeated measures over time on each subject and to handle incomplete data from missing time points. The visit week and lesion type (T2LSEL−, T2LSEL+ or SELSEL+) were kept as fixed effects while the subject was set as a random effect to account for individual variability. An interaction effect between timepoint and lesion type was included and the Tukey method was used to adjust for post hoc multiple comparisons. To compare the percentage of abnormal z-score voxels within NAWM between participants with and without SELs, as above, a linear mixed effects model was used. All analyses were performed using R (‘R: The R Project for Statistical Computing’, n.d.). All tests were two-sided. As this analysis was exploratory, except where mentioned, no correction for multiple comparisons was made, and p values are provided without a strict definition of significance.24,25
Results
Fifty participants with relapsing MS and 23 age- and sex-matched HC were recruited into the MRI substudy. Participant demographics are listed in Table 2. SELs were found in 33 out of 50 participants (mean number of SELs per patient: 2.7 ± 3.6). MTR was collected in a subset of 23 participants (12 SEL+ and 11 SEL−). A schematic of the study timepoints as well as the number of participants at each timepoint is shown in Figure 1.
Patient demographics divided into participants without slowly expanding lesions (SEL−) and with SELs (SEL+).
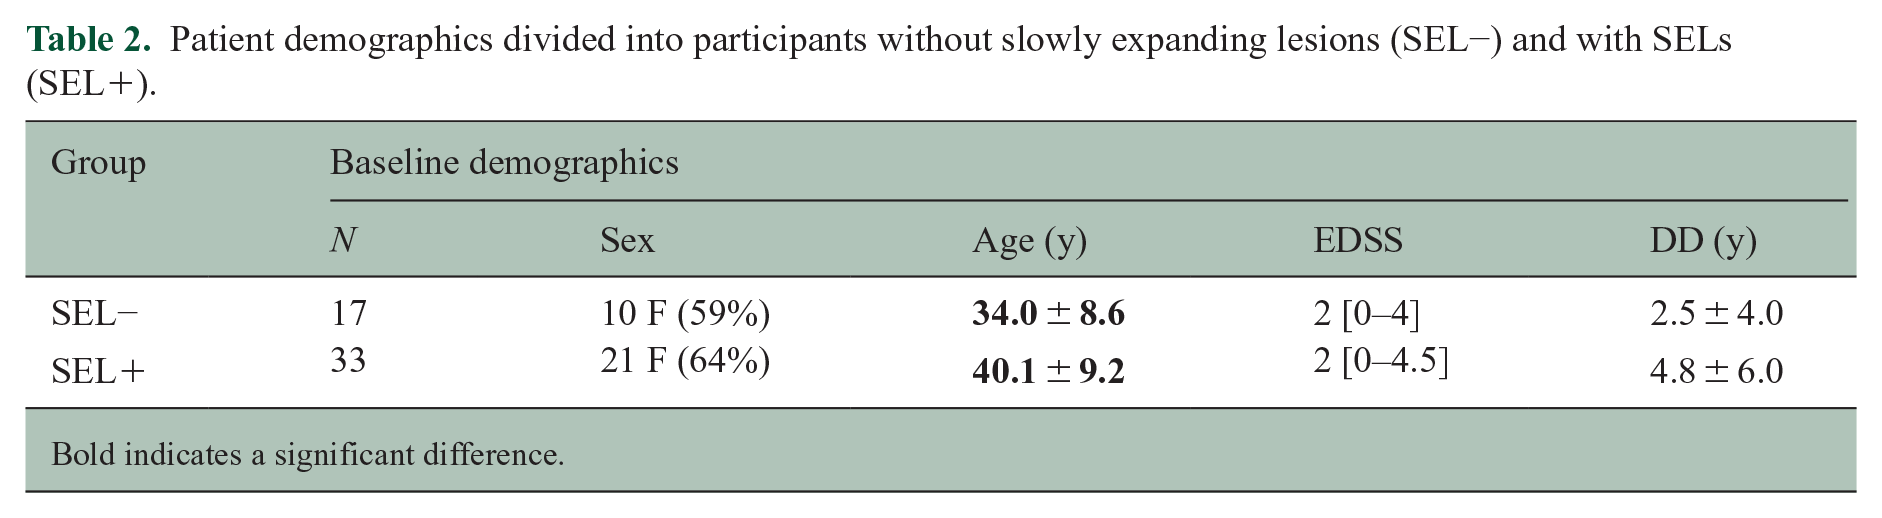
Bold indicates a significant difference.
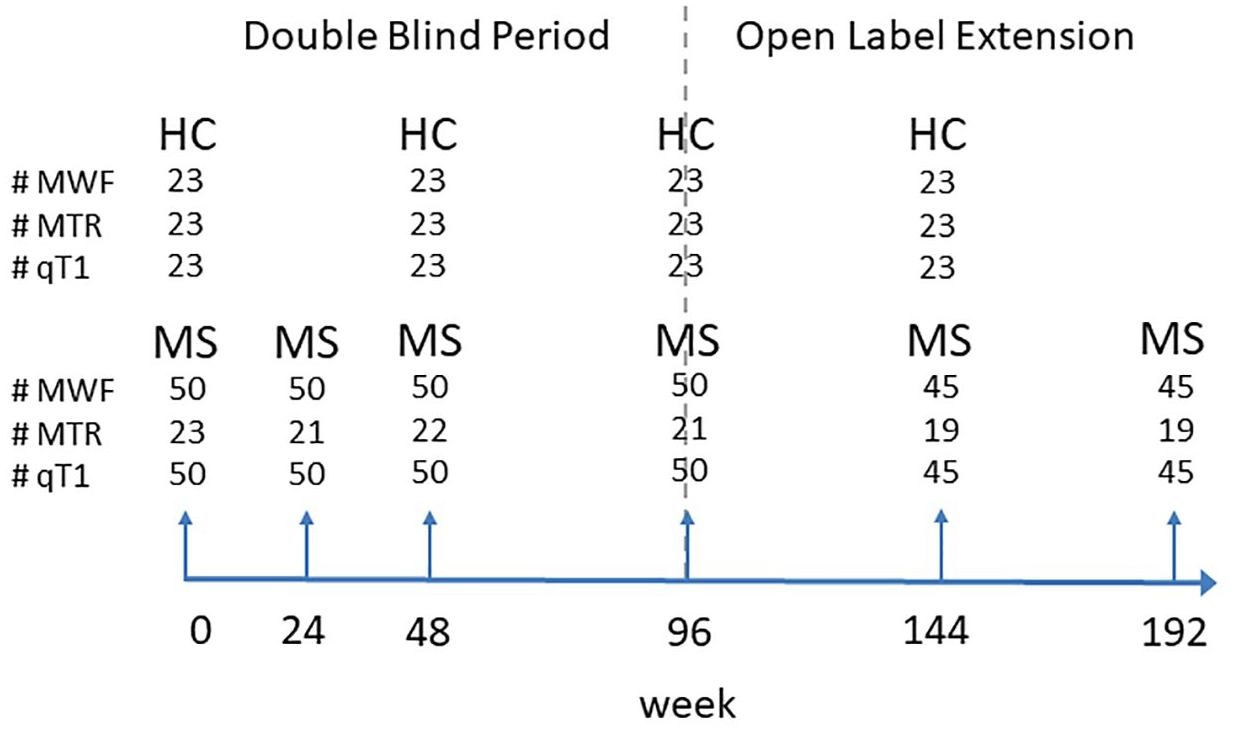
Schematic of the study setup. Short arrows indicate the timing of the scans. The dashed line divides the double-blind period (weeks 0–96) from the open-label extension (weeks 96–192). The number of participants scanned at each timepoint for healthy controls (HC) and persons living with multiple sclerosis (MS) are indicated for the three measurements: myelin water fraction (MWF), magnetisation transfer ratio (MTR) and quantitative T1 (qT1).
Over the course of 4 years, eight participants showed increased Expanded Disability Status Scale (EDSS) (by at least 1) and five participants showed decreased Expanded Disability Status Scale EDSS (by at least 1). Of the eight participants who worsened, seven were SEL+ and one was SEL−. Of the five participants who improved, two were SEL+ and three were SEL−. The remaining 36 stable participants included 23 SEL+ and 13 SEL−. EDSS was missing for one participant.
Of the 33 SEL+ participants, 19 were started on OCR (7 with MTR) and 14 on IFN (5 with MTR). Of the remaining 17 SEL− participants, 9 were started on OCR (6 with MTR) and 8 on IFN (5 with MTR). A map of the spatial distribution of both SELs and non-SELs is shown in Figure 2. The mean lesion volumes were T2LSEL− = 3960 ± 3470 mm3, T2LSEL+ = 11,360 ± 16,500 mm3 and SELSEL+ = 515 ± 835 mm3 (or 4.5% of the lesion volume in SEL+ participants). The number of SELs was 129 and the number of T2 lesions (⩾10 voxels in size to match SEL size definition) was 1047 in SEL+ participants, equivalent to 12.3% of T2 lesions. However, counting individual lesions can be difficult as large confluent masses become a single ‘lesion’ from a connectedness standpoint, but may contain multiple individual SELs (as the SEL boundaries are based on the Jacobian). The average rate of expansion for SELs, as determined via Jacobian integration, was 13.9% annually. The Jacobian can be affected by intensity changes as well as shifts in lesion boundary so that the calculated ‘expansion’ should be interpreted with care and may not be fully attributable to pure volumetric change.
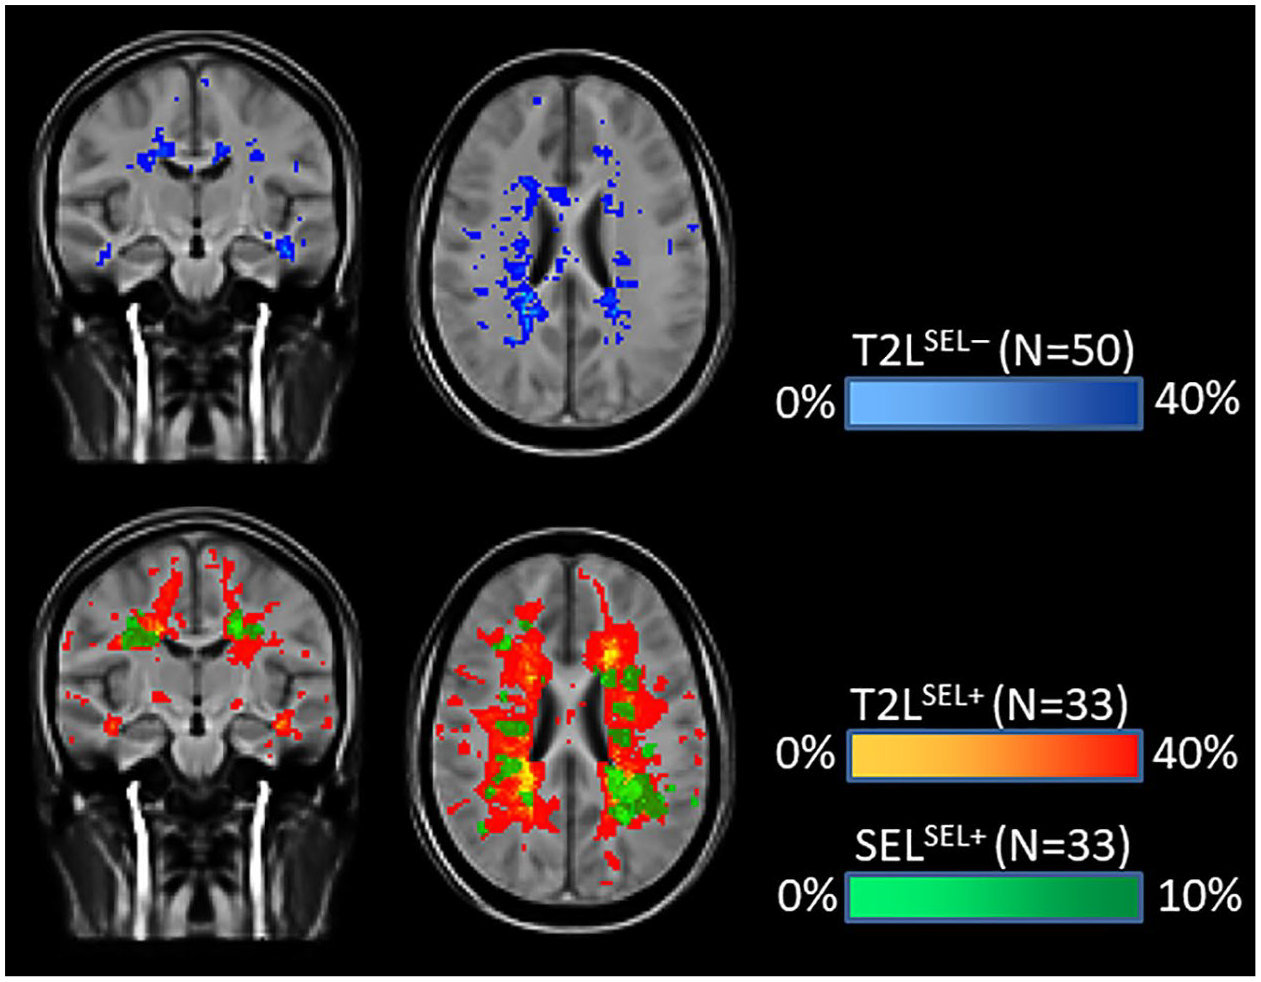
Spatial distribution for different lesion types indicating the proportion of participants (represented as %) having lesional tissue at a given voxel. Lesion type includes T2-hyperintense lesions (T2Ls) that are not slowly expanding and slowly expanding lesions (SEL). T2Ls are further divided into participants without SEL (SEL−, top row) and with SEL (SEL+, bottom row). Note that some transparency was used in the colours to highlight the overlapping distributions. Due to the smaller volume of SELs, a different scale was used. The number of participants contributing lesions to each category is indicated.
Baseline comparisons
At baseline, T2LSEL− were characterised by larger MWF and MTR, and smaller qT1 than both T2LSEL+ and SELSEL+ (Figure 3 and Table 3).
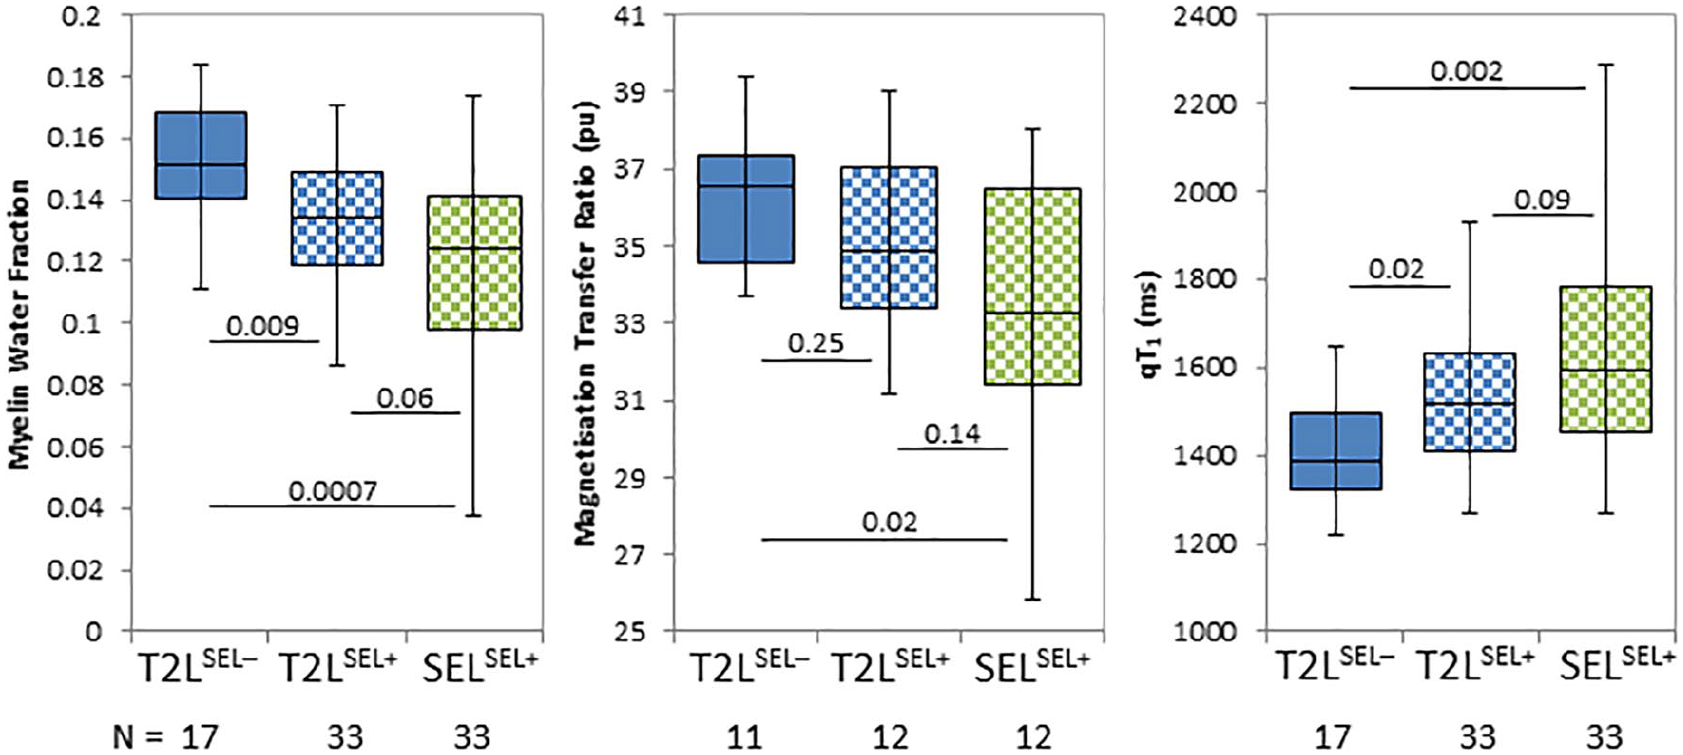
Boxplots of mean myelin water fraction, magnetisation transfer ratio and quantitative T1 relaxation time at baseline for different lesion types: T2-hyperintense lesions (T2Ls) that are not slowly expanding and slowly expanding lesions (SEL). T2Ls are further divided into participants without SEL (SEL−) and with SEL (SEL+). The number of participants (N) in each category is shown below the plots. The p values compare lesion types as indicated by the line.
MR metrics (lesion volume, myelin water fraction (MWF), magnetisation transfer ration (MTR), quantitative T1 (qT1)) divided by lesion type.
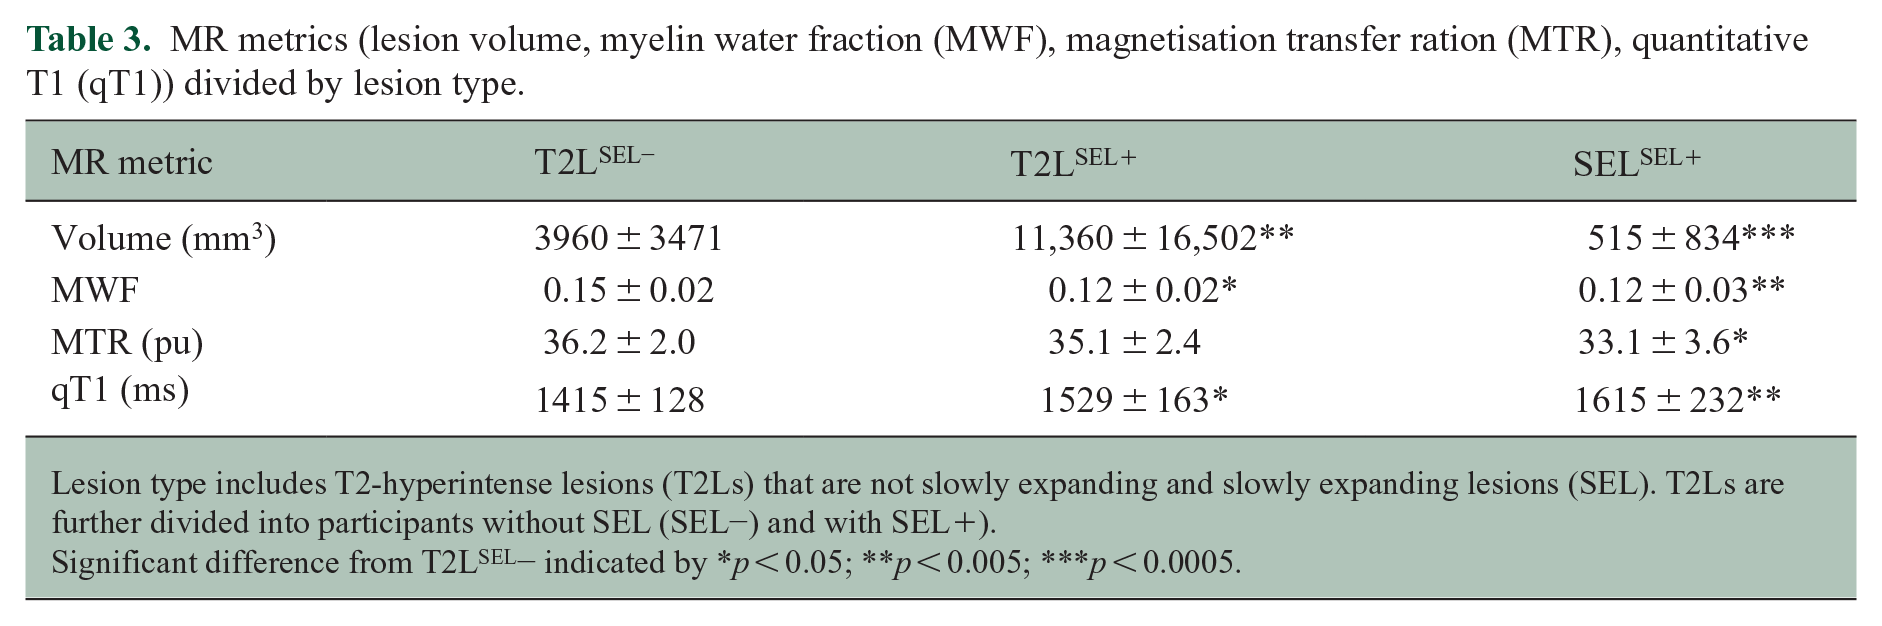
Lesion type includes T2-hyperintense lesions (T2Ls) that are not slowly expanding and slowly expanding lesions (SEL). T2Ls are further divided into participants without SEL (SEL−) and with SEL+).
Significant difference from T2LSEL− indicated by *p < 0.05; **p < 0.005; ***p < 0.0005.
Lesions over time
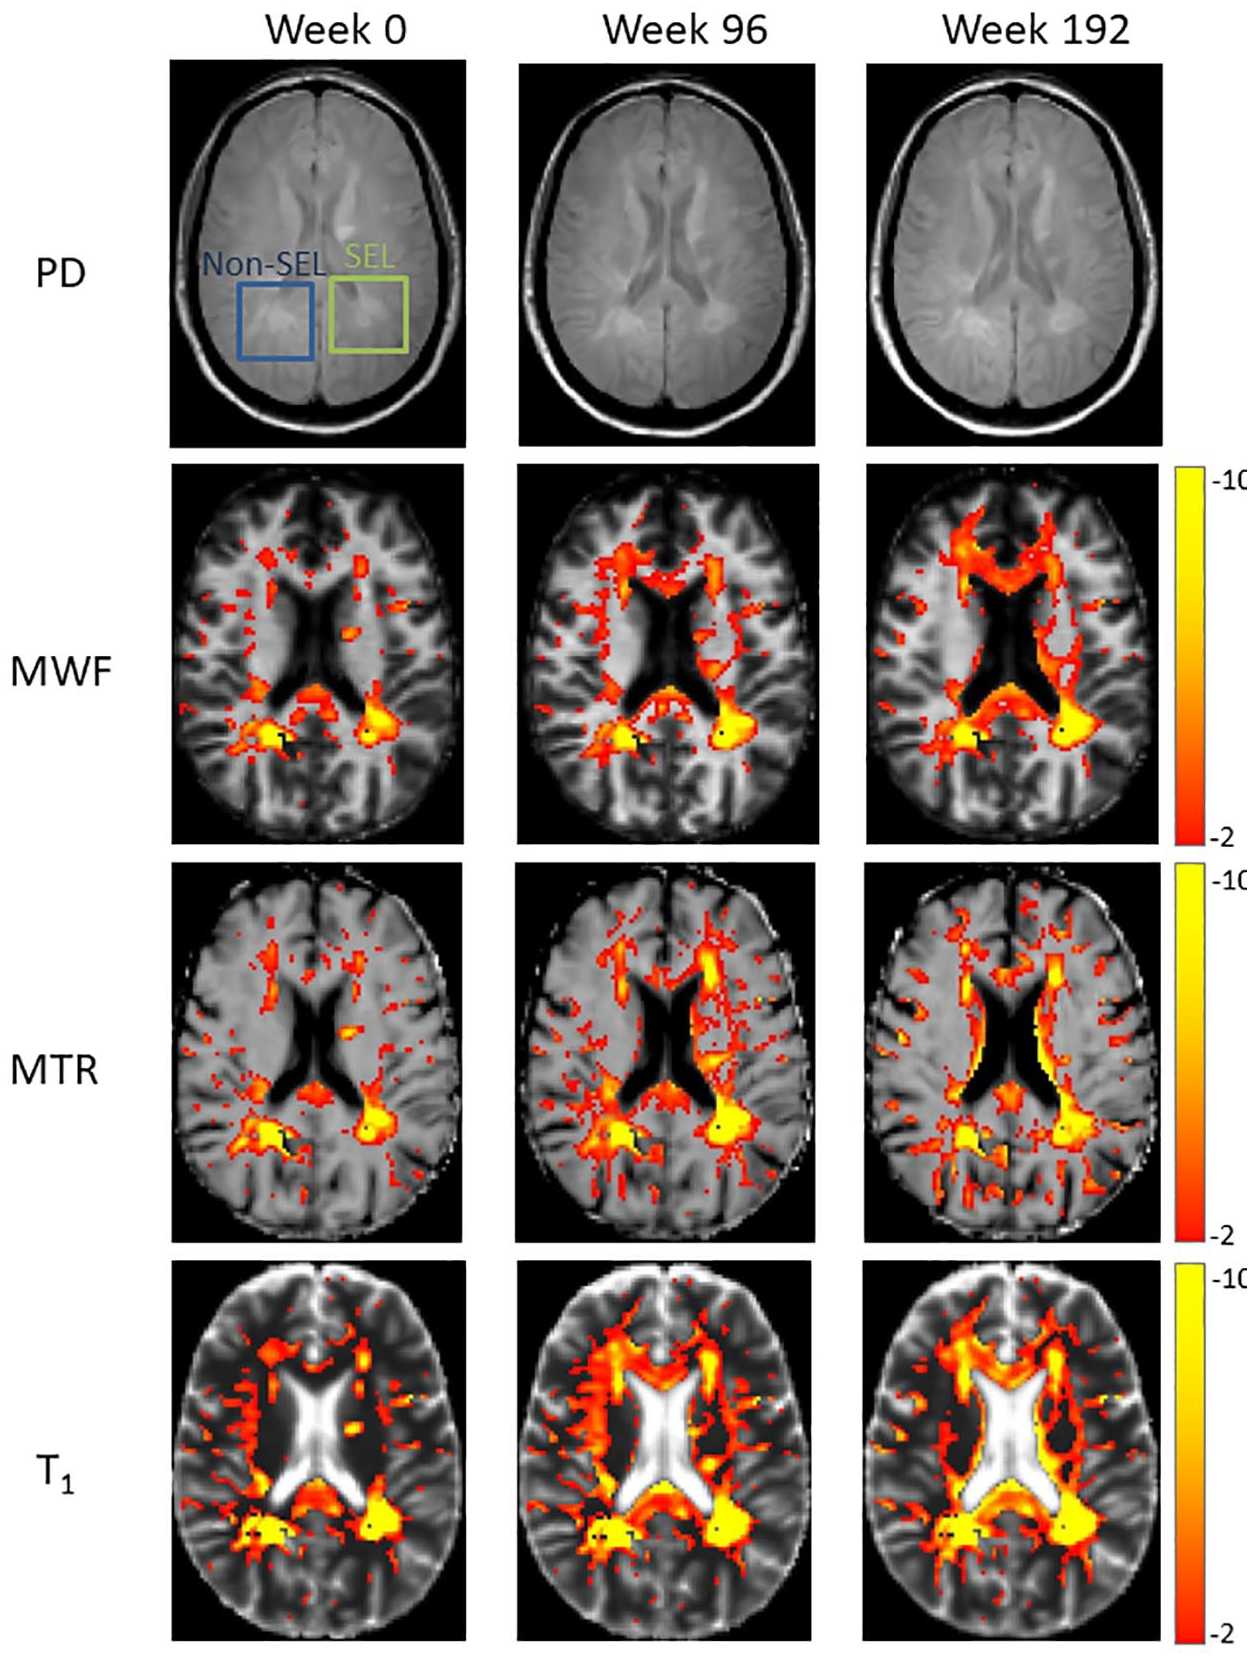
Example MWF, MTR and qT1 maps at 0, 96 and 192 weeks from a representative participant with both SELs and non-SELs are shown in Figure 4.
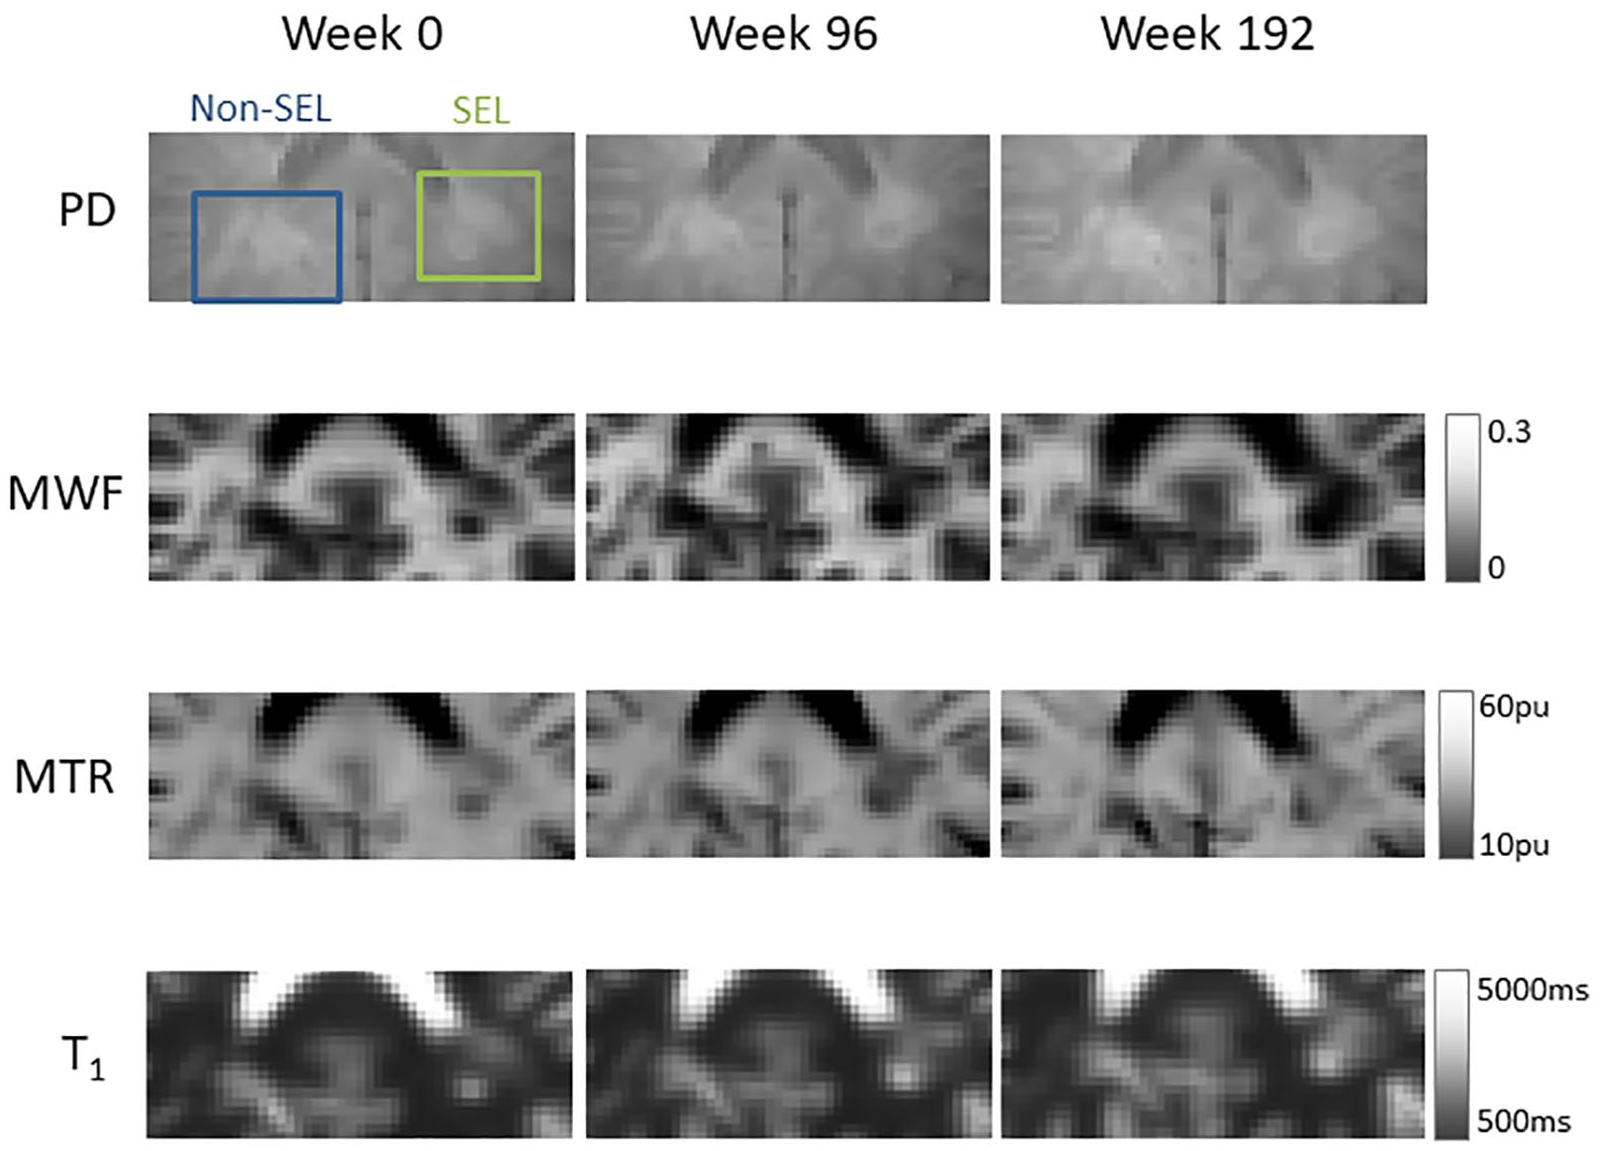
Example proton density (PD)-weighted, myelin water fraction (MWF), magnetisation transfer ratio (MTR) and T1 relaxation time images from a participant showing a slowly expanding lesions (SEL) and non-SEL.
Table 4 reports mean MWF, MTR and qT1 within different lesion types over time, as well as comparisons between the different lesion types. From baseline to week 192, SELSEL+ showed a decrease in MWF (−11.4%, p = 0.0001) and MTR (−0.9%, p = 0.7) and increase in qT1 (9.7%, p < 0.0001) (Figure 5). T2LSEL+ only showed a small increase in qT1 (3.5%, p = 0.2) but no change in MWF or MTR over time. T2LSEL− showed no change in any MR metric over time. Mean MWF, MTR and qT1 for individual participants are shown in Supplemental Figure 1 demonstrating the greatest variability within SELSEL+ and the least variability within T2LSEL−.
Mean (standard error) MR measure (myelin water fraction (MWF), magnetisation transfer ratio (MTR) and quantitative T1 relaxation time (qT1)) from the mixed-model results for each lesion type.
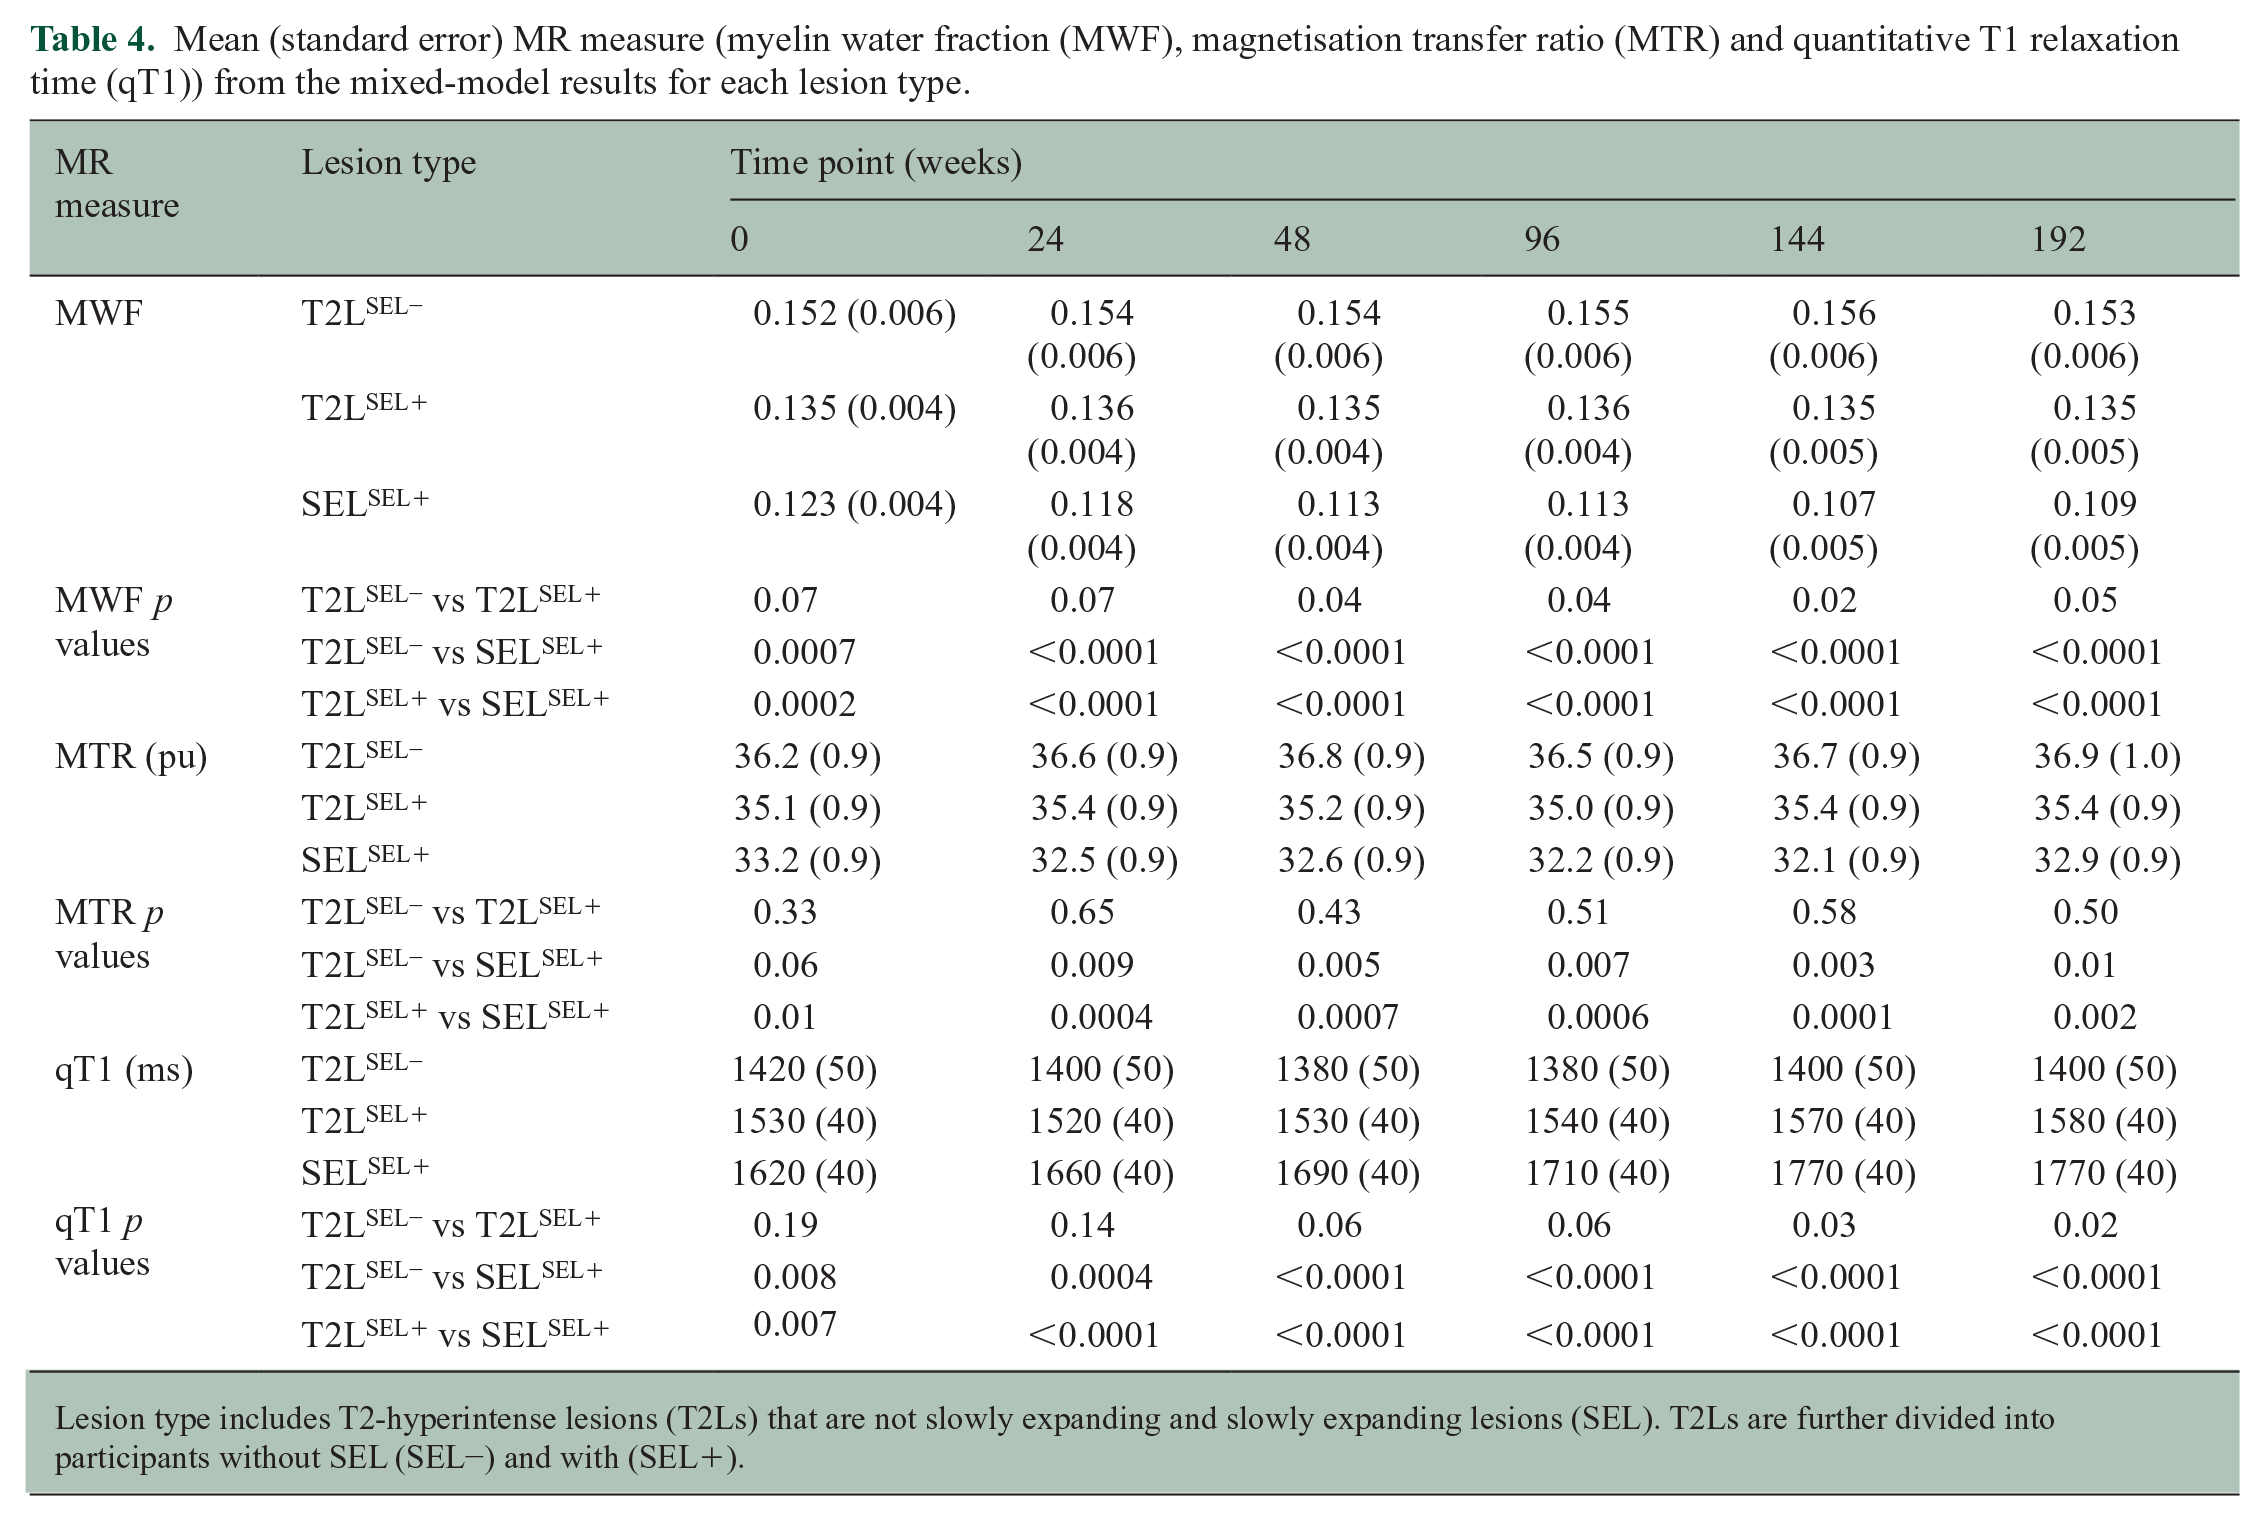
Lesion type includes T2-hyperintense lesions (T2Ls) that are not slowly expanding and slowly expanding lesions (SEL). T2Ls are further divided into participants without SEL (SEL−) and with (SEL+).
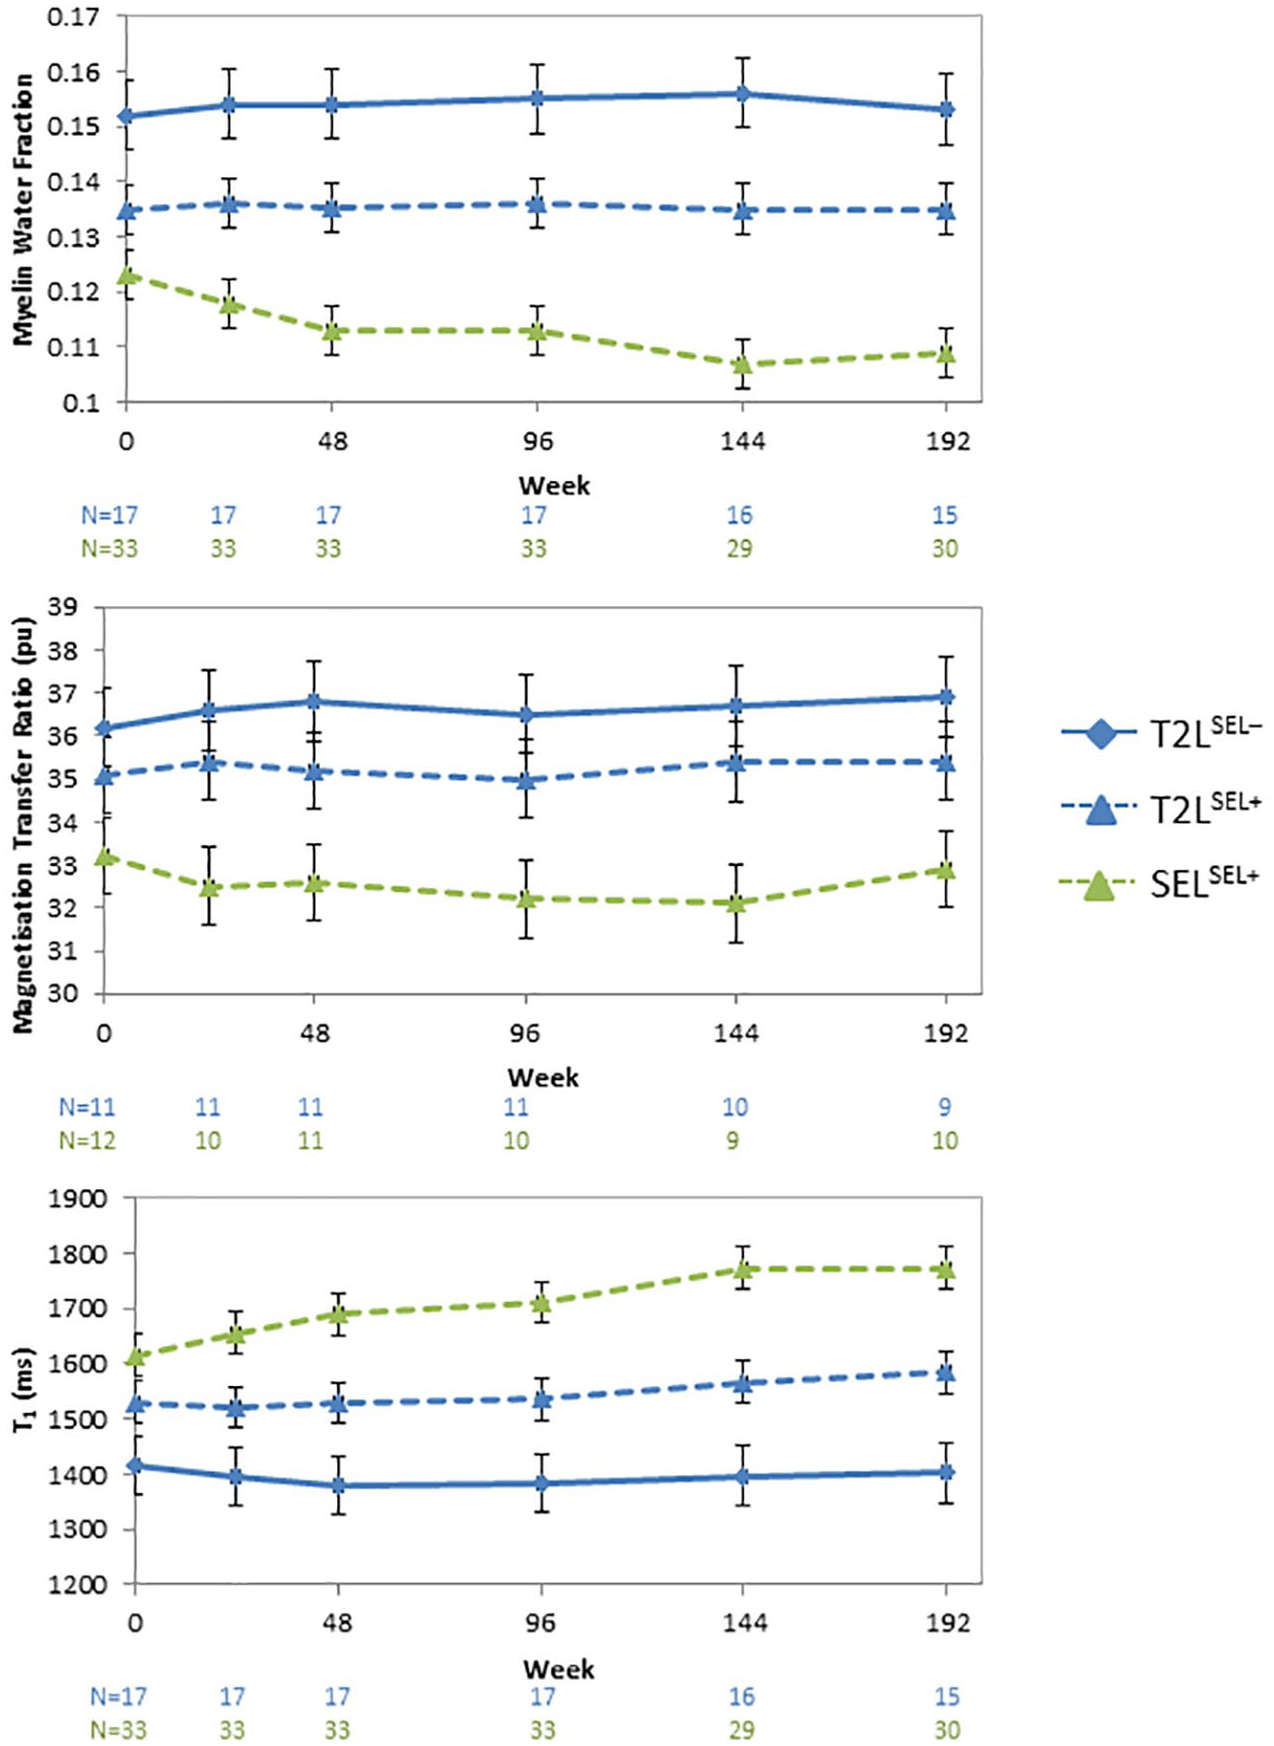
MR measures divided into lesion type including T2-hyperintense lesions (T2Ls) that are not slowly expanding and slowly expanding lesions (SEL). T2Ls are further divided into participants without SEL (SEL−) and with SEL (SEL+). Mixed-effects model mean myelin water fraction, magnetisation transfer ratio and T1 relaxation time are shown over 192 weeks. Error bars denote standard errors. The number of participants (N) at each timepoint is shown below the plots. Note that the number of SEL+ participants with T2L and SEL are the same.
Lesions divided by treatment
The percentage of participants treated with OCR or IFN that had SELSEL+ lesions was the same at 66.7% (# OCR SEL−/+ = 9/18; # IFN SEL−/+ = 7/14). Mean SELSEL+ volumes for the two treatment arms were 464 mm3 (range: 29–2330 mm3) for OCR and 584 mm3 (39–3718 mm3) for IFN. The percent change in lesions from week 0 to 96 and from week 96 to 192 are shown for MWF, MTR and qT1 in Figure 6. Lesions were divided based on treatment with OCR or IFN. From week 96 to 192, all participants were treated with OCR. For MWF, T2LSEL− showed similar changes for both OCR- and IFN-treated participants with differences over time hovering around 0 (mean range: −1.5 to +3.6%). For T2LSEL+, initial treatment with OCR resulted in a small increase in MWF (mean ± standard error: 3.2 ± 1.4%). In SELSEL+, the largest decrease in MWF was seen in IFN-treated participants (−11.1 ± 2.1%) which shifted to a smaller MWF change after switching to OCR (−4.6 ± 2.4%). Similar results were seen for MTR. For qT1, T2LSEL− and T2LSEL+ showed only small changes over time (range: −3.0 to +4.5%). SELSEL+ showed increasing qT1 in both treatment arms from week 0 to 96 (OCR: 5.0 ± 1.8%, IFN: 6.5 ± 1.6%) and week 96 to 192 (OCR: 4.2 ± 1.6%, IFN: 3.4 ± 2.1%).
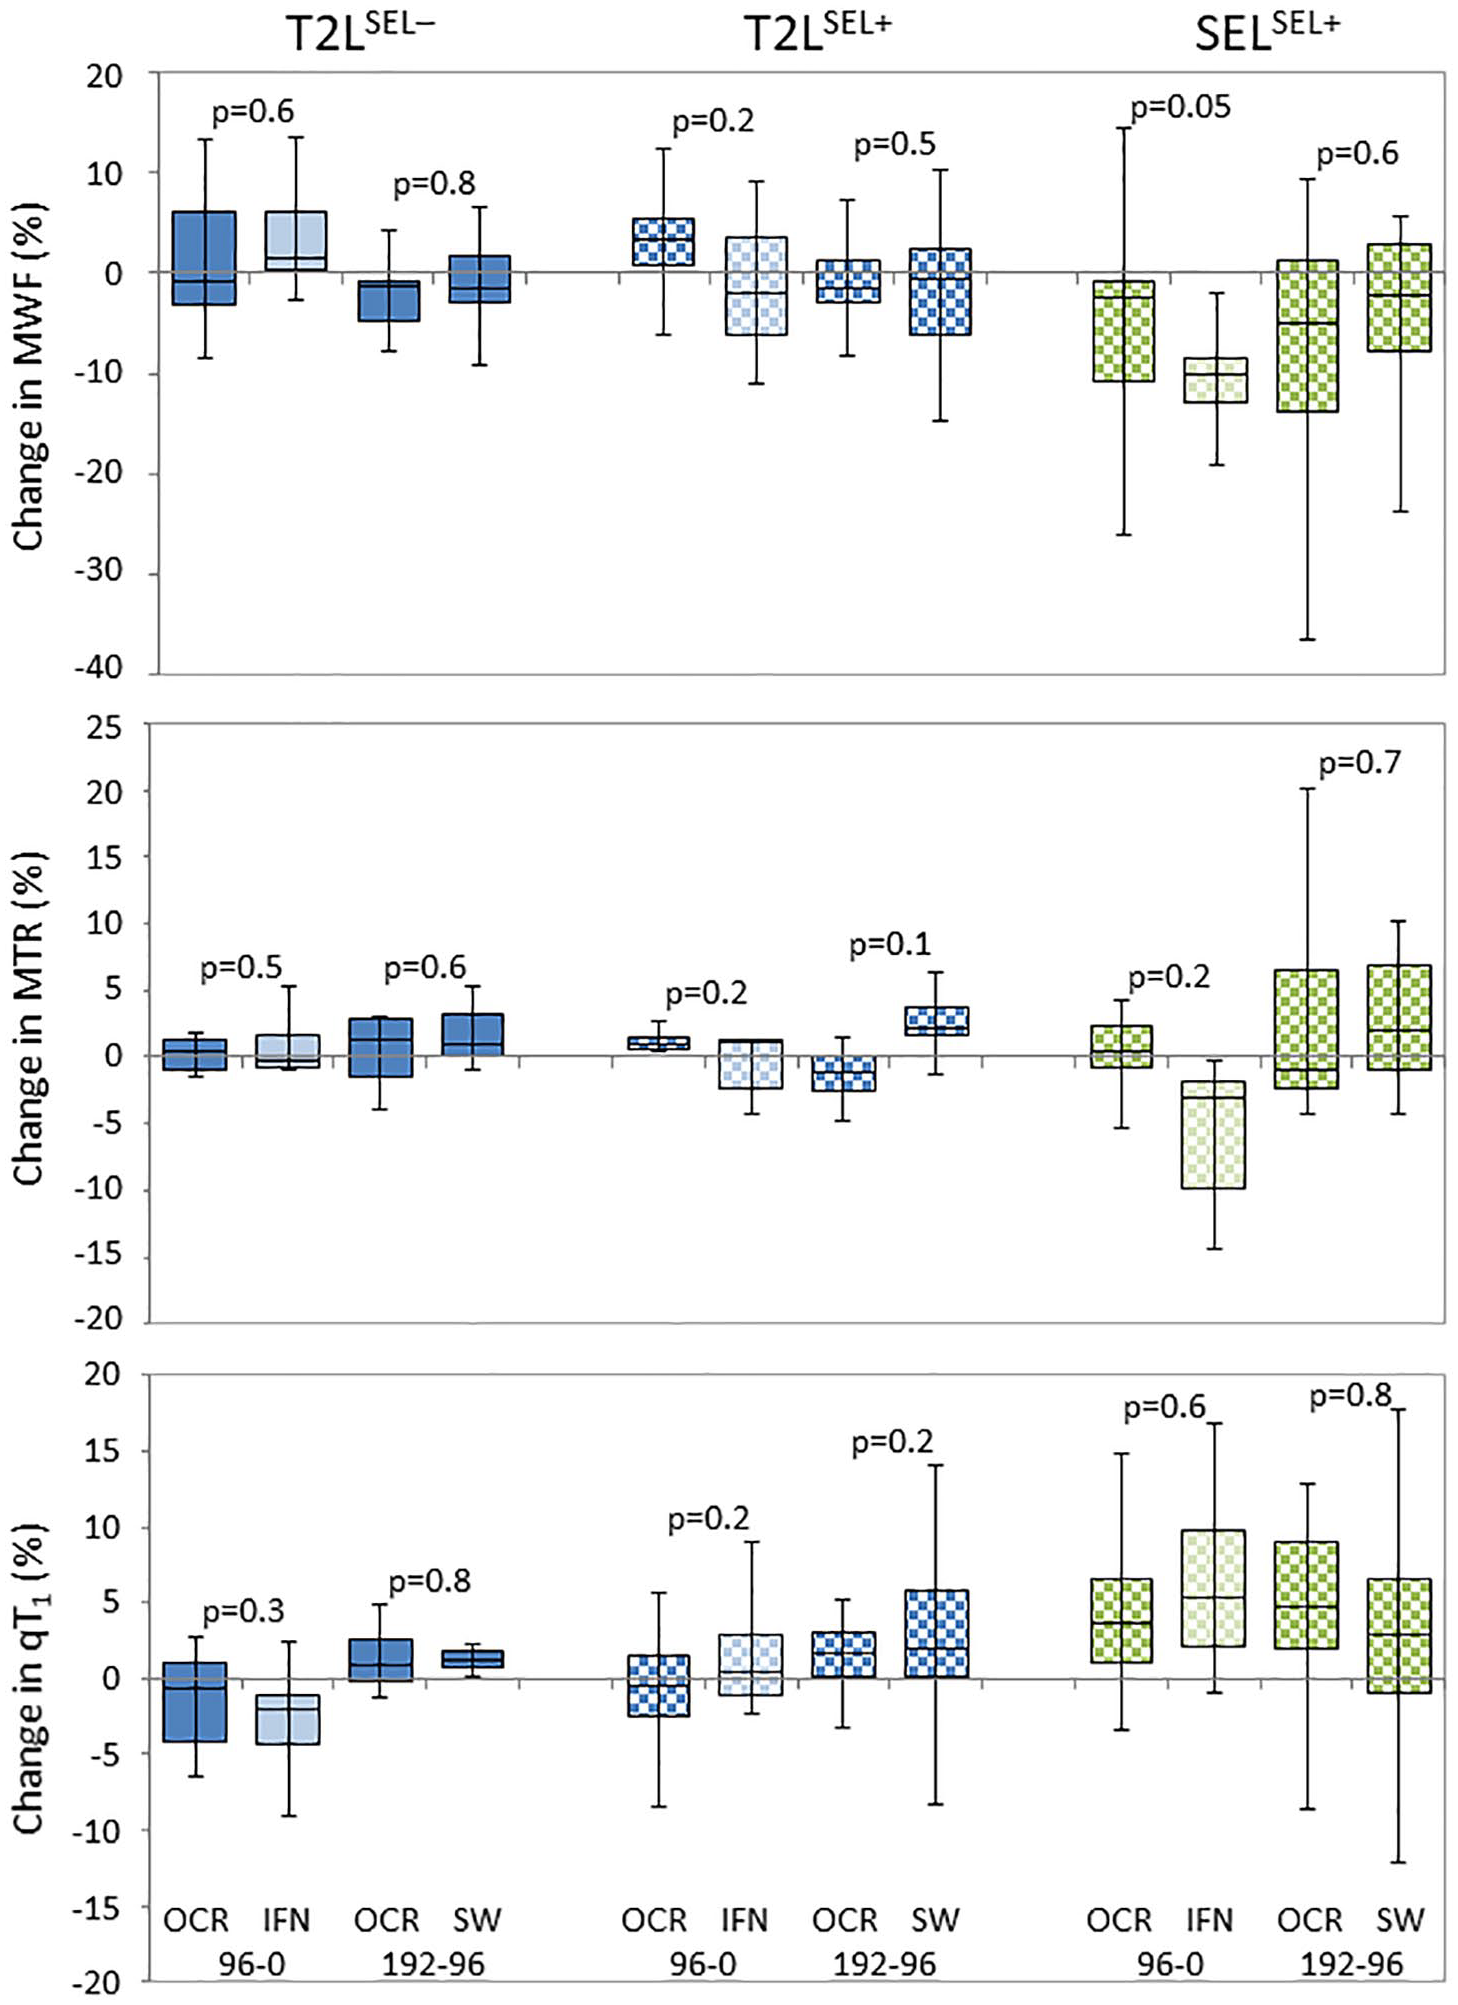
Change in myelin water fraction (MWF), magnetisation transfer ratio (MTR) and quantitative T1 relaxation time (qT1) from week 0 to 96 and week 96 to 192 for each lesion type (T2 hyperintense lesions (T2Ls) that are not slowly expanding and slowly expanding lesions (SEL); T2Ls are further divided into participants without SEL (SEL−) and with SEL (SEL+)) for participants treated with ocrelizumab (OCR) from week 0 to 192 or interferon-β1a (IFN, lighter colour) from week 0 to 96 and then switching to OCR (SW) for weeks 96–192. The p values indicate t test between OCR and IFN (for weeks 0–96) and OCR and SW (for weeks 96–192).
Z scores for NAWM
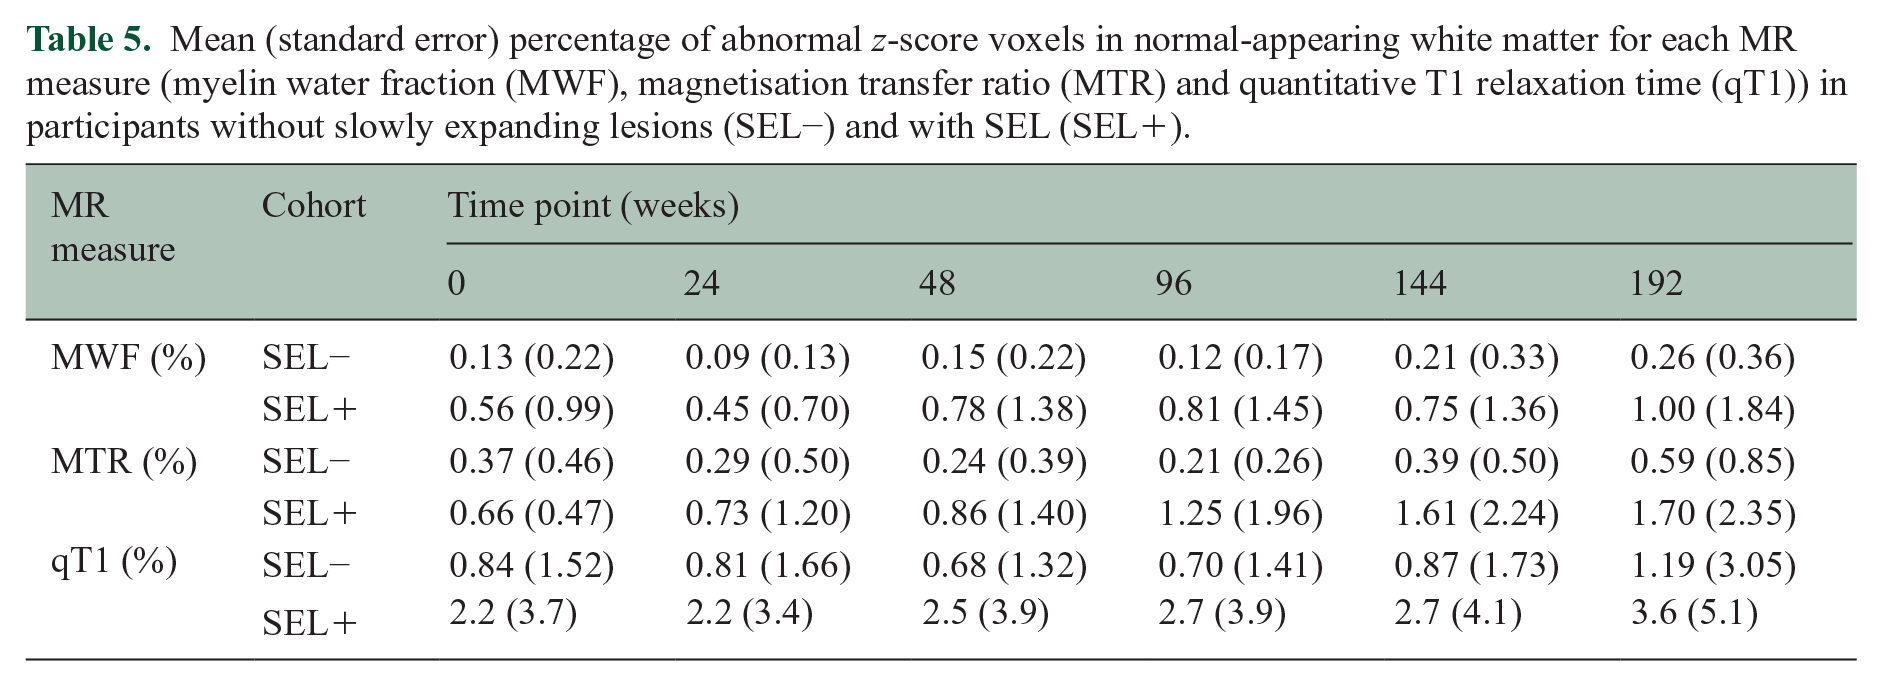
Example z-score maps for MWF, MTR and qT1 maps at 0, 96 and 192 weeks from the same participant as Figure 4 are shown in Figure 7. QT1 maps showed the largest number of abnormal z-score voxels, but overall, the z-score maps were consistent between the different MR measurements. For all three MR measurements, the number of abnormal z-score voxels within NAWM was larger in SEL+ participants than SEL− and this gap increased over time as SEL+ participants accumulated more abnormal z-score voxels within NAWM (Figure 8 and Table 5). The number of abnormal voxels within NAWM for each individual over time are shown in Supplemental Figure 2.
Example proton density (PD)-weighted images and z-scores for myelin water fraction (MWF), magnetisation transfer ratio (MTR) and T1 relaxation time from a participant showing slowly expanding lesions (SEL) and non-SELs over 192 weeks.
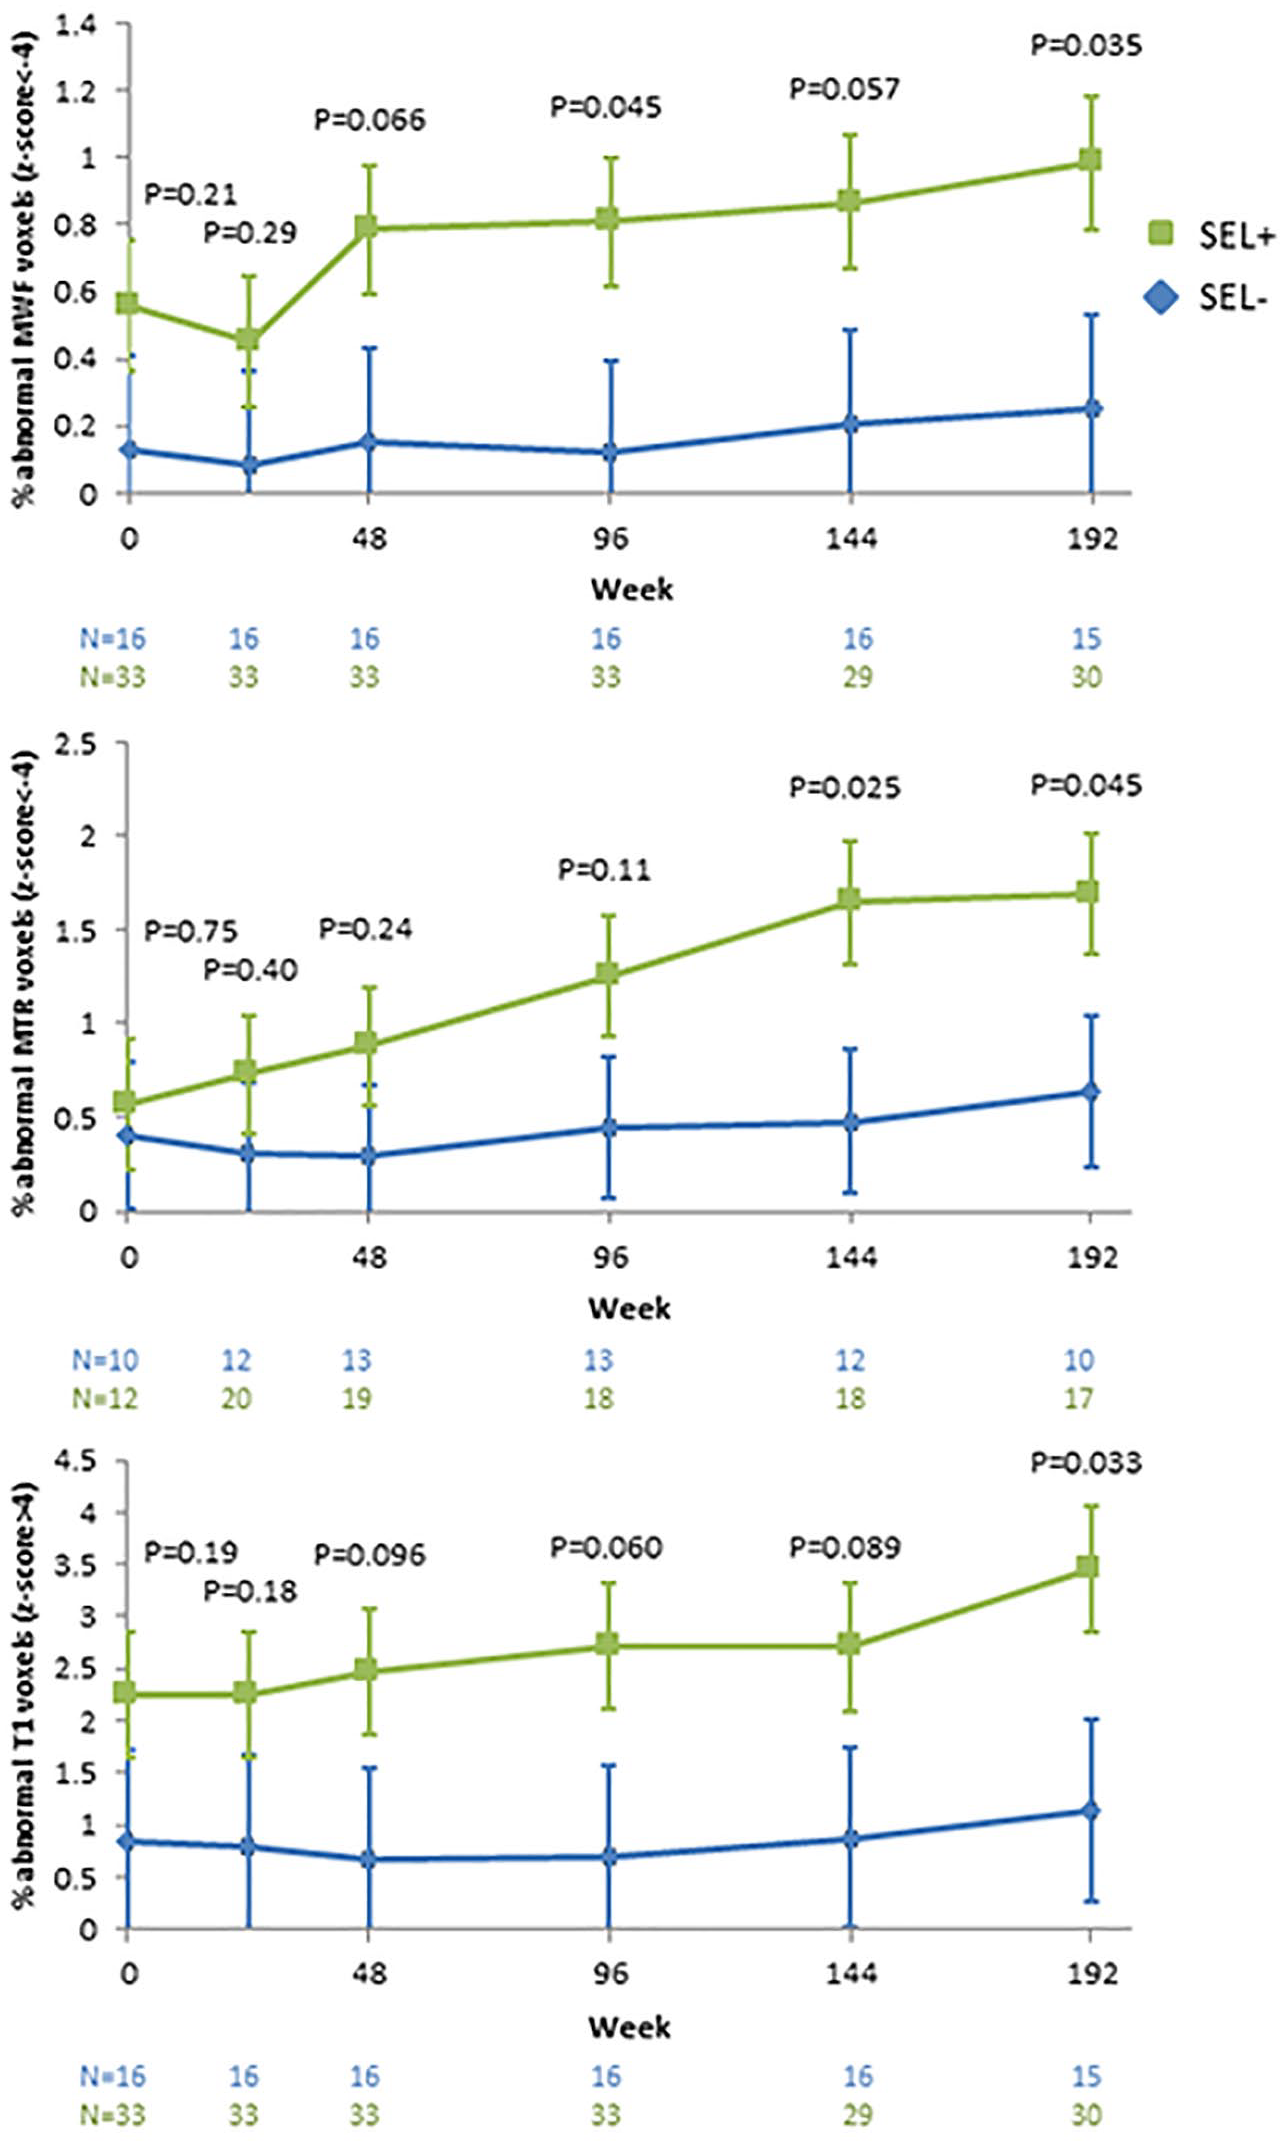
Linear mixed effects model mean percentage of abnormal NAWM voxels for myelin water fraction (MWF), magnetisation transfer ratio (MTR) and T1 relaxation time over 192 weeks in participants with slowly expanding lesions (SEL+) and without SELs (SEL−). Error bars denote standard errors. The p values compare SEL+ and SEL− at each time point. The number of participants (N) at each timepoint is shown below the plots.
Mean (standard error) percentage of abnormal z-score voxels in normal-appearing white matter for each MR measure (myelin water fraction (MWF), magnetisation transfer ratio (MTR) and quantitative T1 relaxation time (qT1)) in participants without slowly expanding lesions (SEL−) and with SEL (SEL+).
Discussion
Using advanced MR measures to characterise tissue pathology, SELs had lower MWF and MTR and higher qT1 than non-SELs suggesting more myelin loss and an increase in water content within SELs compared to non-SELs. In addition, non-SELs within SEL+ participants also showed lower MWF and higher qT1 compared to chronic T2 lesions in SEL− participants, which suggests that the occurrence of one or more SELs may be indicative of a widespread inability to resist more severe focal tissue damage. Over time, the SELs showed a continued decrease in MWF and MTR and increase in qT1, whereas non-SELs showed little change. Remarkably, even in the NAWM, the presence of SELs was associated with an increased number of voxels with lower MWF and MTR, and higher qT1, and with further deterioration over time.
Chronic active lesions have garnered interest in recent years as a potential biomarker for MS progression. Chronic active lesions have a higher prevalence in progressive forms of MS1,26 and patients with a more severe disease course have more chronic active lesions and a higher overall lesion burden. 26 Chronic active lesions tend to be surrounded by a rim of macrophages/microglia which are thought to contribute to ongoing axonal injury and neurodegeneration.1,4 This inflammatory rim often causes an expansion of the lesion over time, 2 making it possible to detect with sensitive measures of volume change.
Using a technique that measures the Jacobian determinant of the non-linear deformation field, longitudinal T1W and T2 W images can be used to identify lesions that slowly expand over time (SELs). Previous studies on SELs have shown that they are independent of enhancement, have lower T1 intensities and show decreasing T1 intensities over time. 5 SELs also showed increasing radial diffusivity and a trend to decreasing MTR over time, whereas non-SELs did not change. 27 Over 96 weeks, a greater SEL volume correlated with higher baseline lesion load, increased rate of brain atrophy and a greater reduction in MTR. 6 A 7T study found that, compared to non-SELs, SELs had lower ViSTa and qMT myelin-sensitive measurements and the ViSTa measurement showed continued myelin loss over time. 28 The multi-shell diffusion measurements from Neurite Orientation and Dispersion Imaging (NODDI) did not show differences between SELs and non-SELs. 28 MS participants with more SELs, larger SEL volume proportion and lower SEL MTR were found to have increased risk of EDSS worsening at 9 years. 29 This study supports these results with reduced MWF and MTR and increased qT1 in SELs at baseline and further changes over 4 years compared to chronic lesions in people without SELs.
Spatial distribution of SELs and non-SELs
Qualitatively, there was no apparent preferential location for SELs compared to T2 lesions; lesions were found preferentially adjacent to the ventricles. As expected, the T2LSEL+ subset was the most extensive, again providing evidence that these participants were unable to resist more severe and widespread tissue damage. The distribution of SELs was similar to that found in the larger OPERA cohort shown by Elliott et al. 5
Individual participants
When looking at lesions from individual participants, SELSEL+ had the largest variation, T2LSEL− the smallest variation for all three MR measures. Of note, a few T2LSEL+ and even more SELSEL+ had lower MWF and MTR as well as higher qT1 than the T2LSEL− group. Interestingly, in SEL+ participants, even their non-SELs (T2LSEL+) showed decreased MWF and MTR and increased qT1 compared to non-SELs in SEL− participants (T2LSEL−). Therefore, the presence of SELs may indicate an overall more inflammatory central nervous system leading to more tissue damage.
Effect of Disease Modifying Therapy
An exploratory analysis of the effect of OCR compared to IFN β-1a on the MR measures within lesions was performed and generated a hypothesis that SELs, which were detected equally in both treatment arms (two-thirds of either arm were SEL+ participants), are more susceptible to ongoing damage with IFN and protected with OCR. The differences favouring OCR over IFN are in agreement with the overall OPERA study results showing improved outcomes for OCR-treated participants on clinical measures (lower risk of confirmed disability worsening) and MRI measures (brain atrophy) associated with progression or disease worsening. The mode of action is likely through the superior effects of OCR to control peripheral inflammation and also its influence on central mediators of neuroinflammation. 30 However, with the small number of participants included, results should be interpreted with caution.
NAWM
The presence of SELs also appeared to be accompanied by more widespread pathology (i.e. larger number of abnormal z-score voxels) in the NAWM compared to the NAWM without SELs present. The inflammation associated with SELs may reflect higher levels of inflammation within the whole brain or soluble factors within the SELs may diffuse out into the surrounding NAWM leading to widespread demyelination and tissue damage. The ongoing inflammatory process within SELs also seems to contribute to the continued increase in the number of abnormal z-score voxels within the NAWM over 4 years found only in the SEL+ cohort. It should be noted that if only the mean MR metric over the whole NAWM is compared between SEL+ and SEL− participants, no difference is noted and likely regional differences are averaged out over the large ROI. By comparing each voxel to a HC atlas, both small and large differences (identified by their abnormal z-score) can be quantified.
Limitations
The main limitation for this study is the small number of participants. This was especially true for the MTR dataset where only 23 participants were included. Therefore, the study was underpowered to detect differences within treatment arms. However, by including a number of different MR measures which all showed the same patterns of differences, we are more confident in the results even with the low participant numbers. Another limitation was that SELs were identified on only the first 96 weeks of the study, and therefore, MR metric dynamics seen from baseline to week 96 are likely more consistent and stronger than the dynamics seen from week 96 to 192 where expanding lesions were not identified. The equivalence of SELs to chronic active (smouldering) lesions has been validated in limited post-mortem studies 31 and it may be that not all lesions that are labelled as slowly expanding would be classified as chronic active lesions. Detection of SELs may also be hampered by shrinkage of the lesion core after tissue degeneration; more refinement of the SEL detection technique may be needed to address this issue. At baseline, no difference in MWF, MTR or qT1 was found between T2LSEL+ and SELSEL+, suggesting that demyelination is not the primary pathology in SELs. Future studies that explore the nature of the damage in SELs are warranted. Finally, although MWF and MTR have been histologically validated as markers of myelin, their association with clinical decline and progression has not been fully evaluated.
Conclusion
SELs detected over 2 years showed lower myelin content at baseline and greater myelin loss than non-SELs over 4 years. Non-SELs in participants with SELs also showed a lower myelin content at baseline compared to participants without SELs, but did not change over time. SELs and other brain tissue in participants with SELs appear to be experiencing ongoing demyelination, presumed due to smouldering or chronically active inflammation within SELs and globally, which could be a factor in MS progression.
Supplemental Material
sj-tif-1-msj-10.1177_13524585251316519 – Supplemental material for Presence of slowly expanding lesions in multiple sclerosis predicts progressive demyelination within lesions and normal-appearing tissue over time
Supplemental material, sj-tif-1-msj-10.1177_13524585251316519 for Presence of slowly expanding lesions in multiple sclerosis predicts progressive demyelination within lesions and normal-appearing tissue over time by Irene Vavasour, Colm Elliott, Douglas L Arnold, Laura Gaetano, David Clayton, Stefano Magon, Ulrike Bonati, Carrado Bernasconi, Anthony Traboulsee and Shannon Kolind in Multiple Sclerosis Journal
Supplemental Material
sj-tif-2-msj-10.1177_13524585251316519 – Supplemental material for Presence of slowly expanding lesions in multiple sclerosis predicts progressive demyelination within lesions and normal-appearing tissue over time
Supplemental material, sj-tif-2-msj-10.1177_13524585251316519 for Presence of slowly expanding lesions in multiple sclerosis predicts progressive demyelination within lesions and normal-appearing tissue over time by Irene Vavasour, Colm Elliott, Douglas L Arnold, Laura Gaetano, David Clayton, Stefano Magon, Ulrike Bonati, Carrado Bernasconi, Anthony Traboulsee and Shannon Kolind in Multiple Sclerosis Journal
Footnotes
Acknowledgements
The authors would like to thank the participants and their families. They would like to thank the staff at the UBC MS Clinic and MS Clinical Trials as well as the staff at UBC MRI Research.
Data Availability Statement
Data sharing not applicable to this article as no datasets were generated or analysed during the current study.
Declaration of Conflicting Interests
The author(s) declared the following potential conflicts of interest with respect to the research, authorship, and/or publication of this article:
Funding
The author(s) disclosed receipt of the following financial support for the research, authorship, and/or publication of this article: Funding for this study was provided by F. Hoffmann-La Roche Ltd.
Supplemental Material
Supplemental material for this article is available online.
References
Supplementary Material
Please find the following supplemental material available below.
For Open Access articles published under a Creative Commons License, all supplemental material carries the same license as the article it is associated with.
For non-Open Access articles published, all supplemental material carries a non-exclusive license, and permission requests for re-use of supplemental material or any part of supplemental material shall be sent directly to the copyright owner as specified in the copyright notice associated with the article.