
Abstract
Background:
Treatment with cladribine tablets (CladT) in relapsing–remitting multiple sclerosis (RRMS) reduced global grey matter (GM) atrophy, but the effects on regional GM are unknown.
Objectives:
This study aimed to investigate the effect of CladT compared with placebo on magnetic resonance imaging (MRI)-derived patterns of GM atrophy.
Methods:
We used MRI and clinical data from the CLARITY study, including 393 people with RRMS (CladT (3.5 mg/kg), n = 200 or placebo, n = 193) at baseline, 24, 48 and 96 weeks after treatment initiation. SynthSeg-derived volume changes and GM atrophy patterns derived from source-based morphometry were analysed for group differences over time and associations with disability using mixed-effect models.
Results:
Deep GM (β = −0.03, p < 0.01), thalamus (β = −0.04, p < 0.01) and the brainstem–thalamus pattern (β = −0.03, p < 0.05) showed higher reduction in the placebo compared with treated group. These regions showed no effect during a predefined pseudo-atrophy period, where global volume loss was worse in the treatment group. Between W24 and W96, Expanded Disability Status Scale (EDSS) scores were associated with lower deep GM volume (β = −0.16, p = 0.001), thalamic volume (β = −0.16, p < 0.001), and the brainstem–thalamus pattern (β = −0.12, p < 0.05).
Conclusion:
CladT are associated with clinically relevant and slower neurodegeneration in RRMS. Strongest effects were seen in deep GM, thalamus, and brainstem, underlining the importance of regional MRI measures for assessing treatment effects.
Introduction
Multiple sclerosis (MS) is an inflammatory, demyelinating and neurodegenerative disorder of the central nervous system. While white matter (WM) lesions have long been considered the primary hallmark in MS,1,2 grey matter (GM) neurodegeneration is considered the primary driver of irreversible disability.3–5 Emerging research suggests that GM volume has a considerable predictive value for disability, especially thalamic and cortical atrophy, and regional measures are closely linked to clinical symptoms.5–7 Specific regional GM measures, such as thalamic and cortical volume, have been increasingly incorporated as outcomes into clinical trials.8–10 However, more advanced methods, such as atrophy patterns, remain rare in the context of clinical trials.
Disease-modifying treatments (DMT) in MS are focused on slowing down inflammation, whereas their impact on neurodegeneration remains understudied. 11 Treatment with cladribine tablets (CladT) is a high-efficacy DMT for people with relapsing–remitting MS (RRMS). CladT induce apoptosis of lymphocytes in people with MS, especially CD19+, CD4+ and CD8+, by disrupting cellular metabolism, inhibiting DNA synthesis and repair, and hence inducing apoptosis. 12 CladT are specifically indicated as a second-line treatment for highly active RRMS. Recent studies showed a slower global brain and GM volume loss in people with RRMS treated with CladT compared with placebo, suggesting a neuroprotective in addition to an anti-inflammatory effect.13,14 However, these studies only used global brain and GM volume changes as outcome measures, while regional volumes could highlight additional effects that could yield stronger clinical correlates.5,7 This regional analysis, along with data-driven patterns of co-varying GM atrophy (referred as GM patterns), could uncover specific mechanisms of treatment impact on brain structure at the regional and voxel-wise levels, beyond the global level. 15 By revealing localized effects, this approach could enhance our understanding of treatment mechanisms and contribute to the development of more targeted therapeutic strategies.
We aimed to investigate the potential benefit of CladT on regional patterns of GM volume loss in RRMS compared to placebo. In addition to GM volumes, we also examined voxel-wise GM patterns to better understand the specific course of action of CladT at the voxel level. Longitudinal clinical and MRI data from a subset of the CLARITY trial, including low dosage (3.5 mg/kg) and placebo, were analysed. We distinguished an initial period where pseudo-atrophy predominates from later stages, where a more reliable quantification of neurodegeneration is possible.
Methods
Participants
In this retrospective, longitudinal study, we used data from the CLARITY study (ClinicalTrials.gov NCT00213135), a Phase 3, double-blind, multicentre clinical trial that was conducted to determine the effect of CladT compared to placebo in RRMS. We only included participants following the low dosage (3.5 mg/kg) and placebo with available MRI data and Expanded Disease Status Scale (EDSS) score for all follow-ups (Figure 1). Participants with artefacts or without full brain coverage in one of the follow-up were excluded. Data were acquired at baseline, 24, 48 and 96 weeks (BSL, W24, W48 and W96) after treatment initiation from 2005 to 2008. Further details on the CLARITY trial have been reported previously. 16
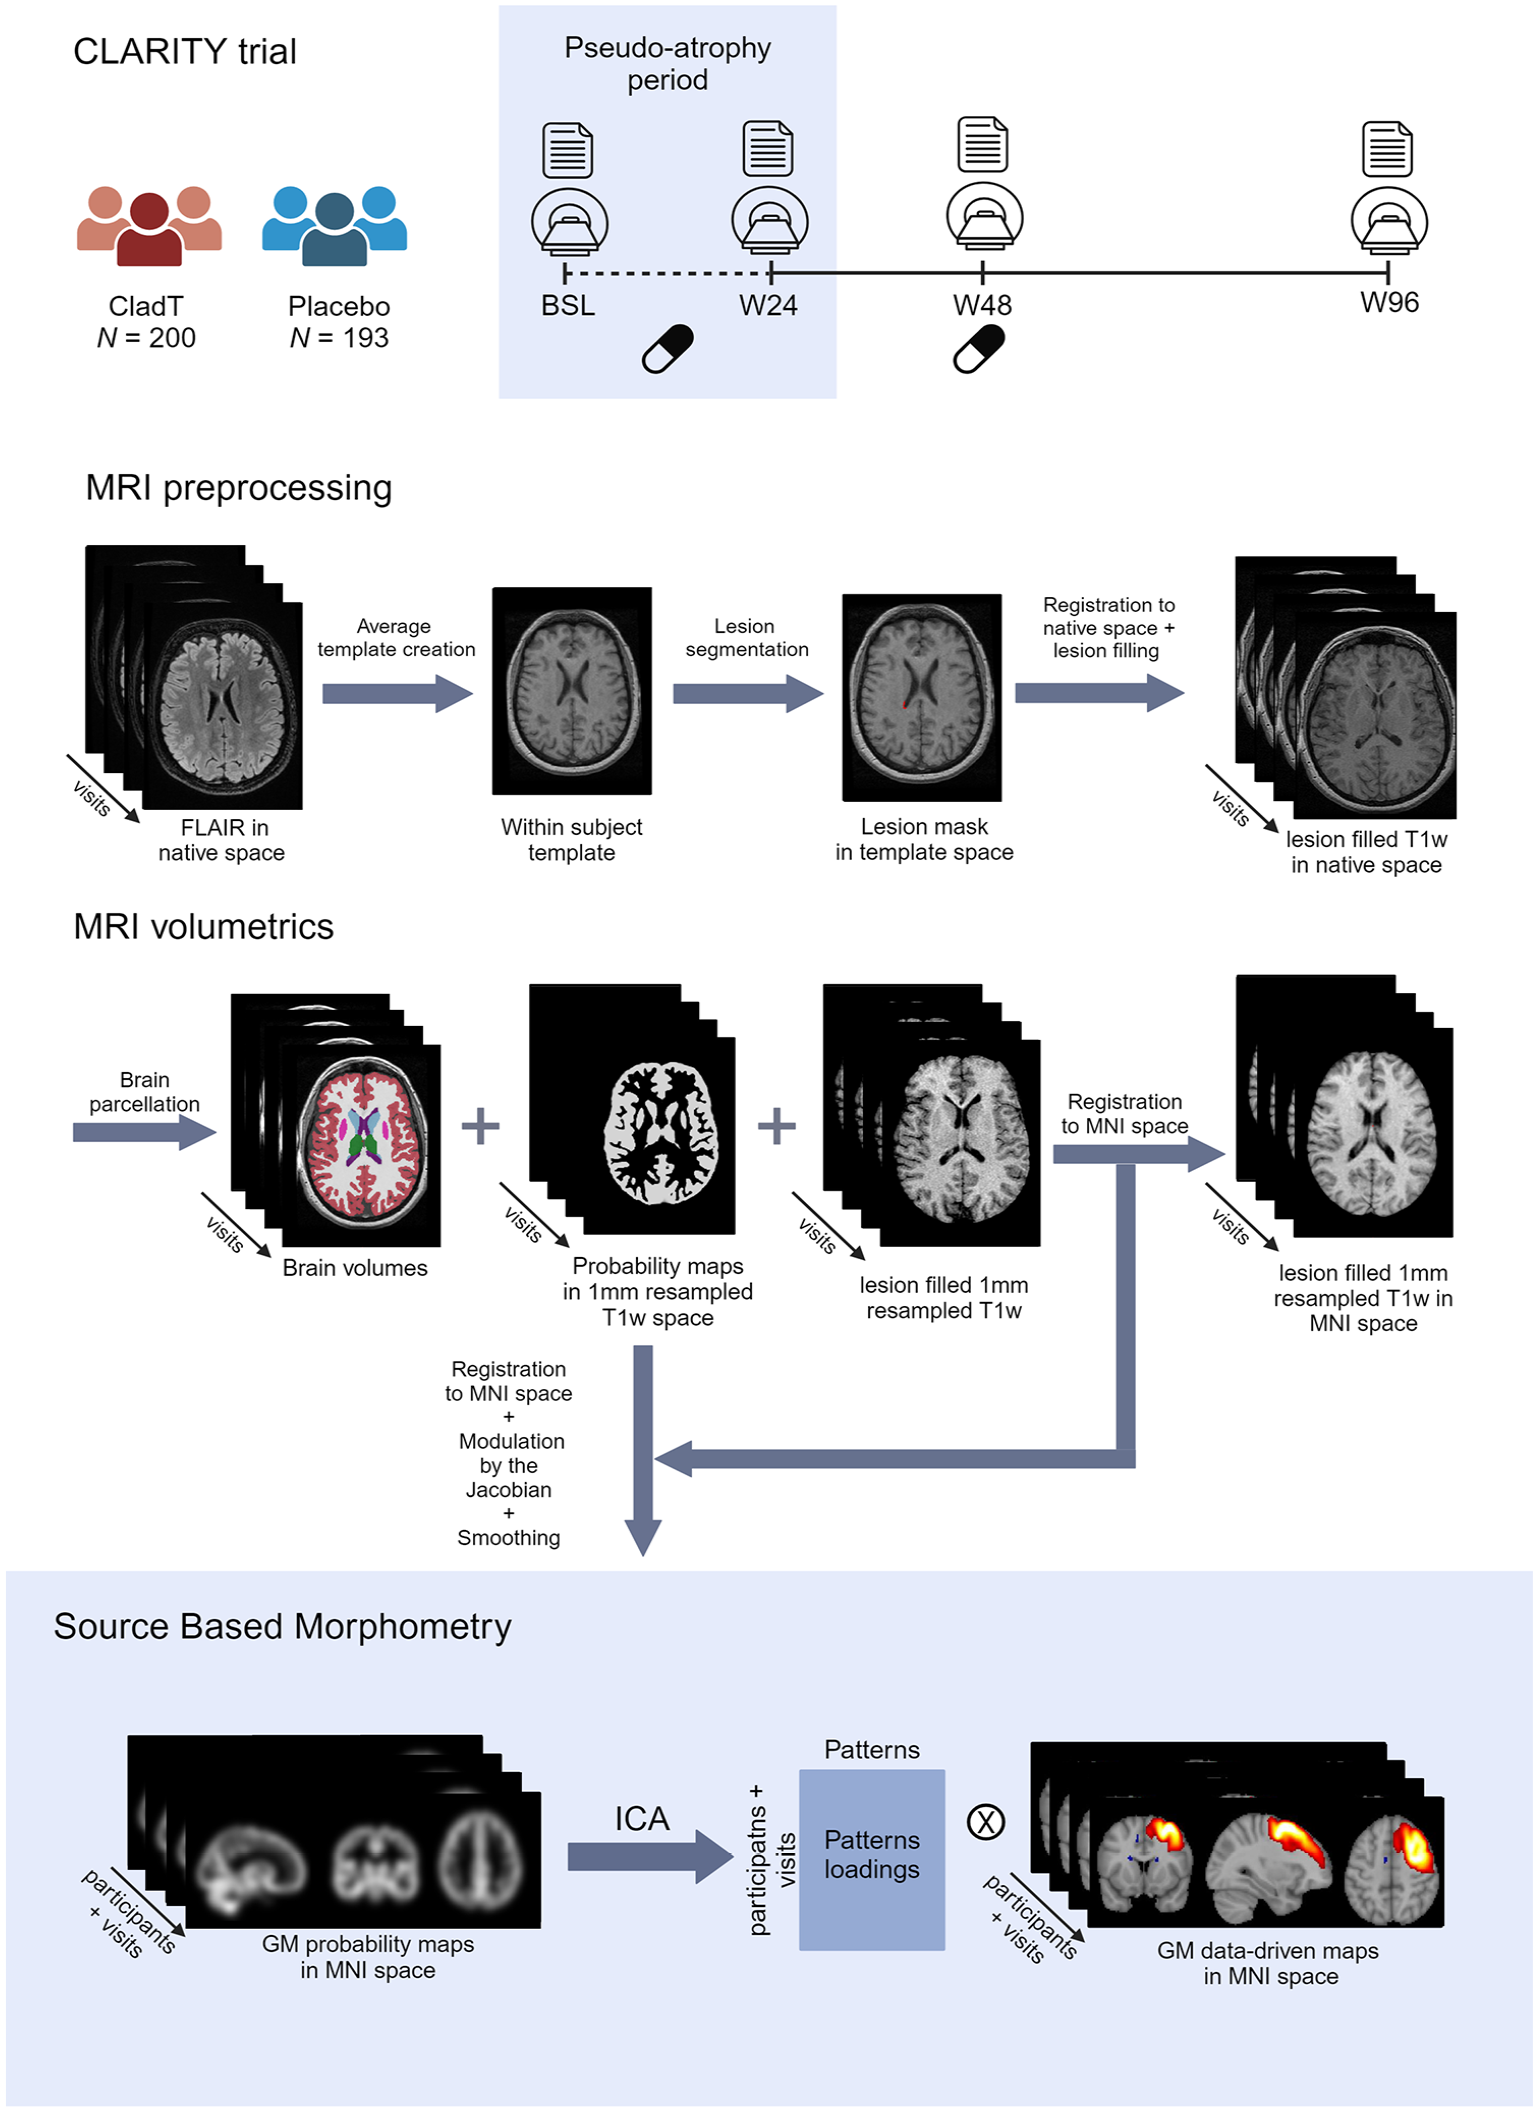
Schematic representation of the CLARITY trial and MRI analysis pipeline used for the present study.
MRI analysis
Brain scans were acquired at either 1.0 or 1.5 T on three different MRI scanners GE, Philips and Siemens. Details on MRI acquisition are provided in
Source-based morphometry
We applied source-based morphometry (SBM) to identify voxel-wise data-driven GM atrophy patterns (see Figure 1 for the full pipeline). 19 First, individual GM probability maps were constructed by combining all individual SynthSeg-derived probability maps of GM structures at each visit. Second, all registration parameters to Montreal Neurological Institute (MNI) 152 1-mm space were determined by non-linearly registering all lesion-filled 1-mm resampled T1-weighted images, after skull-stripping with HD-brain extraction tool (HD-BET), to the MNI space with Symmetric Normalization model and default parameters from Advanced Normalization Tools (ANTsv 2.4.1). 20 Third, GM probability maps were transformed to MNI space by applying these transformations, modulated by the Jacobian of the transformation and smoothed with a 6-mm Gaussian kernel. Finally, we further constrained the following GM maps by also applying the binarized MNI GM brain mask from FSL (the FMRIB Software Library). 7
The spatially normalized GM probability maps for all visits from each individual were concatenated into a 4D image. We ran an independent component analysis (ICA) using FastICA algorithm implemented in scikit-learn 1.3 (Python 3.10.9) based on the concatenated image, allowing to identify 20 independent components (also referred as GM patterns). 21 The number of components was determined based on previous studies that implemented a lower number of components5,7,15,22 and with the aim to identify potentially clinically relevant but less strong components. The loadings of these components were determined for each participant at each visit and associated with whole brain GM volume at baseline to identify patterns that represent overall brain preservation (positive correlation) or atrophy (negative correlation).
To test the stability of the identified patterns, we employed the ICASSO approach with 1000 iterations (https://github.com/teekuningas/icasso), as previously done in similar studies. ICASSO generates multiple ICA decompositions from the same data by bootstrapping, and then evaluates the consistency of the resulting components. Only those components with a stability value of at least 0.95 were considered reliable. The remaining GM patterns were visually inspected and those resembling non-physiological or noise patterns were removed.7,15,23
Volumetric measures
To compare our findings using data-driven patterns, we included volumetric measures of global (i.e. total brain and WM volume) and regional brain volumes (i.e. ventricles, cortex, deep GM, and thalamus) systematically derived from the SynthSeg (FreeSurfer v7.4.0) brain parcellation using conventional MRI. Deep GM volume was calculated by combining the volumes of the following structures: thalamus, caudate, putamen, pallidum, hippocampus, amygdala, and nucleus accumbens.
Statistical analysis
Statistical analysis was performed in RStudio 4.2.1. Normality of the variables was assessed by visual inspection of the histograms and Shapiro–Wilk tests. At baseline, t-tests were used to assess group differences (i.e. treated vs placebo) for normally distributed data and Kruskal–Wallis tests were used otherwise.
We used linear mixed-effect models to assess group differences over time during a predefined pseudo-atrophy period (up to W24) and afterward from W24 till W96, defining the pseudo-atrophy period as the first 6 months based on previous research since the effect seems to be more pronounced. 24 We built one model for each dependent variable (i.e. GM patterns, total brain, WM, cortical, thalamic, deep GM, and ventricles volumes), adjusting for age, sex, centre, disease duration, and head size, and having treatment arm, time, and interaction between treatment arm and time as independent variables. Participants were included as random effects. We applied mixed-effects models to determine the association of MRI measurements with EDSS scores, where EDSS scores were the dependent variable and MRI measurements, time and their interaction as independent variables, adjusting for age, sex, treatment group, centre, disease duration from diagnosis, and head size.
Finally, p-values were corrected for multiple comparisons using the Benjamini and Hochberg correction, also known as false discovery rate (FDR). 25 The p-values of less than 0.05 were considered statistically significant (reported p-values are corrected).
Results
Demographics and clinical variables
From the CLARITY trial, we included 583 participants with MRI data and EDSS available at all follow-ups. After an initial quality control, we excluded 185 participants with artefacts or without full-brain coverage on the available scans. Five more participants were excluded for reporting quality scores lower than 0.65 in the GM segmentation. Table 1 shows the demographic, clinical, and MRI characteristics at baseline of 393 participants included for further analysis. Only sex showed differences between arms (p = 0.044). Age, prior use of DMTs, disease duration, EDSS and MRI volumes at baseline did not differ between placebo and treatment arms. We found no differences in demographic and clinical variables at baseline between the included and excluded participants (
Demographics, clinical and MRI characteristics at baseline of the participants included after processing.
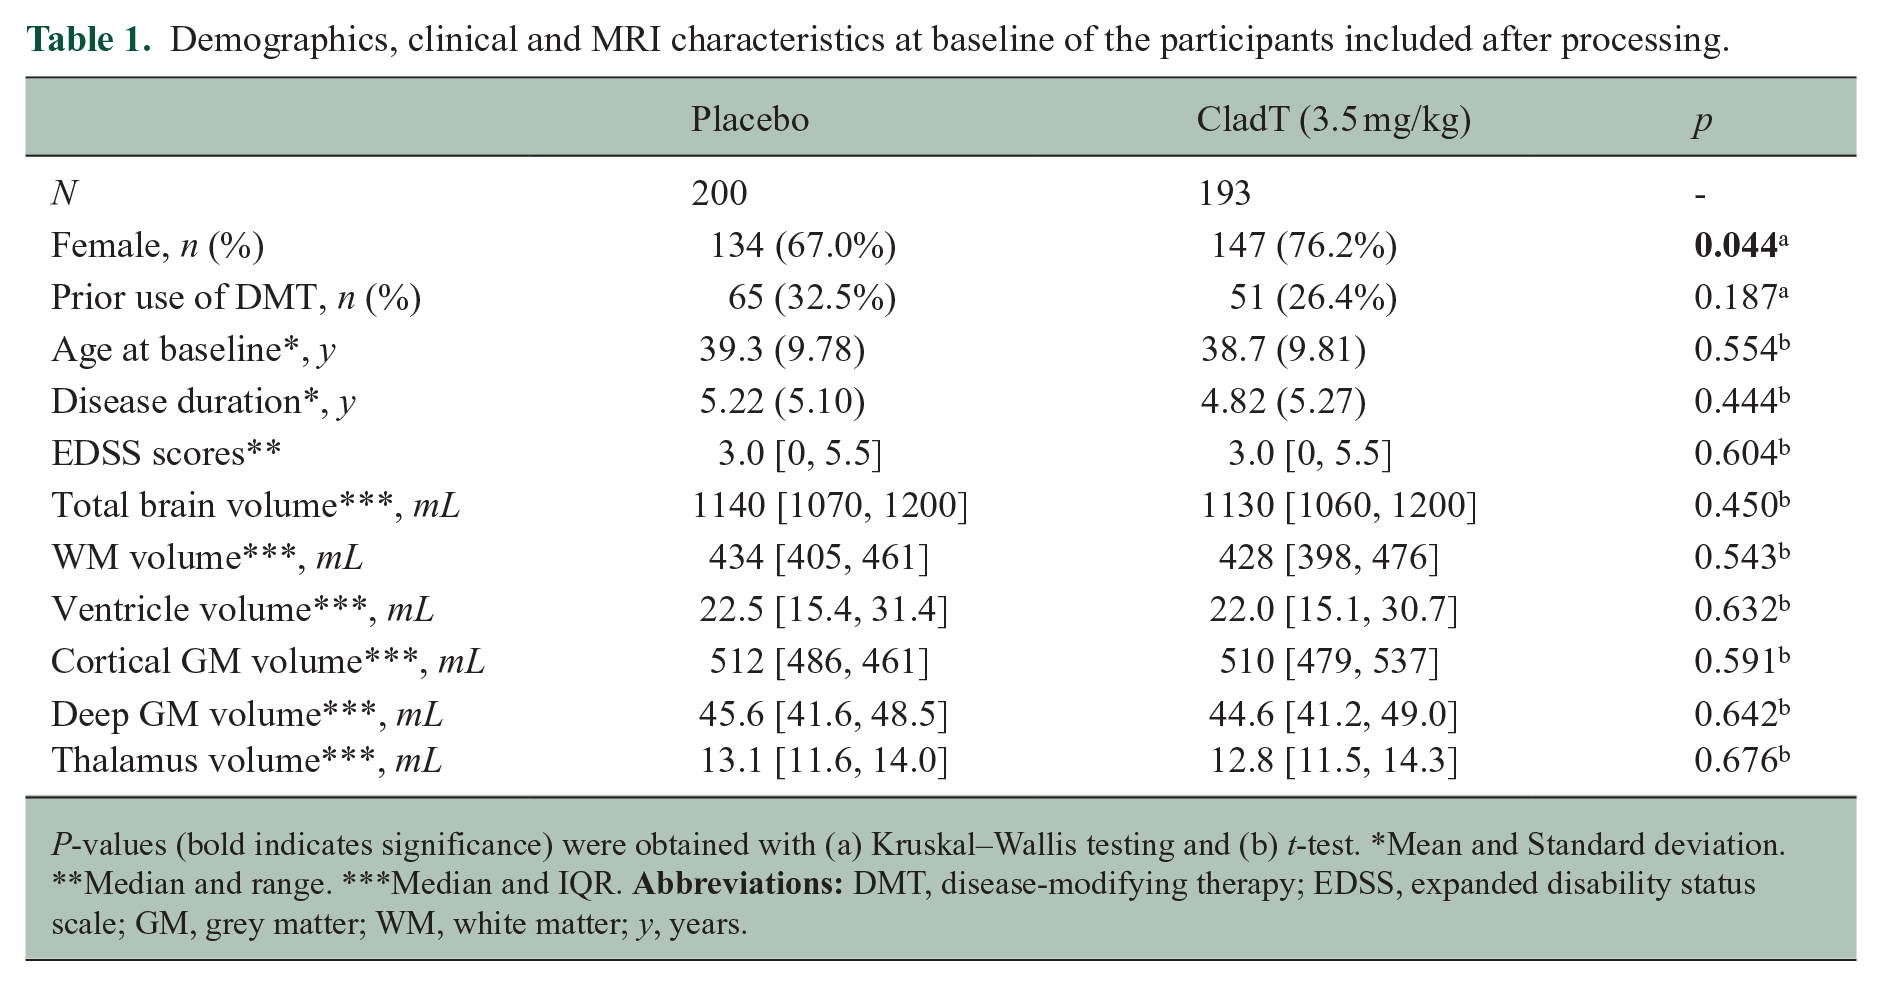
P-values (bold indicates significance) were obtained with (a) Kruskal–Wallis testing and (b) t-test. *Mean and Standard deviation. **Median and range. ***Median and IQR.
Data-driven GM atrophy patterns
After a visual inspection, 12 out of 20 identified stable patterns resembled literature-based networks
15
(Figure 2) and were considered for further analysis, whereas the remaining 8 patterns were excluded based on earlier descriptions of common patterns of noise or non-physiological characteristics (
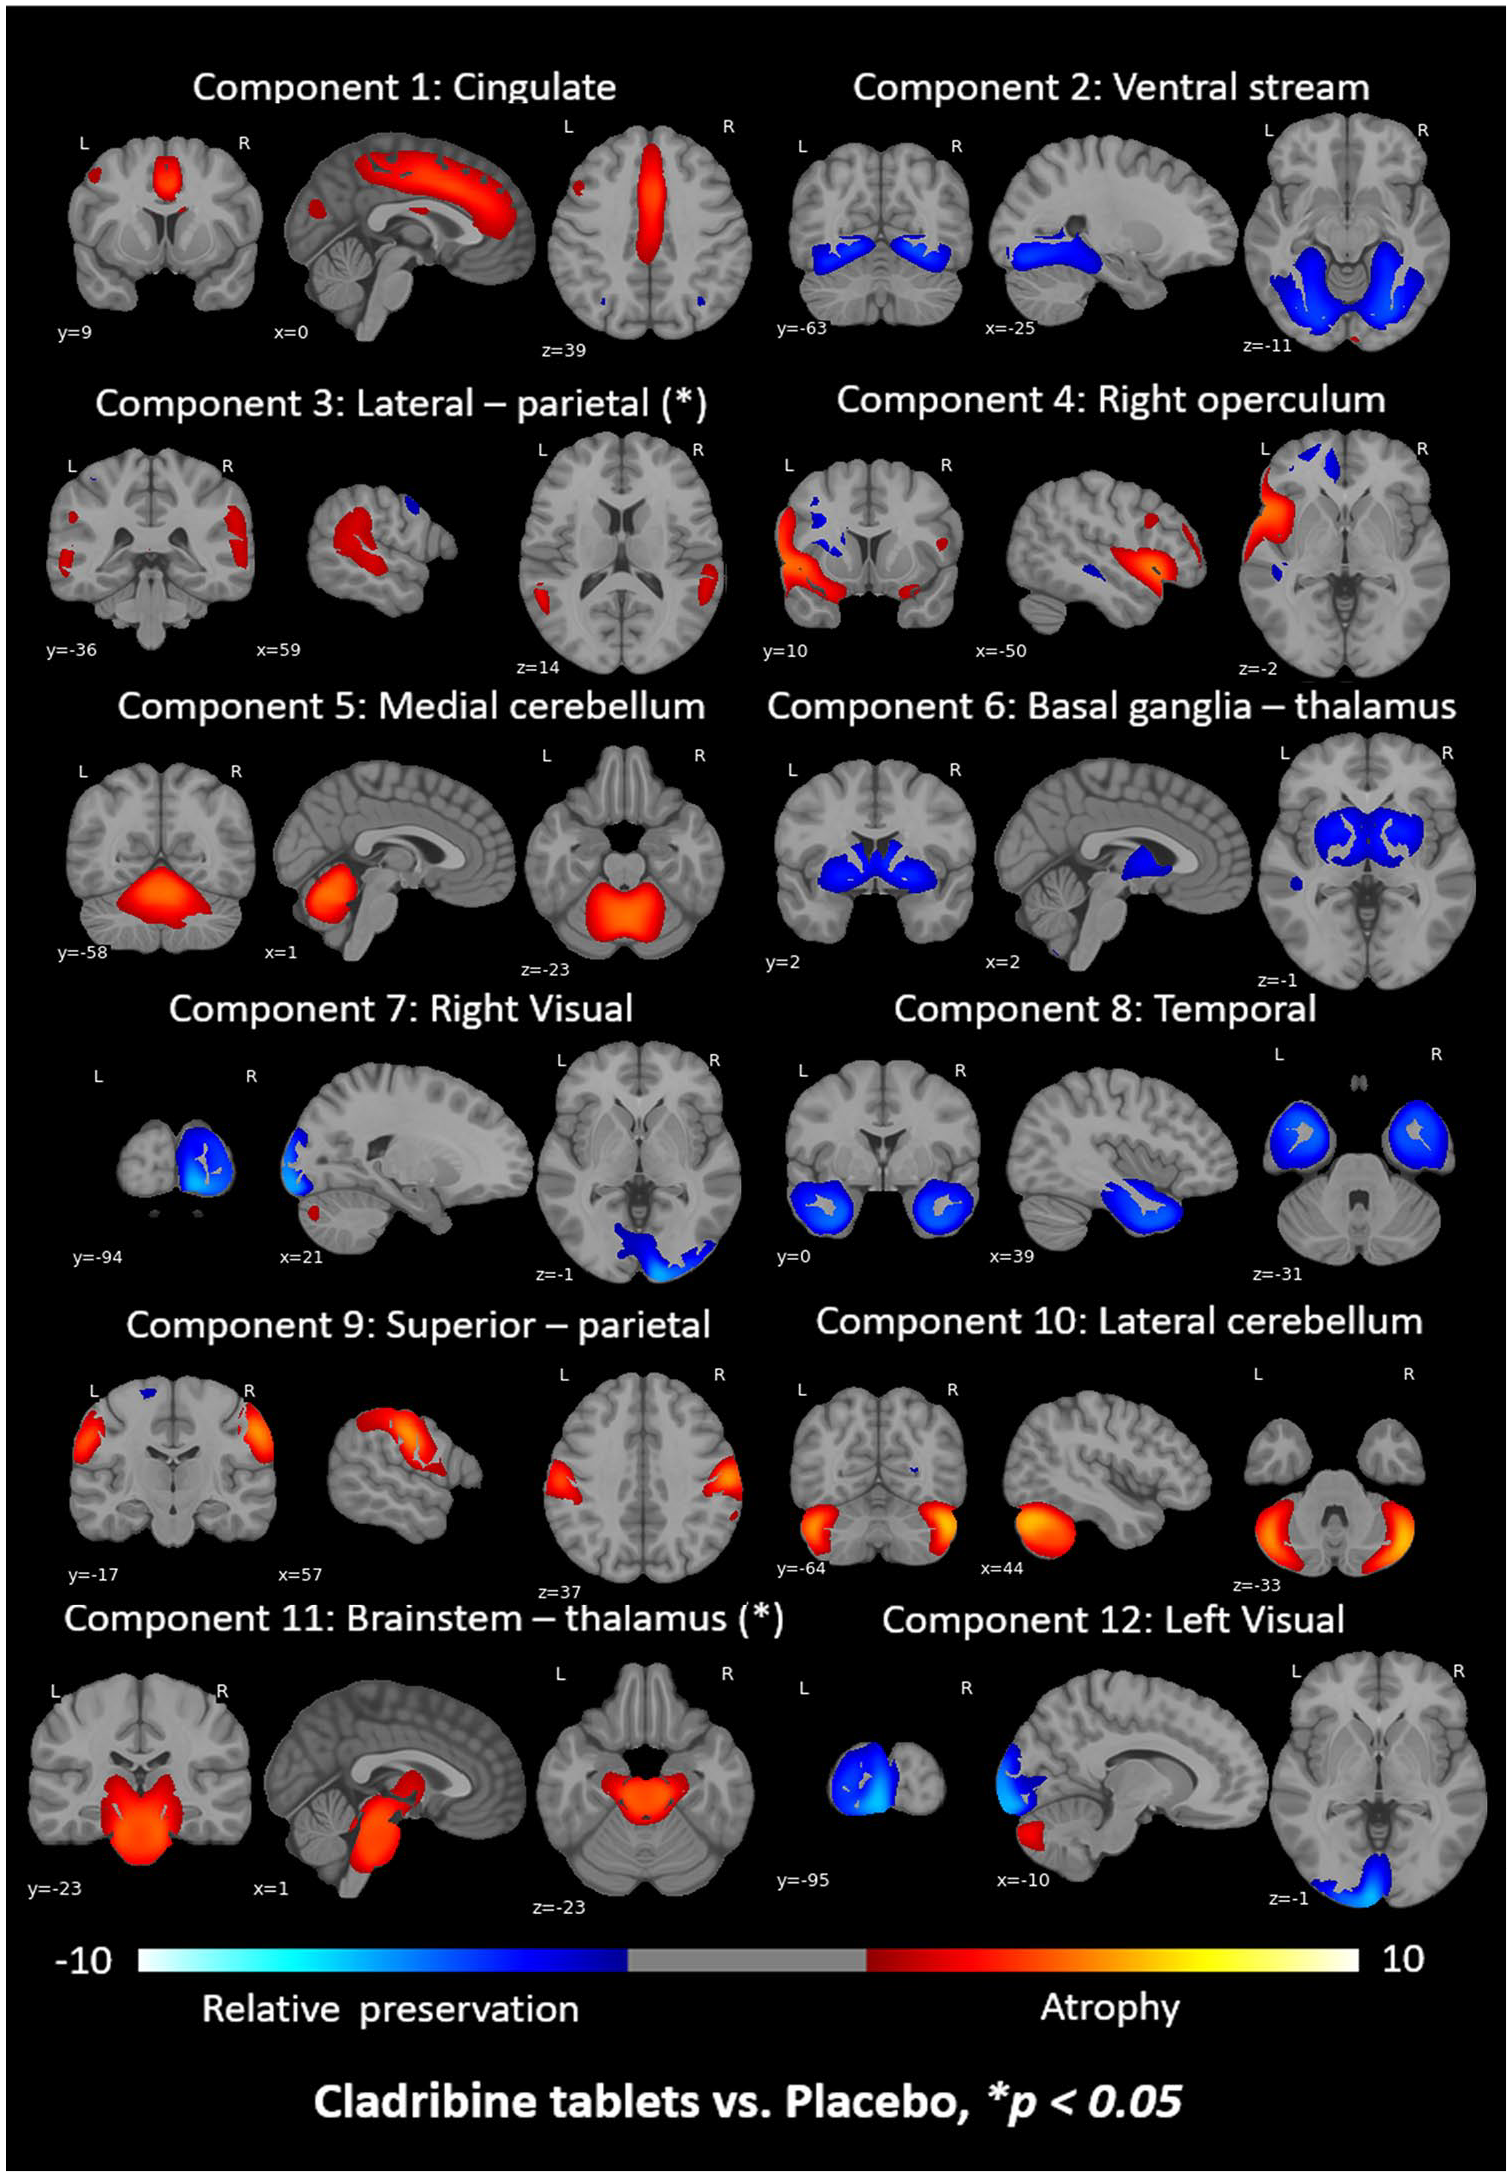
ICA components identified after performing the SBM analysis and visually inspecting them. The colour bar indicates the component loading: blue for preservation (positive correlations) and red for atrophy (negative correlations) with whole-brain GM volume at baseline. (*) indicates those components that showed significant differences between treated and placebo groups over time when performing mixed-effect models.
Differences between groups at baseline
At baseline, MRI volumes of the selected structures (total brain, WM, ventricles, cortex, deep GM and thalamus) did not statistically differ between the treated and placebo arms. Detailed information, including median, range and p-values obtained with t-tests is presented in Table 1. Among the investigated MRI measures, Component 2 (ventral stream) showed a lower mean loading in the placebo compared to treatment group at baseline (p < 0.05).
Longitudinal progression of conventional MRI volumes: between-group analysis
During the pseudo-atrophy period, total brain (β = 0.07, p < 0.05, Figure 3), WM (β = 0.05, p < 0.05) and cortical (β = 0.08, p < 0.05) volumes decreased more in the treatment arm compared with placebo. No other regions showed differences between groups over time during the pseudo-atrophy period (
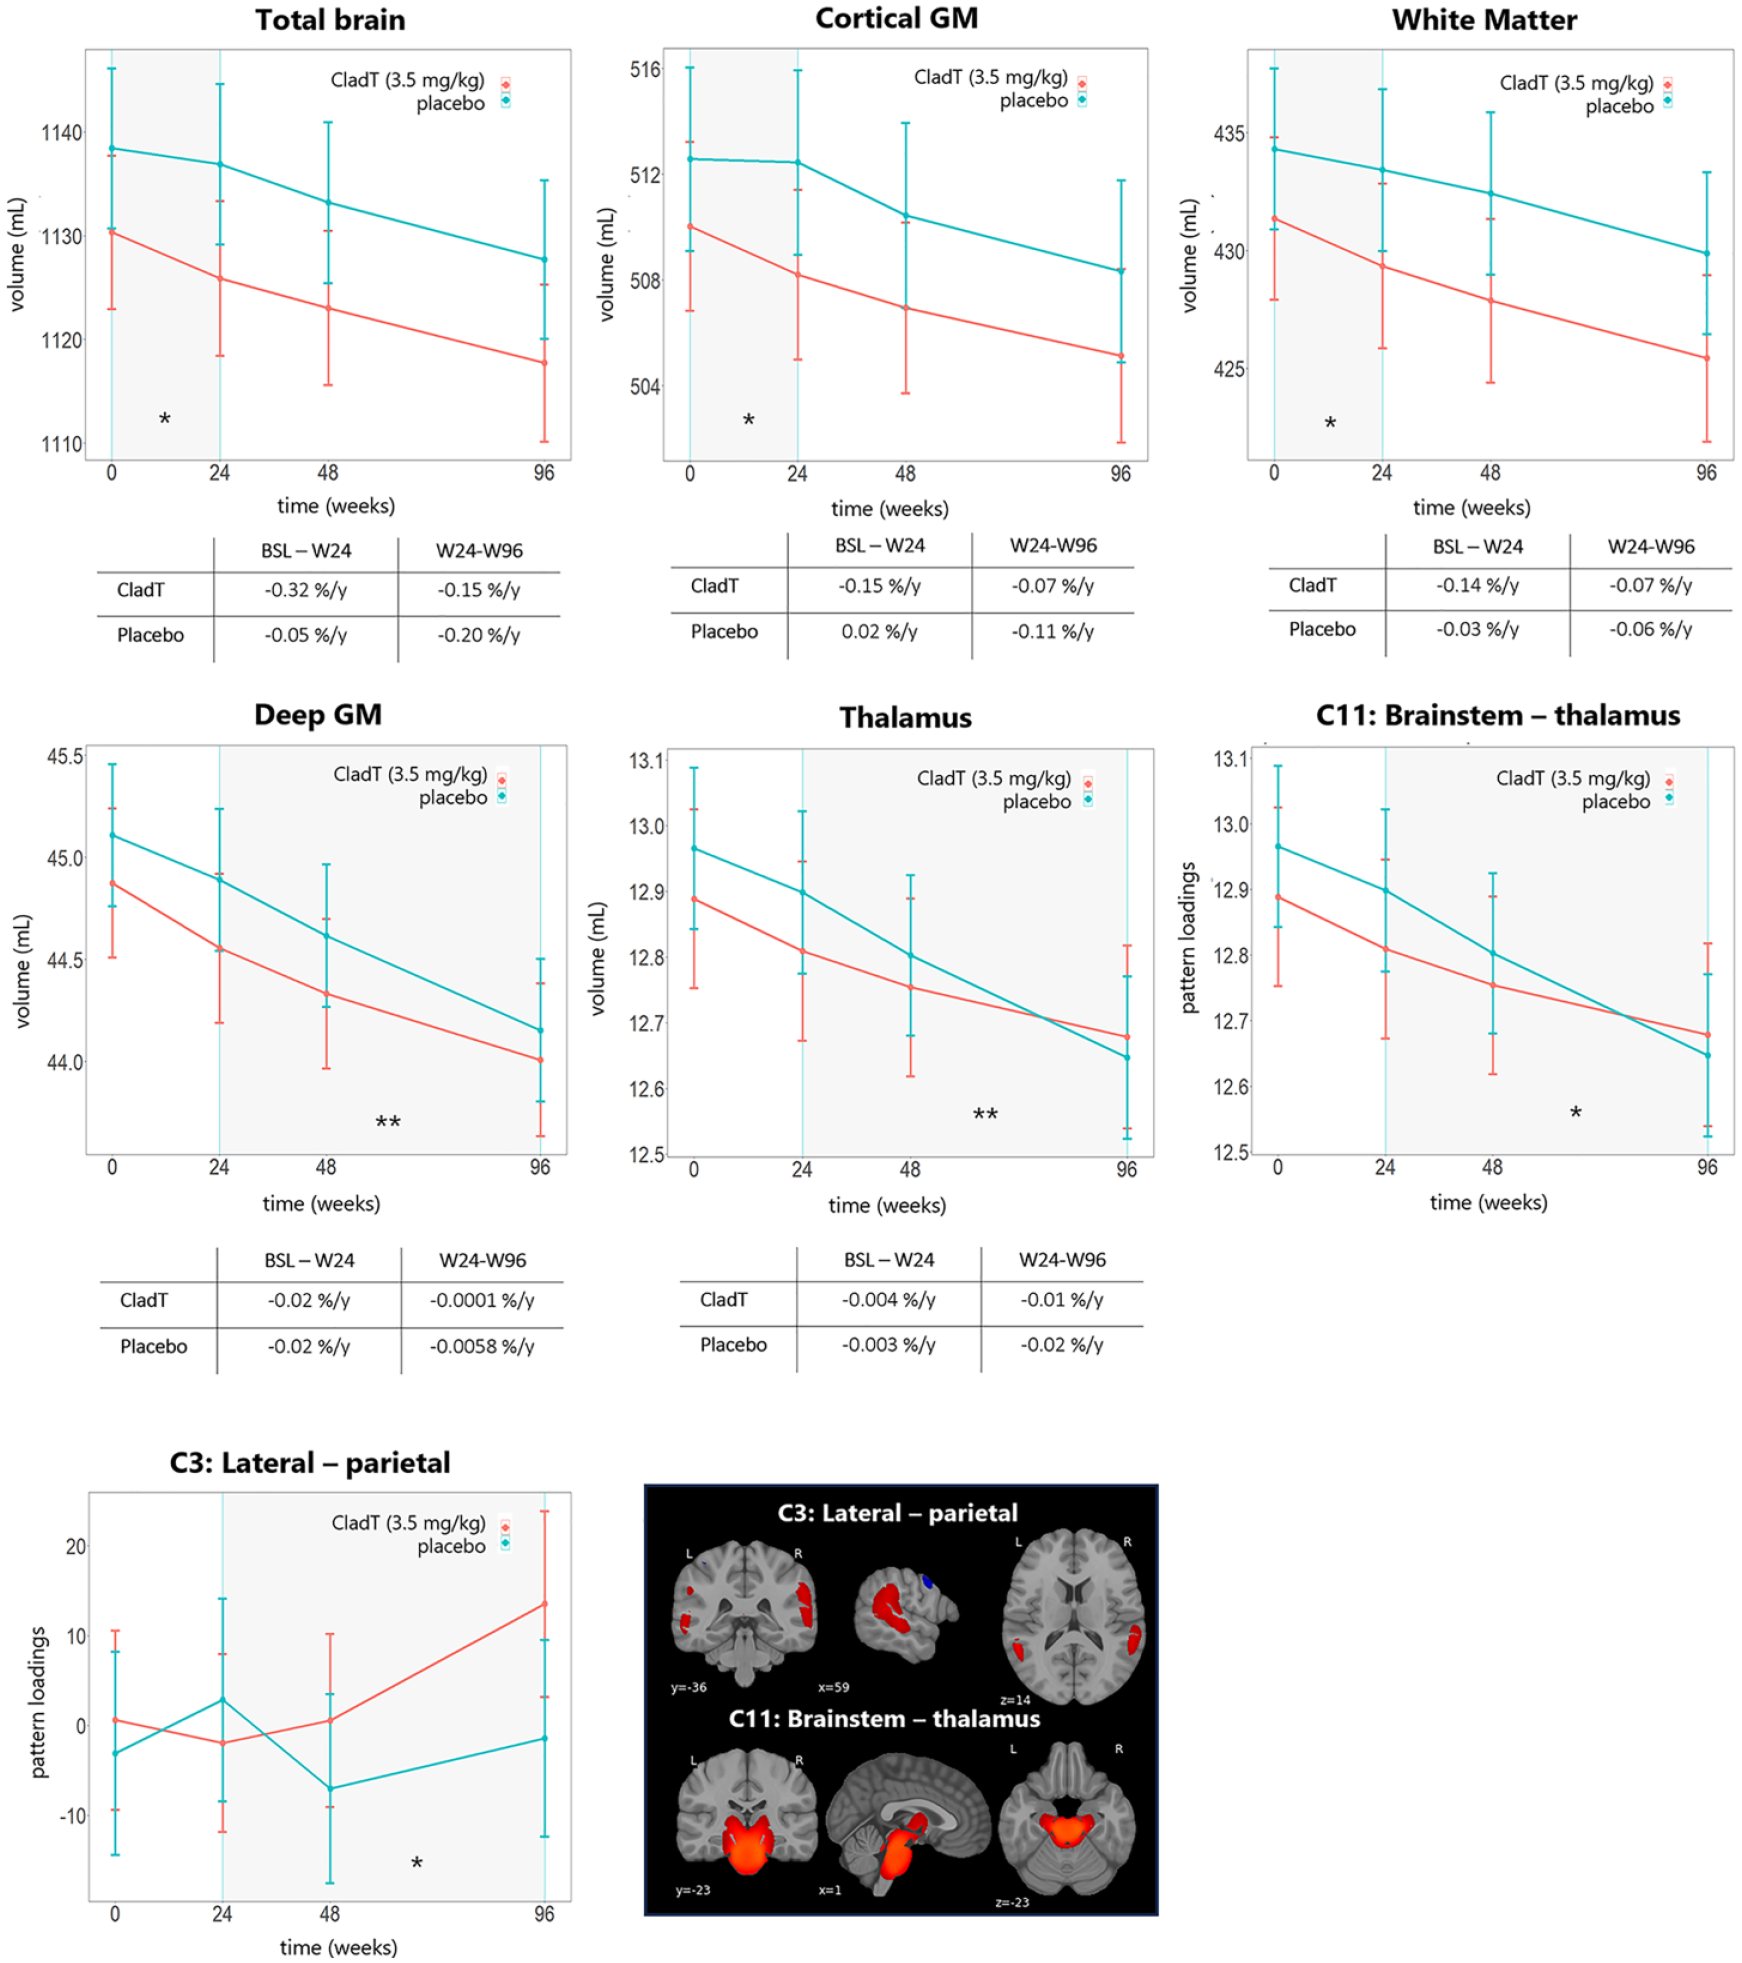
MRI measures progression that showed differences between group. The mean and the standard error of the mean are represented for each visit.* p < 0.05, ** p < 0.01.
Between W24 and W96, total brain, WM and cortical volume declined over time, but did not show differences between treatment groups. In the placebo arm, the volume of deep GM (β = −0.03, p < 0.01, Figure 3) and thalamus (β = −0.04, p < 0.01, Figure 3) declined more rapidly compared with the treatment arm. However, ventricle volume (β = 0.01, p = 0.051) did not change after correcting for multiple comparison (
Longitudinal progression of data-driven atrophy patterns: between-group analysis
None of the ICA components showed differences between treated and placebo groups over time during the pseudo-atrophy period (
Association between EDSS and MRI measures
We assessed the associations between EDSS and MRI measures, including only the measurements that showed statistically significant differences over time between treatment groups. Thus, total brain, WM, cortical, deep GM, thalamic volume and two ICA components (Component 3: lateral–parietal, and Component 11: brainstem–thalamus) were included for this analysis.
During the pseudo-atrophy period, we found no associations for total brain, WM or cortical volumes with EDSS scores (
Discussion
This study investigated the neuroprotective effect of CladT in RRMS compared to placebo, using data-driven patterns of regional GM atrophy by analysing longitudinal MRI and clinical data from the CLARITY trial. Results showed a treatment effect for deep GM and thalamic volume, with more severe atrophy in the placebo group. However, between W24 and W96, total brain, WM and cortical GM volumes do not appear significantly different between treatment groups. Regarding atrophy patterns, a treatment effect was found for brainstem–thalamus and lateral–parietal areas. Volumetric changes of thalamus, deep GM and Component 11 (brainstem–thalamus) were clinically relevant.
Between W24 and W96, Component 11 (brainstem–thalamus) and deep GM and thalamic volume showed a significant treatment effect and relations with EDSS, with worse atrophy in the placebo compared to the treatment group. This finding describing the relevance of especially GM measures was also seen in an earlier analysis of the same dataset, 13 on which we now add regional GM information. The specific effects for these particular areas are not unexpected, as a very large body of work implies the importance of the deep GM in MS. 26 Thalamic volume especially has gained extensive attention in recent periods, showing a predominant severity of atrophy mainly related to WM pathology. 6 Future research is therefore needed to see whether the neuroprotective effects are mediated by WM pathology in thalamic tracts. Such effects were also seen for other DMTs that is a reduction in thalamic volume loss in patients treated with ocrelizumab and fingolimod compared to placebo.27,28 Of all regional structures, the thalamus has shown the most consistent effects of DMT and a strong correlation with overall clinical functioning. This could be explained by the thalamic involvement in a very large number of neuronal processes due to the extensive nature of thalamic connections, impacting motor and cognitive behaviour. 29
In addition to deep GM effects, a treatment effect was also identified for Component 3 (lateral–parietal), which did not show an association with EDSS. This could be explained by their relation to larger network topology, as the regions are known to be involved in the default mode network. 30 This network is crucial to cognitive processing and known to be highly dysfunctional in MS, especially in cognitively impaired (progressive) patient groups. 31 This could indicate a cognitively relevant neuroprotective effect. Unfortunately, cognitive information was not available in the current dataset, although previous work has shown other DMTs to impact cognition and more recent studies of CladT (MAGNIFY, CLARIFY) have reported a positive impact on cognition (as measured by Symbol Digit Modalities Test or Brief International Cognitive Assessment for MS) and additional analysis on MRI from these studies could further explore this association.32–34 In addition, these areas were only identified because of the use of the SBM approach, highlighting the added value of regional measures. SBM also identified deep GM areas as relevant, which confirmed findings from aforementioned more conventional volumetric methods. This finding therefore indicates that applying advanced methods such as SBM could yield additional information, while also including results that would have been provided by more conventional pipelines.5,7,15
This study specifically separated the first 6 months as a ‘pseudo-atrophy’ period, as previous work has indicated this period to feature the acute resolution of inflammation after the initiation of DMT. 35 Throughout the pseudo-atrophy period, there was a notable decline in total brain, WM and cortical volumes within the treatment arm, exhibiting a more pronounced reduction compared to the placebo group. Pseudo-atrophy-related changes showed no relations with disability, while volumetric changes after this period did. This global effect of pseudo-atrophy was expected, and also seen in the previous analysis of the same trial data. 16 These findings also indicate that regional effects driven by pseudo- and actual atrophy are not situated in the same regions, highlighting the possibility of selecting MRI biomarkers most likely to relate to either phenomenon, which could improve statistical power of future trials.5,15
One of the primary limitations of our study is linked to the suboptimal quality of the MRI data. Due to low-resolution, limited GM/WM contrast and suboptimal field of view, a substantial number of scans had to be excluded for our regional GM analysis. It is important to highlight that the number of excluded scans was consistent between groups, thereby mitigating any potential bias between the treated and placebo groups. Moreover, the lack of healthy controls made impossible to evaluate whether the GM atrophy patterns obtained differ from those observed in a healthy population. As earlier mentioned, the clinical evaluation was limited to EDSS scores, while future trials would benefit from more extensive assessments including cognition and the inclusion of healthy population. Finally, this study only focused on GM volumetric measures, while more advanced ways of quantifying WM damage patterns might result in additional information.
Conclusion
The findings of this study suggest that administration of CladT (3.5 mg/kg) as a treatment for RRMS is associated with a reduction in GM neurodegeneration, particularly in clinically relevant areas, such as the deep GM, thalamus and brainstem. This underlines the importance of incorporating regional MRI measures to evaluate the neuroprotective effect of treatment options.
Supplemental Material
sj-docx-1-msj-10.1177_13524585251314779 – Supplemental material for Treatment effects of cladribine tablets on data-driven patterns of regional grey matter atrophy in multiple sclerosis
Supplemental material, sj-docx-1-msj-10.1177_13524585251314779 for Treatment effects of cladribine tablets on data-driven patterns of regional grey matter atrophy in multiple sclerosis by Mar Barrantes-Cepas, Samantha Noteboom, Elisa Colato, Marco Battaglini, Maria Pia Sormani, Nicola De Stefano, Martijn D Steenwijk, Ismail Koubiyr and Menno M Schoonheim in Multiple Sclerosis Journal
Footnotes
Data Availability Statement
Data of this study are available on reasonable request from a qualified researcher.
Declaration of Conflicting Interests
M.B.C. is supported by research grants from Merck and Atara Biotherapeutics.
S.N. is supported by research grants from Merck, Atara Biotherapeutics and Biogen.
E.C. is supported by EIP.
M.B. reports no conflict of interest.
M.P.S. received consulting fees from Biogen, Merck, Novartis, Roche, Sanofi, Immunic and Alexion.
N.D.S. is a consultat for Biogen, Merck, Novartis, Sanofi-Genzyme, Roche and Teva; has grants or grants pending from FISM and Novartis, is on the speakers’ bureaus of Biogen, Merck, Novartis, Roche, Sanofi-Genzyme, and Teva; and has received travel funds from Merck, Novartis, Roche, Sanofi-Genzyme, and Teva.
M.D.S. is supported by research grants from Merck, Atara Biotherapeutics and Biogen.
I.K. received research grants from LabEx TRAIL (Translational Research and Advanced Imaging Laboratory) and ARSEP (Foundation pour l’Aide à la Recherche sur la Sclérose En Plaques) and speakers’ honoraria from Celgene.
M.M.S. serves on the editorial board of Neurology, Multiple Sclerosis Journal, and Frontiers in Neurology, receives research support from the Dutch MS Research Foundation, Eurostars-EUREKA, ARSEP, Amsterdam Neuroscience, MAGNIMS and ZonMW (VIDI grant, project number 09150172010056) and has served as a consultant for or received research support from Atara Biotherapeutics, Biogen, Celgene/Bristol Meyes Squibb, EIP, Sanofi, MedDay and Merck.
Funding
The author(s) disclosed receipt of the following financial support for the research, authorship, and/or publication of this article: This study was supported by a research grant from Merck (CrossRef Funder ID: 10.13039/100009945). Merck (CrossRef Funder ID: 10.13039/100009945) reviewed this manuscript for medical accuracy only before journal submission. The authors are fully responsible for the content of this manuscript, and the views and opinions described in the publication reflect solely those of the authors.
ORCID iDs
Supplemental Material
Supplemental material for this article is available online.
References
Supplementary Material
Please find the following supplemental material available below.
For Open Access articles published under a Creative Commons License, all supplemental material carries the same license as the article it is associated with.
For non-Open Access articles published, all supplemental material carries a non-exclusive license, and permission requests for re-use of supplemental material or any part of supplemental material shall be sent directly to the copyright owner as specified in the copyright notice associated with the article.