
Abstract
Introduction:
Multiple sclerosis (MS) is a leading cause of disability among young adults, but standard clinical scales may not accurately detect subtle changes in disability occurring between visits. This study aims to explore whether wearable device data provides more granular and objective measures of disability progression in MS.
Methods:
Remote Assessment of Disease and Relapse in Central Nervous System Disorders (RADAR-CNS) is a longitudinal multicenter observational study in which 400 MS patients have been recruited since June 2018 and prospectively followed up for 24 months. Monitoring of patients included standard clinical visits with assessment of disability through use of the Expanded Disability Status Scale (EDSS), 6-minute walking test (6MWT) and timed 25-foot walk (T25FW), as well as remote monitoring through the use of a Fitbit.
Results:
Among the 306 patients who completed the study (mean age, 45.6 years; females 67%), confirmed disability progression defined by the EDSS was observed in 74 patients, who had approximately 1392 fewer daily steps than patients without disability progression. However, the decrease in the number of steps experienced over time by patients with EDSS progression and stable patients was not significantly different. Similar results were obtained with disability progression defined by the 6MWT and the T25FW.
Conclusion:
The use of continuous activity monitoring holds great promise as a sensitive and ecologically valid measure of disability progression in MS.
Introduction
Multiple sclerosis (MS) is a chronic autoimmune disorder that affects the central nervous system and can cause a range of symptoms, including muscle weakness, difficulty with coordination and balance, and vision problems. 1 Disability progression refers to the worsening of symptoms and functional impairments over time in individuals with MS. There are several standard definitions of disability progression in MS that are commonly used in research studies and clinical practice and that are based on clinical scales, including Expanded Disability Status Scale (EDSS), Multiple Sclerosis Functional Composite (MSFC), Multiple Sclerosis Impact Scale (MSIS-29) and Multiple Sclerosis Severity Score (MSSS).2–5 However, these scales capture a snapshot of an individual’s functional abilities at a particular point in time, and they may not accurately detect subtle changes in disability that occur between visits.
In recent years, there has been growing interest in the use of wearable devices to monitor and track the health and functional status of individuals with MS.6–8 Wearable devices, such as smartwatches and fitness trackers, are equipped with sensors that can measure a range of physiological and behavioural parameters, including physical activity, sleep and heart rate. These devices have the potential to provide valuable insights into the daily lives and functional status of individuals with MS and could potentially be used to monitor and track disability progression.
This study aims to explore whether wearable device data can provide a more granular and objective measure of disability progression in MS, and whether it can complement or improve upon current methods of disability assessment.
Methods
Remote Assessment of Disease and Relapse in Central Nervous System Disorders (RADAR-CNS) is a major international research project that aims to develop new ways of measuring major depressive disorder, epilepsy and MS using wearable devices and smartphone technology. 9 Within RADAR-CNS, the Multiple Sclerosis disability and fatigue study (RADAR-MS) is an observational non-randomized, non-interventional study, using commercially available wearable technology and smartphone sensors, which aims to evaluate whether multi-parametric remote monitoring technologies (RMT) represent a reliable and feasible instrument to better characterize the disability status of patients with a definite diagnosis of MS. The study began its recruitment phase in June 2018 and involved MS patients from three participating centres located in Milan (Italy), Barcelona (Spain) and Copenhagen (Denmark). Among the passive strategies employed was the use of the Fitbit Charge 3. This wearable device was worn on the dominant hand and patients were recommended to wear it as extensively as possible throughout the day. For durability reasons and to ensure the device’s longevity, patients were advised to remove the Fitbit when it might come into contact with water. In addition, the RADAR-CNS passive app on mobile phones was utilized to gather phone sensor data. Active strategies encompassed the administration of questionnaires through a dedicated mobile phone app – the RADAR-CNS questionnaire – as well as cognitive and physical tests. This gathered data was subsequently compared with clinical data collected at regular visits every 3 months. Each participant was monitored for a minimum span of 24 months following their signing of the informed consent form (Figure 1). Patients included in the study should be older than 18 years, have a diagnosis of MS according to 2010 revisions to the McDonald criteria, a relapsing-remitting (n = 300) or secondary progressive (n = 100) MS phenotypes, have an EDSS from 2.0 to 6.0, have the ability to give informed consent for participation, willingness and ability to complete self-reported assessments via smartphone, and have existing ownership of Android smartphone. Patients unable to comply with study procedures in the opinion of the investigator, including the presence of any condition (physical, mental or social) that is likely to affect the subject’s ability to comply with the protocol or female pregnant subjects, were excluded from the study.
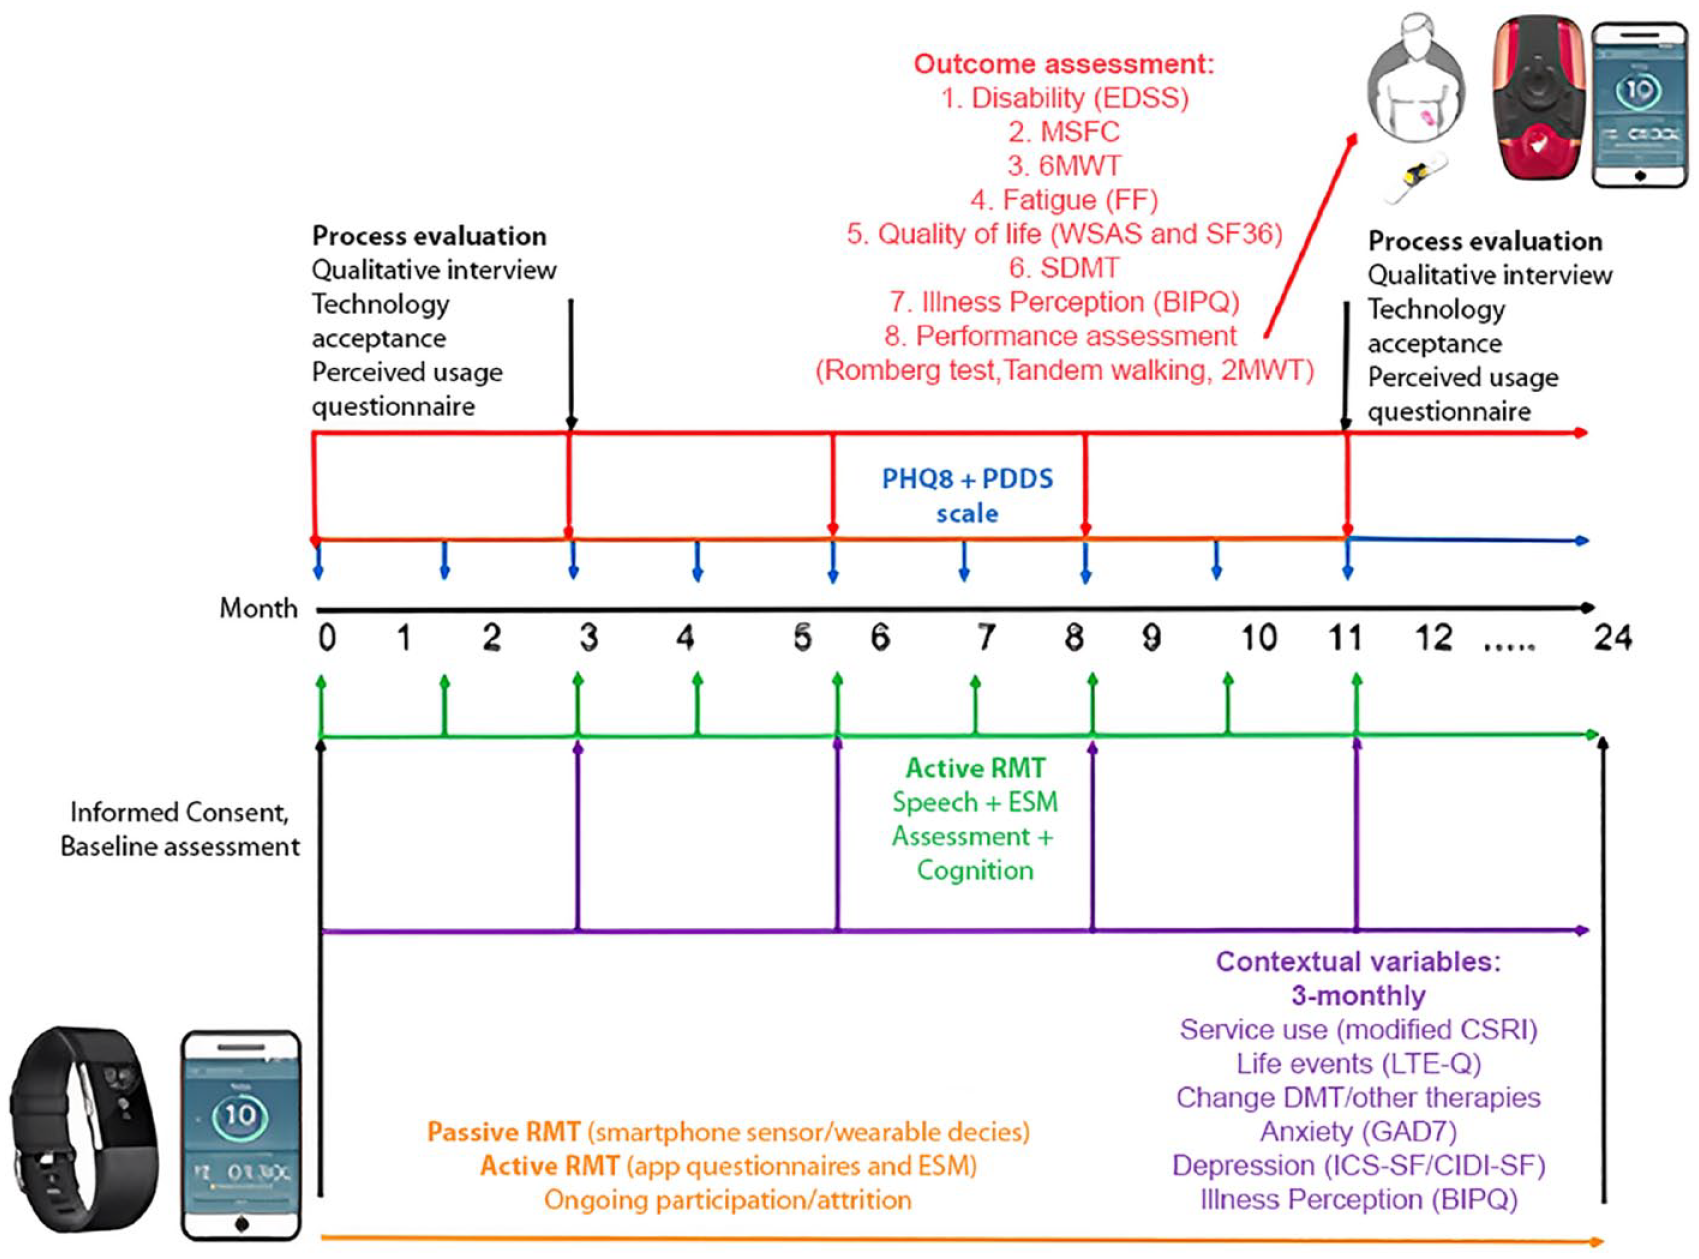
RADAR-CNS disability and fatigue study design.
Standard protocol approvals, registrations and patient consents
Approval of the protocol was obtained from the Ethical Committee of the Milan and Barcelona centres and is approved by the Danish Data Protection Agency. (The Danish National Research Ethics Committee has declared that performance of studies such as the present does not require assessment by ethic committees or patient consent as it does not involve biological material or study-related therapeutic intervention.) Informed and signed consent was obtained from all patients.
Outcome definitions
Clinical measures included EDSS, 6-minute walking test (6MWT) and the timed 25-foot walk (T25FW) test. An increase of 1 point of EDSS score in patients with a baseline score <5.5 or of 0.5 points if entry score was ⩾5.5, confirmed at 6 months, was considered a confirmed disability progression. Worsening of 6MWT and T25FW by ⩾20% of the baseline values at two consecutive evaluations were considered a significant deterioration of walking abilities.10–13
Contextual variables
Contextual variables considered in the study were age, sex, ongoing disease-modifying drugs (DMDs) (defined as either ongoing or not ongoing during the study), disease duration (defined as the number of months between the onset of the first symptoms of the disease and the enrolment in the study), type of MS (defined as relapsing-remitting vs secondary progressive), clinical (defined as the occurrence of new neurological symptoms lasting at least 24 hours and not attributable to concurrent infections or other diseases) 14 and magnetic resonance imaging (MRI) activity (defined as the occurrence of new T2 or Gadolinium-enhancing lesions at MRI 15 performed by clinical practice while the patients was enrolled, with reference to the latest MRI before enrolment in the study occurred).
Statistical analysis
Differences between groups of normally and non-normally distributed variables were analysed with t tests and Mann–Whitney U tests, respectively. Analysis of categorical variables was performed using chi-square tests. To examine the effect of group (disability worsened or not) and time on the number of daily steps recorded by the wearable device (Fitbit) in individuals with MS, a mixed-effects model was fit using the lme4 package in R. The number of daily steps was included as the outcome variable, and the group and the interaction between time and group were included as predictor variables. The analysis has been adjusted for age, gender, disease duration, ongoing DMD and type of MS. Patient-level random intercepts and slopes for the number of daily steps were included to account for the fact that each patient has their own baseline level of steps and their own rate of change over time.
To prepare the data for analysis, the daily number of steps data was first plotted over time to identify any potential outliers or missing data. The change in EDSS, 6MWT and T25FT scores over time for each patient was also calculated, and patients were classified as having ‘worsened’ or ‘not worsened’ based on predetermined thresholds for each measure as described earlier.
To account for different walking patterns on weekdays and weekends, a rolling mean with a window of 7 days was applied to the number of daily steps data. The rolling mean was calculated by sliding the 7-day time period forward by 1 day at a time and calculating the mean of the data within each time period. This helped to smooth out short-term fluctuations in the data and reveal underlying trends or patterns. Days with no heart-beat recordings from the Fitbit were excluded from the analysis.
The coefficients and corresponding p-values for the group, time and the interaction between time and group were examined to determine the effect of these predictor variables on the number of daily steps. The fit of the mixed-effects model was evaluated using various goodness-of-fit measures, including the Akaike information criterion (AIC) and the Bayesian information criterion (BIC). Model diagnostics were also performed to ensure that the assumptions of the model were met. To further explore the characteristics of patients who were stable as defined by standard clinical tests but who worsened in terms of daily number of steps recorded by the wearable device, a cluster analysis was performed on the slopes of the number of daily steps data. Specifically, the cluster analysis was used to identify subgroups of patients who were stable according to both the clinical tests and the daily number of steps data (i.e. had relatively flat slopes) and those who were stable according to the clinical tests but not according to the daily number of steps data (i.e. had negative or positive slopes). The results of the cluster analysis were used to further understand the relationship between the clinical measures of disability and the daily number of steps data in different subgroups of patients. A two-sided p-value of 0.05 was considered statistically significant. All statistical analyses were performed using the computing environment R. 16
Results
Baseline characteristics of the cohort
A total of 400 patients have been enrolled in the MS disability and fatigue study of RADAR-CNS. Baseline characteristics of the study cohort are presented in Table 1. Briefly, of the 400 individuals with MS who were enrolled in the study, 67% were female and 33% were male. The mean age of the study population was 45.6 years (standard deviation (SD) = 10.3), and the mean disease duration was 192.4 months (SD = 109.6). At all 76.8% of the study population had been diagnosed with relapsing-remitting multiple sclerosis (RRMS), while 23.2% had been diagnosed with secondary progressive multiple sclerosis (SPMS). The mean baseline EDSS score was 3.4 (SD = 1.3), consistent with a moderate level of disability, and 88.8% of the study population were taking DMDs. Clinical activity (MS relapses) was present in 6.5% of the study population, while 13.5% had MRI activity, suggesting that the study population was relatively stable at the time of enrolment. A total of 306 individuals (76.6%) either reached 24 months of follow-up or the main outcome (full follow-up group). There were no statistically significance differences between the drop out group and the full follow-up group regarding baseline characteristics (Table 1).
Baseline characteristics of the study cohort.
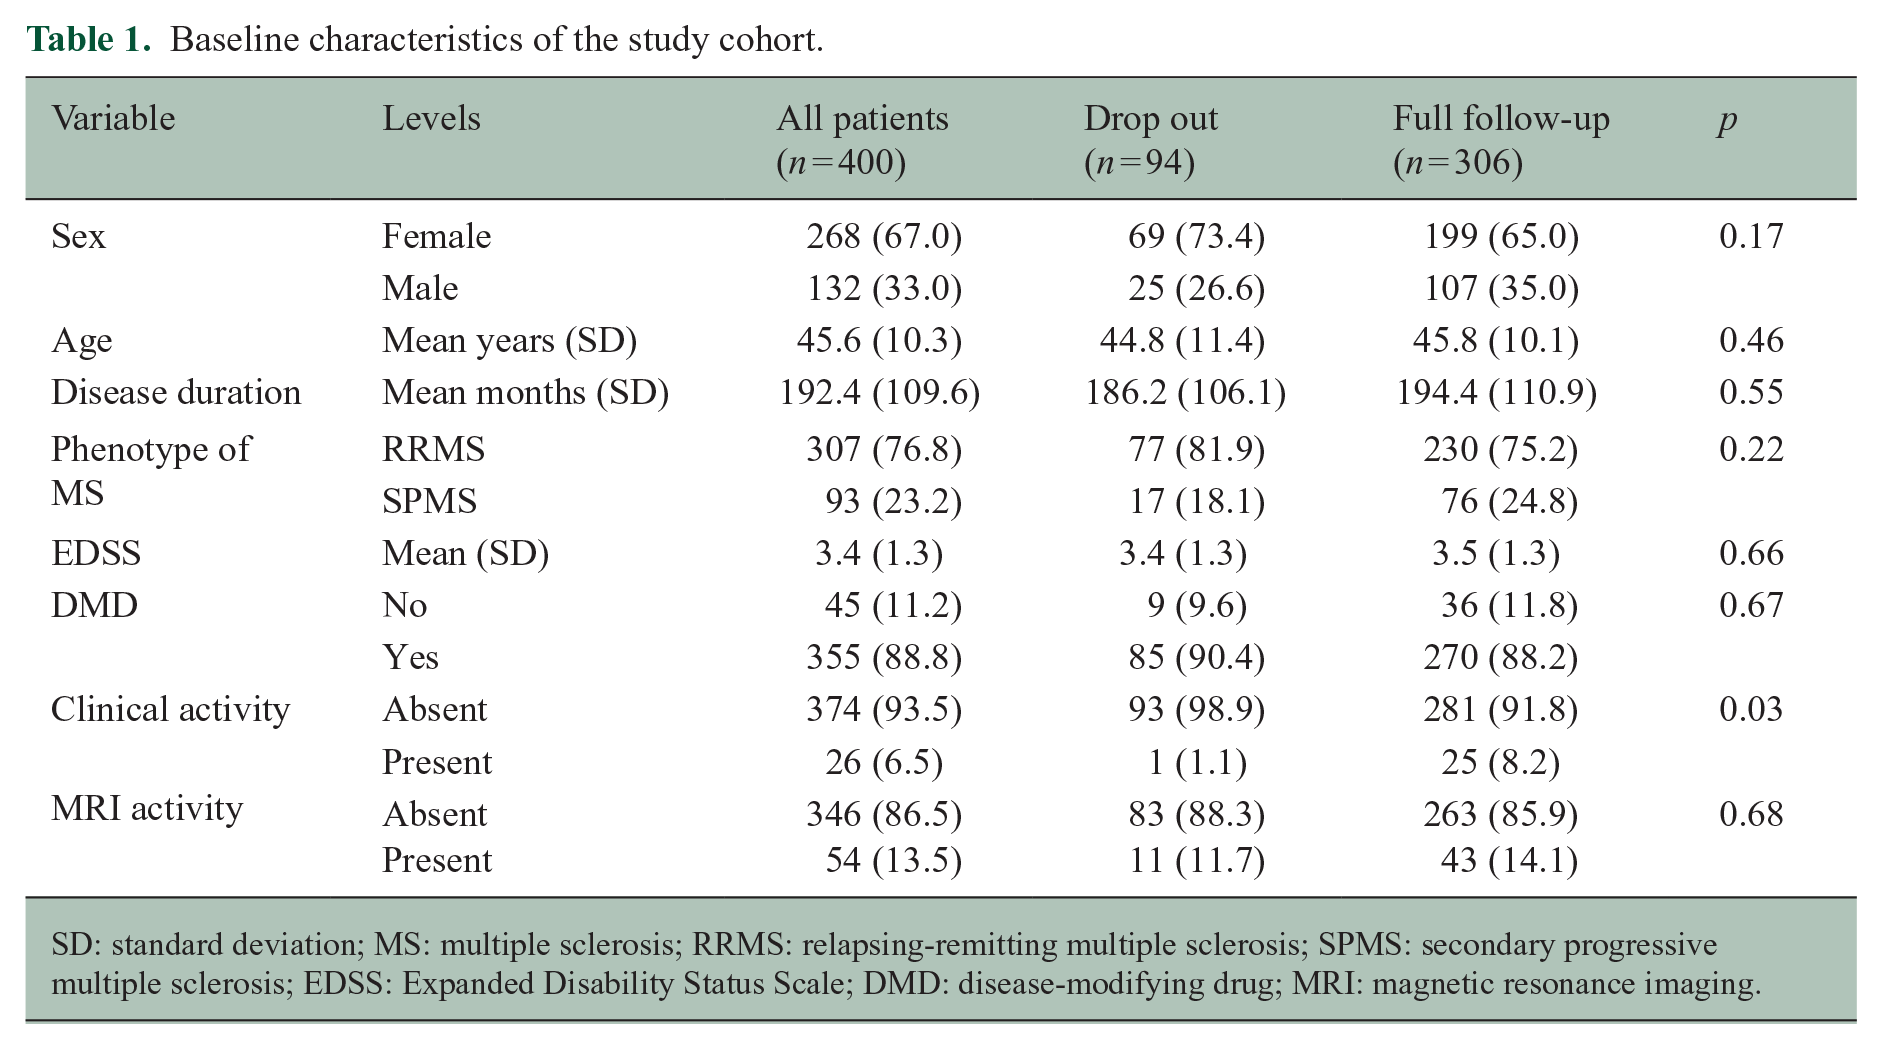
SD: standard deviation; MS: multiple sclerosis; RRMS: relapsing-remitting multiple sclerosis; SPMS: secondary progressive multiple sclerosis; EDSS: Expanded Disability Status Scale; DMD: disease-modifying drug; MRI: magnetic resonance imaging.
Standard definition of disability progression based on the EDSS development
The main outcome, confirmed disability progression as defined by the EDSS, was reached by 74/306 patients (24.2%). The results of the longitudinal linear mixed-effects model are shown in Table 2. The results indicate that, overall, the number of daily steps recorded by the Fitbit is significantly related to the EDSS score. Specifically, the model estimates that, on average, a 1-point increase in the EDSS score is associated with a decrease of approximately 895 daily steps (p < 0.01). In addition, the model estimates that, on average, the number of daily steps decreases by approximately 3.5 steps per day over the course of the study.
Results of the longitudinal linear mixed effect models for the outcome variables of disability progression.
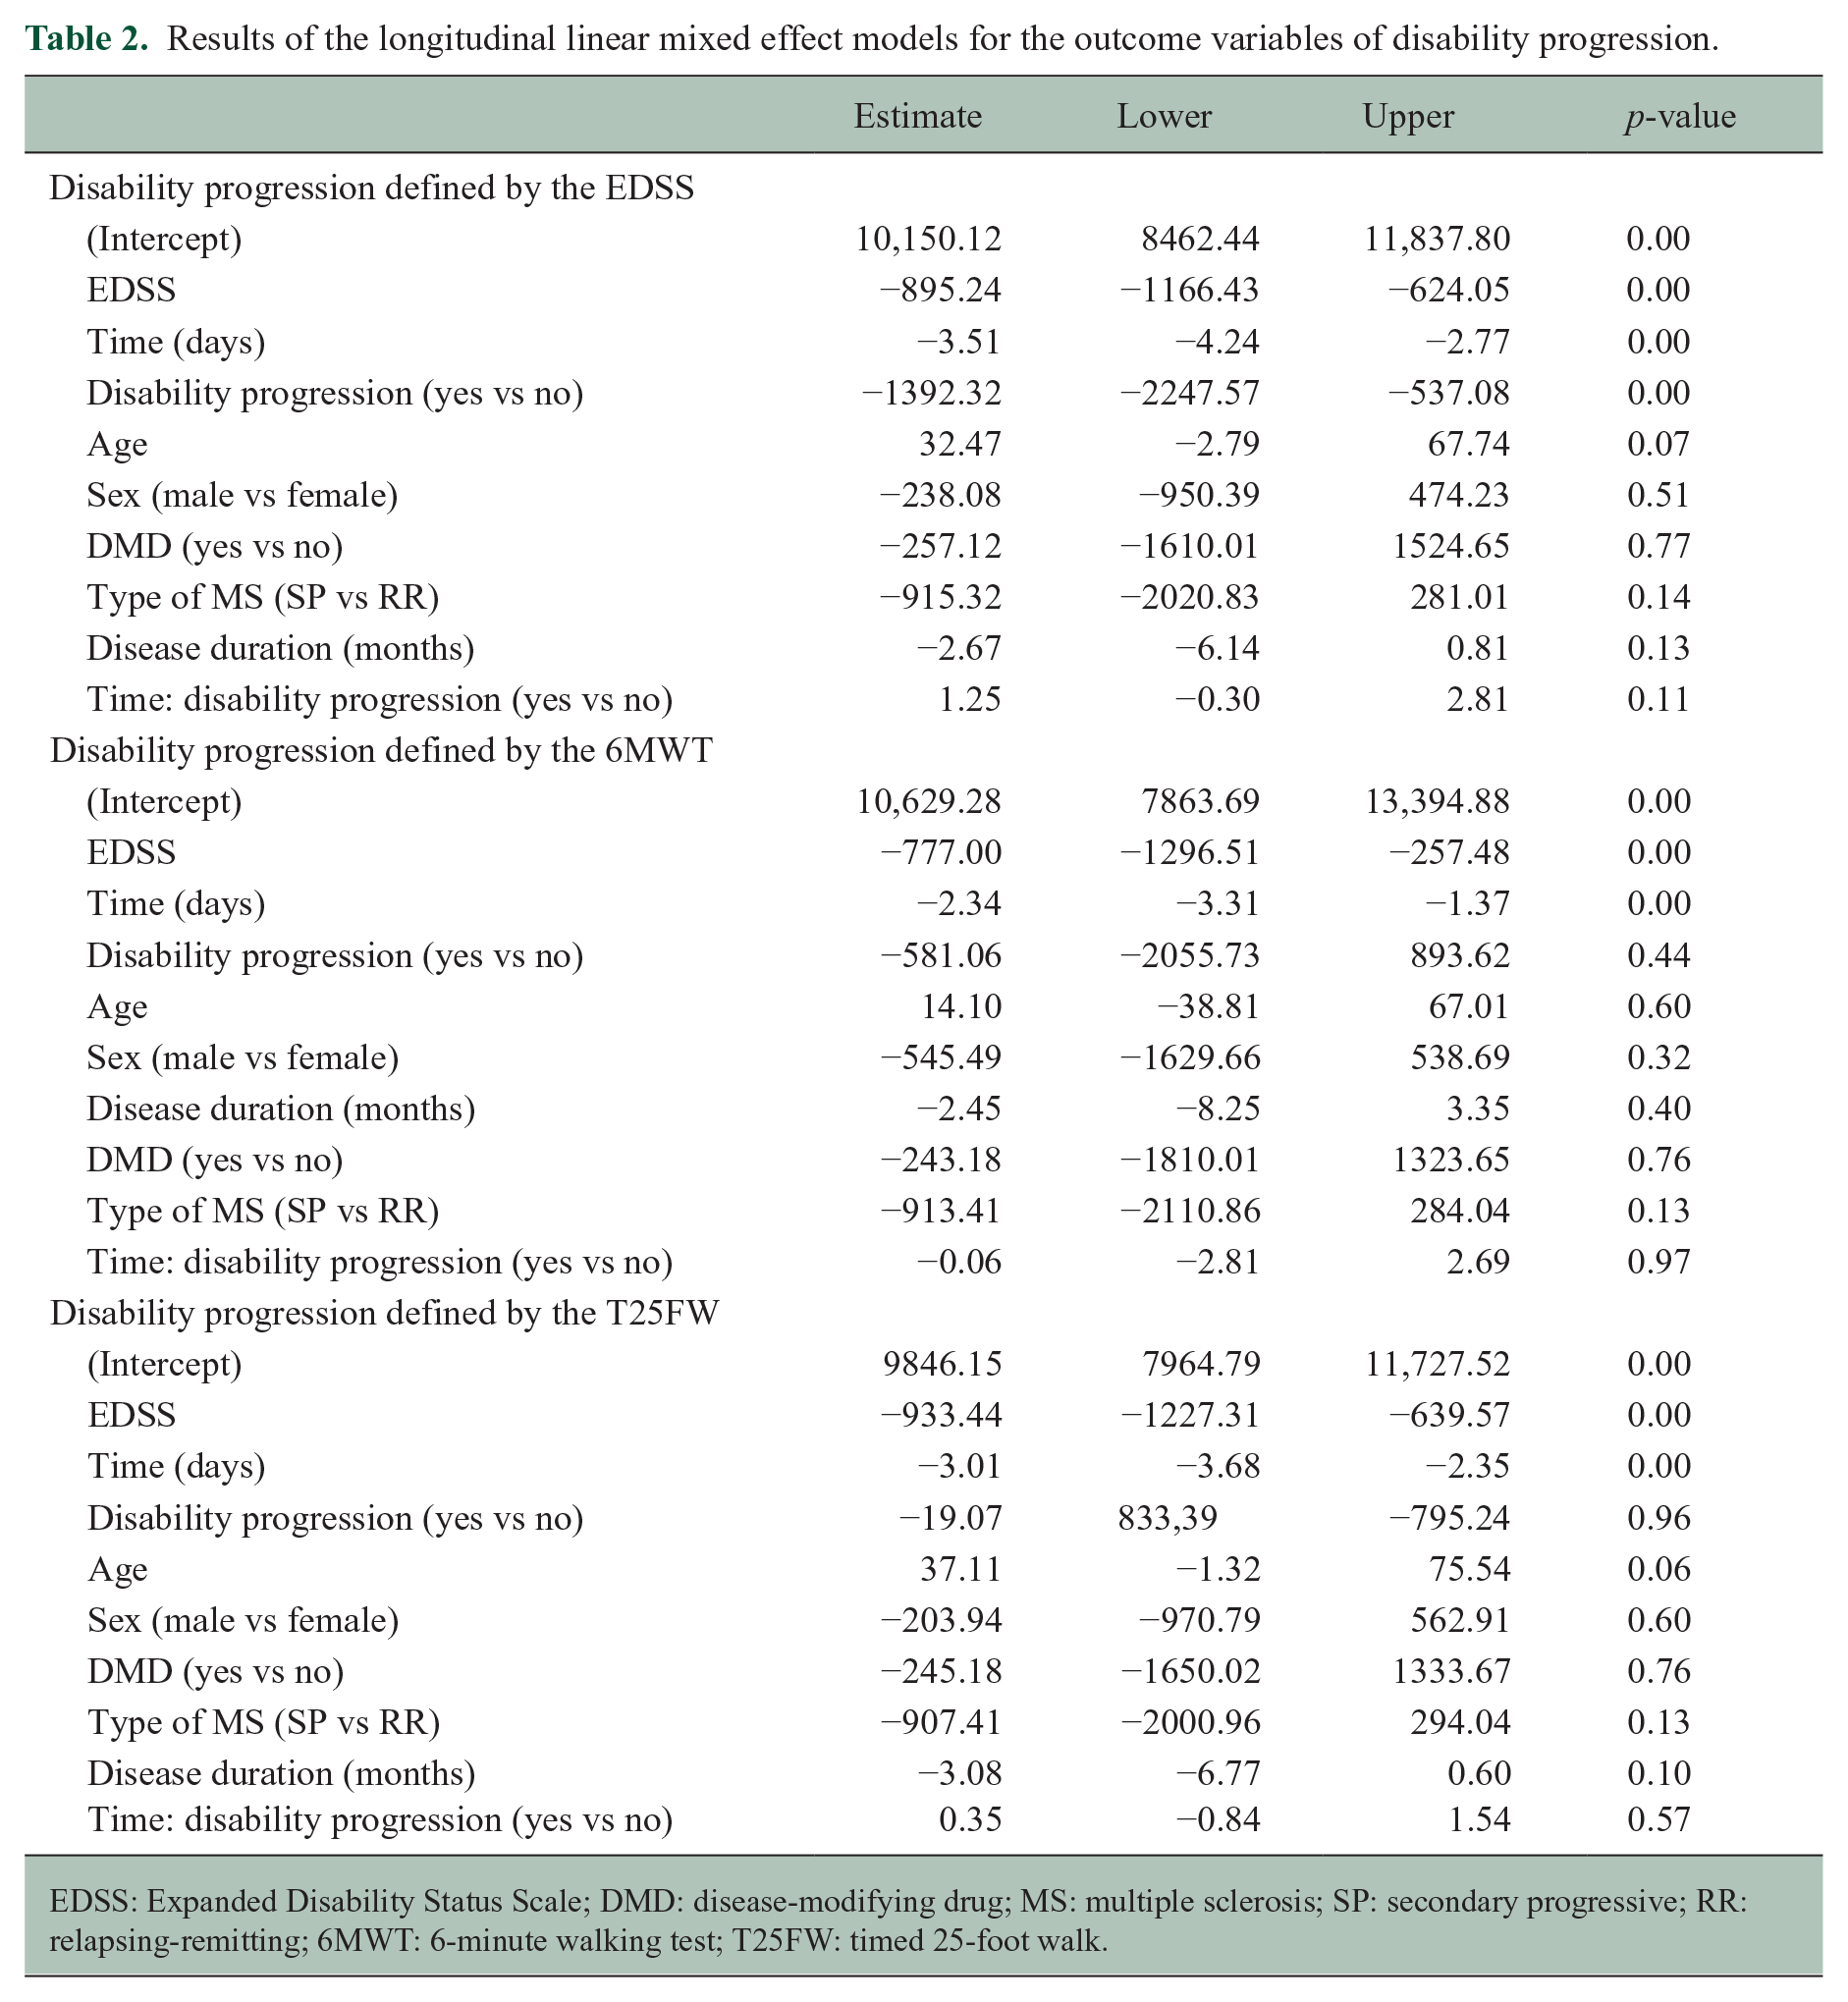
EDSS: Expanded Disability Status Scale; DMD: disease-modifying drug; MS: multiple sclerosis; SP: secondary progressive; RR: relapsing-remitting; 6MWT: 6-minute walking test; T25FW: timed 25-foot walk.
The results also suggest that disability progression assessed by the EDSS is statistically significantly associated with a decrease in the number of daily steps. Specifically, the model estimates that, on average, patients who experienced disability progression had approximately 1392 fewer daily steps compared with those who did not experience confirmed disability progression However, it is worth noting that the interaction between time and disability progression was not statistically significant (p = 0.11), indicating that the decrease in the number of steps experienced over time in patients that had EDSS progression and stable patients was not significantly different (Figure 2(a)). Finally, the results show that age, sex and disease duration are not significantly associated with the number of daily steps. The results did not change by restricting the analysis to the period of time before the onset of the COVID-19 pandemic. We then performed a cluster analysis to explore characteristics of patients classified as stable by the EDSS in the follow-up to explore characteristics of those erroneously classified by the scale. The results of the cluster analysis showed that there were two distinct clusters of patients defined as stable by the EDSS over the follow-up period (Figure 2(b), Table 3). When comparing the baseline characteristics of the two clusters (Table 4), there were no statistically significant differences in terms of sex, age, disease duration, MS phenotype and the use of DMDs. In terms of disability measures, there were no significant differences in terms of EDSS scores at baseline, but there was a trend towards a lower mean EDSS score in cluster 2 compared with cluster 1. Additionally, there were no significant differences in terms of clinical or MRI activity between the two clusters. These results suggest that the two clusters of patients classified as stable by the EDSS overall are similar in terms of their baseline characteristics and disease severity and activity.
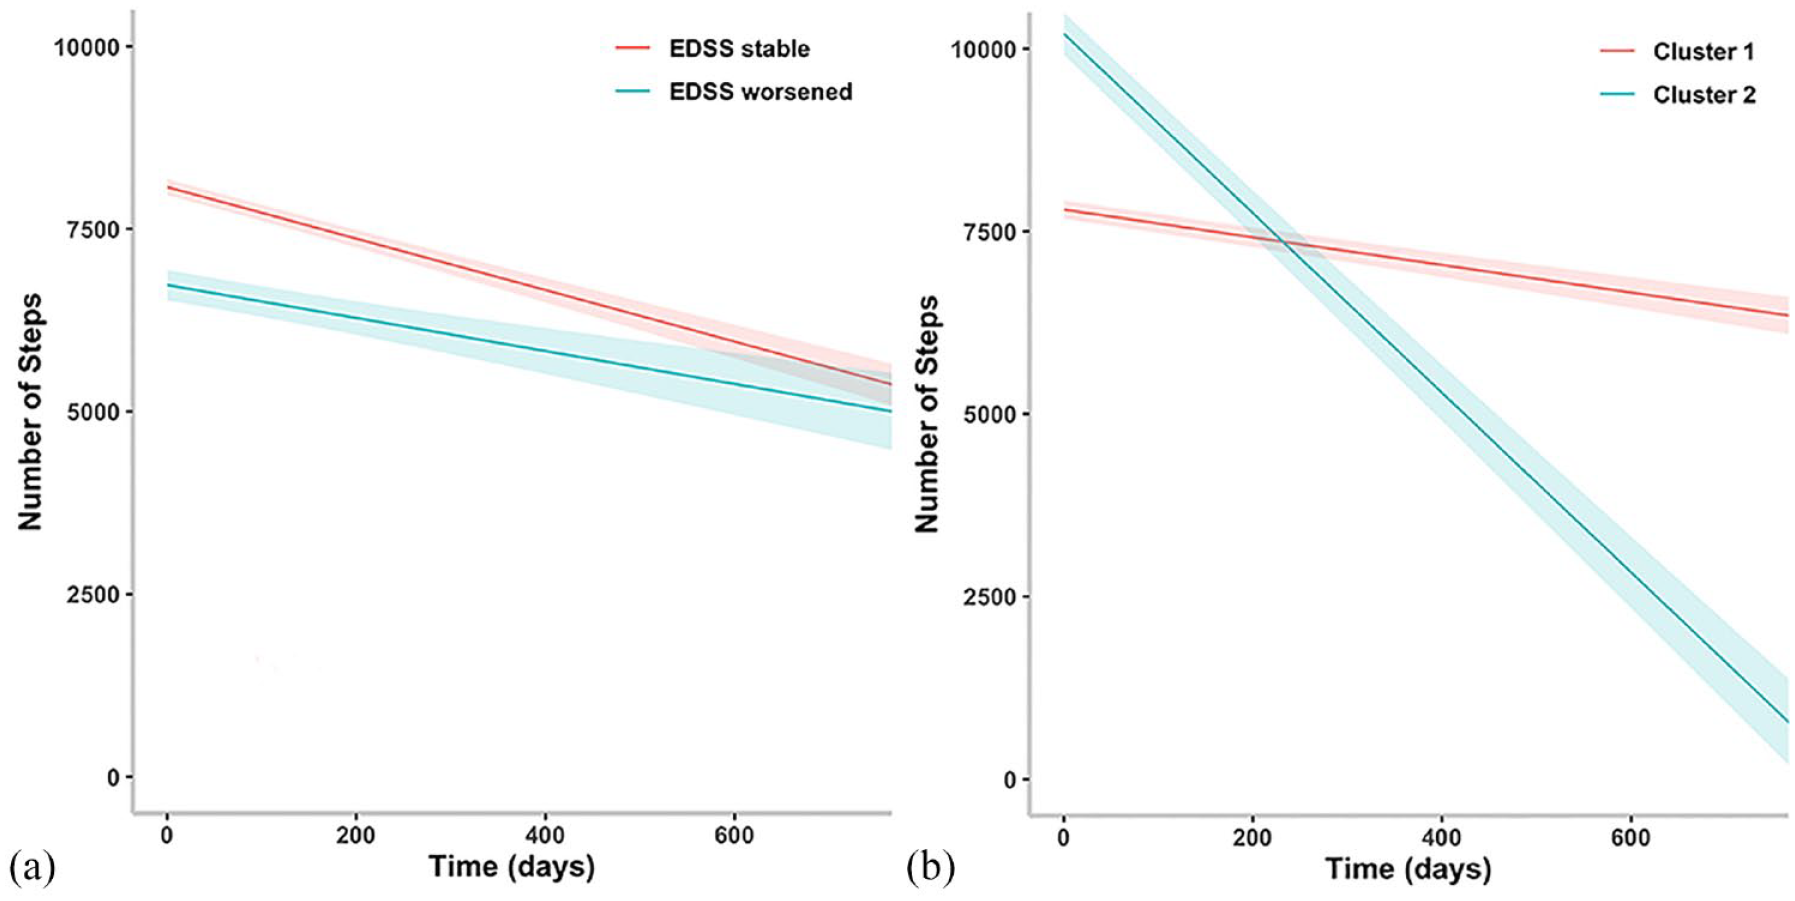
Results of the longitudinal linear mixed effect models for confirmed EDSS progression (a) and for the behaviour of different clusters of patients wrongly defined as stable by the EDSS (b).
Results of the longitudinal linear mixed effect model comparing the behaviour of different clusters of patients wrongly defined as stable by the EDSS.
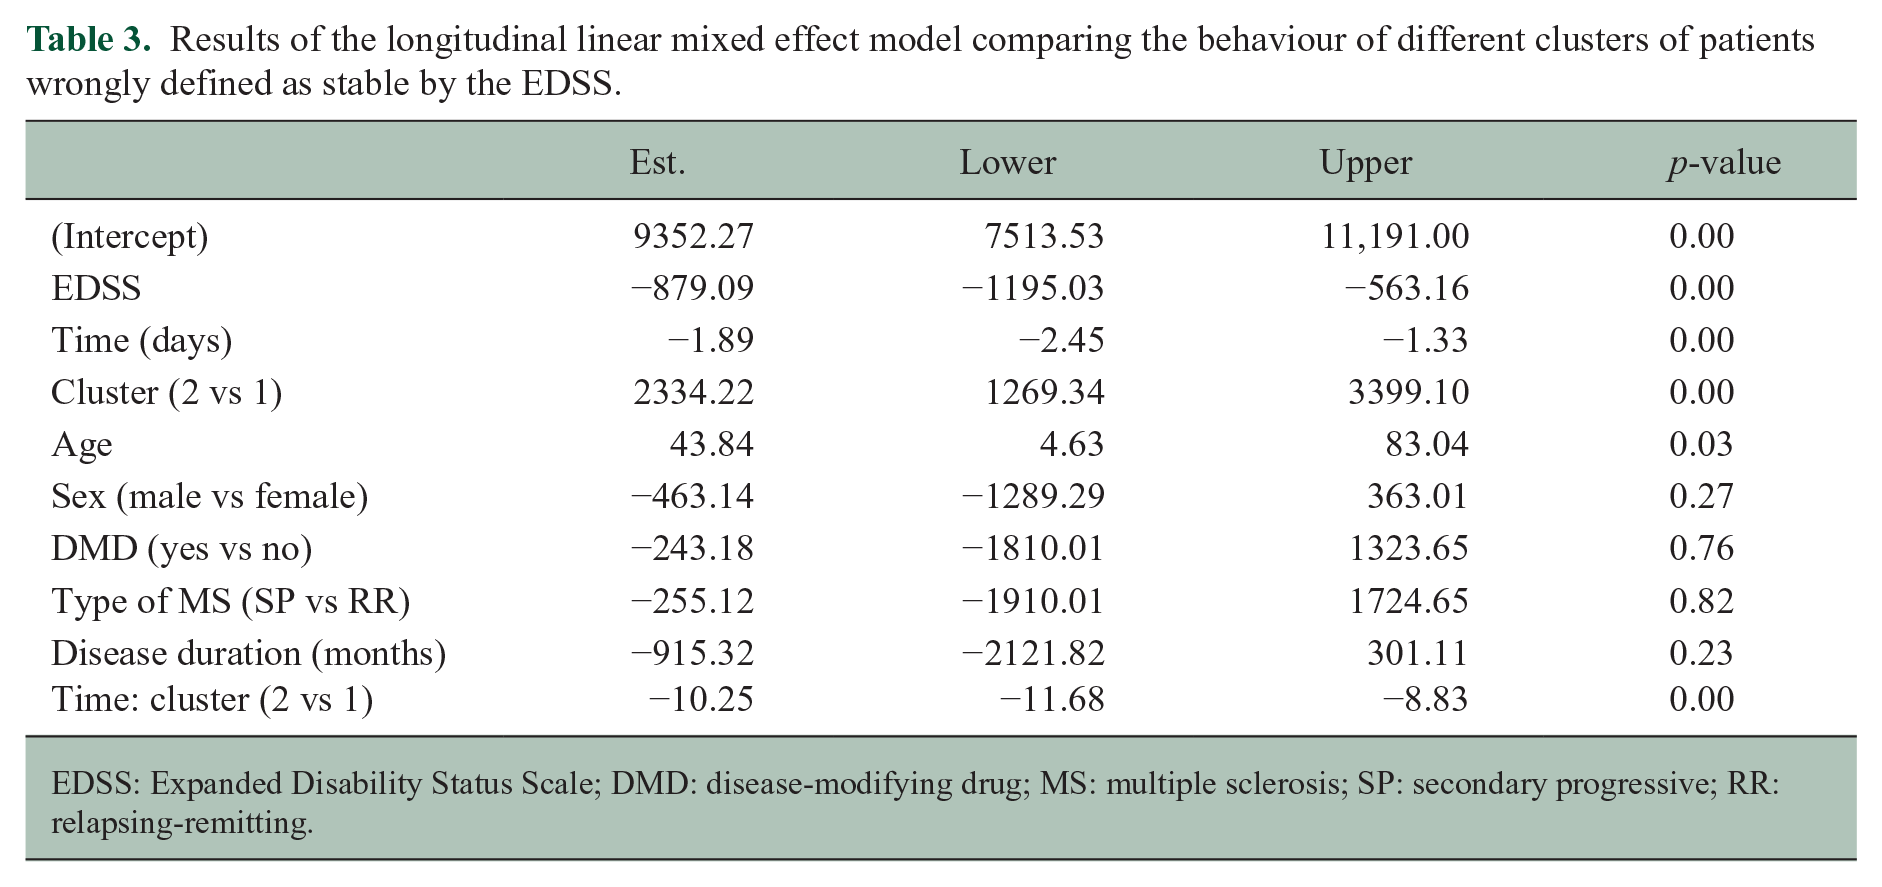
EDSS: Expanded Disability Status Scale; DMD: disease-modifying drug; MS: multiple sclerosis; SP: secondary progressive; RR: relapsing-remitting.
Baseline characteristics of different clusters or patients wrongly defined as stable by the EDSS.
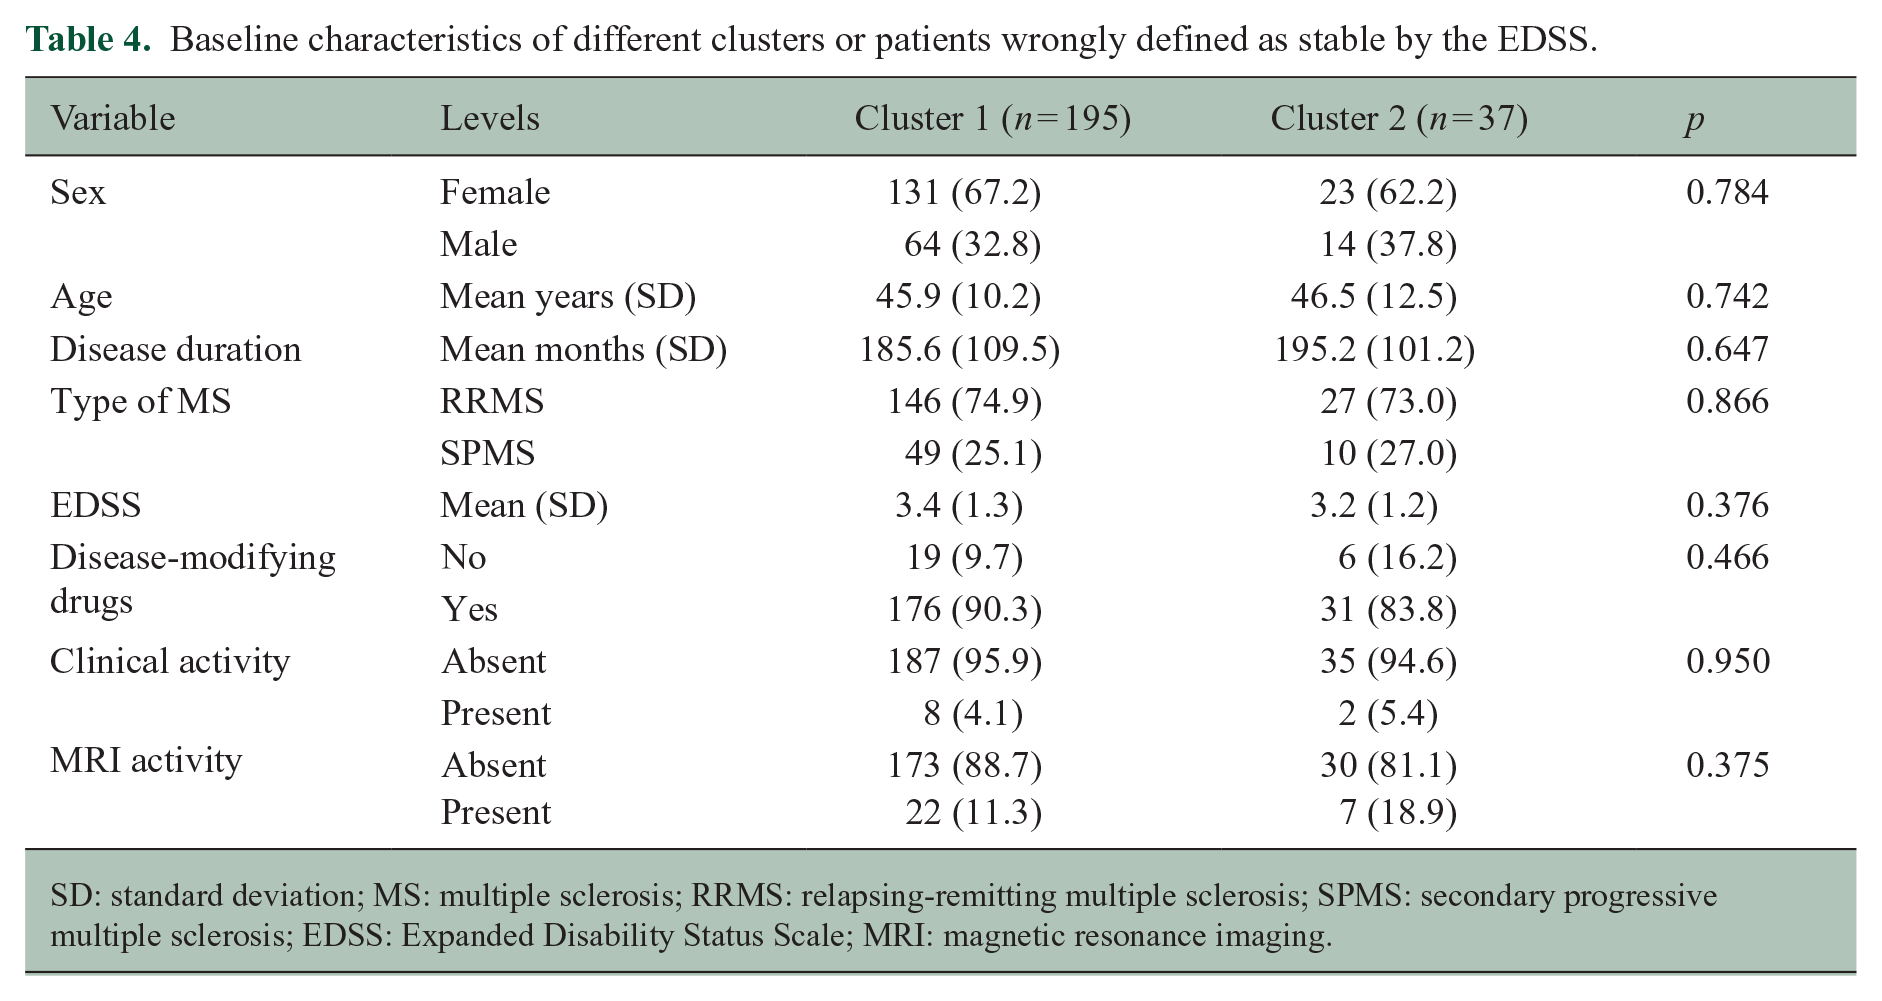
SD: standard deviation; MS: multiple sclerosis; RRMS: relapsing-remitting multiple sclerosis; SPMS: secondary progressive multiple sclerosis; EDSS: Expanded Disability Status Scale; MRI: magnetic resonance imaging.
Worsening of the 6MWT
Disability progression as defined by the 6MWT was reached by 38 of 306 patients (12.4%). The results of the longitudinal linear mixed effect model (Table 2, Figure 3(a)) indicate that the number of daily steps recorded by the Fitbit is not statistically significant related to the result of the 6MWT. Specifically, disability progression as defined by the 6MWT is not significantly associated with a decrease in the number of daily steps as the interaction between time and disability progression was also not statistically significant.
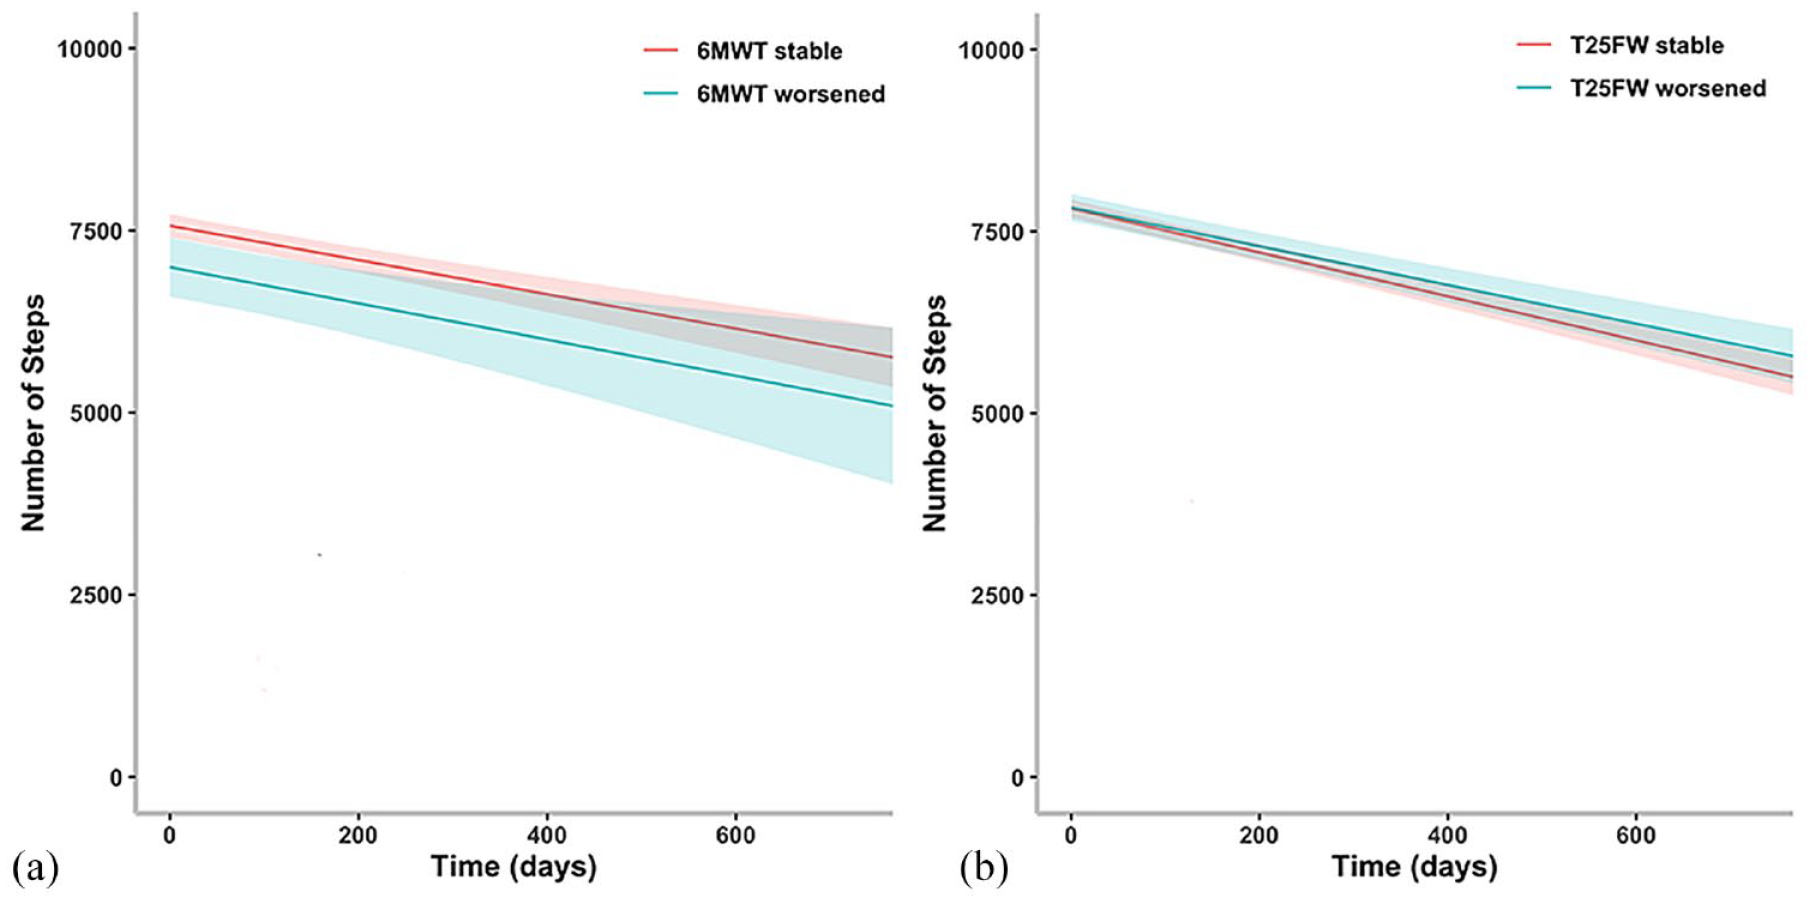
Results of the longitudinal linear mixed effect models for disability progression defined by the 6MWT worsening (a) and the T25FW worsening (b).
Standard definition of disability progression based on the T25FW
Disability progression as defined by the T25FW was reached by 42 of 306 patients (13.7%). The results of the longitudinal linear mixed effect model (Table 2, Figure 3(b)) indicate that the number of daily steps recorded by the Fitbit is not significantly related to the measure of the T25FW. Specifically, disability progression as defined by the T25FW is not significantly associated with a higher decrease in the number of daily steps over time as the interaction between time and disability progression was not significant.
Discussion
In this study, we used Fitbit data to assess disability progression in individuals with MS and found that the number of daily steps was significantly related to disability progression as defined by the EDSS as individuals who experienced disability progression had a lower number of daily steps compared with those who did not experience progression. One important aspect to consider in the interpretation of these results is the fact that the interaction between time and disability progression was not statistically significant in any of the three disability measures analysed, suggesting that the number of daily steps may be more sensitive than clinical scales in detecting changes in functional abilities over time.
Wearable biosensors, particularly accelerometers, have been widely used to assess gait and balance in patients with MS in real-world settings.8,17–20 These studies have consistently demonstrated that MS patients are less ambulatory than healthy controls.17,18 A decrease in ambulation is directly linked to disability, as demonstrated by the association between higher EDSS scores and lower average daily walking activity in patients with MS. 17 A recent study using both commercially available and research accelerometers in patients with MS with relapsing or progressive disease found moderate to strong correlations with other gait measures and identified variability in real-world walking disability not captured by EDSS scores. 17 These findings suggest that step-count monitoring may be a useful exploratory outcome measure in clinical trials. In a study by Block et al., 17 95 patients with wrist-worn accelerometers were followed for up to 1 year, and a decreasing average daily step count was found to be associated with worsening of clinically based outcomes. Our results align with these findings, as we also observed that a lower baseline average daily step count is associated with increased odds of disability progression.
This characteristic could potentially be used to screen study participants in clinical trials based on their average daily step count, which could enrich the trial by identifying individuals at highest risk of worsening disability in the short term, reducing sample size, cost and study duration. We further confirmed the finding from the study by Block et al. 17 that approximately half of the patients who showed a significant reduction in average daily step count did not experience either a decrease in the T25FW or worsening of EDSS scores. In our study, we also performed a cluster analysis to try to identify characteristics of patients misclassified as stable by standard clinical scales, but no significant differences were found between misclassified and correctly classified patients. These results support the use of average daily step count as a sensitive, ecologically valid and longitudinal outcome measure in MS, able to capture subtle disability changes not apparent with standard clinical scales.
It is also important to consider the limitations of this study. The sample size was relatively small, which may have limited the power to detect significant interactions between time and disability progression. In addition, the study was conducted over a relatively short period of time (2 years), which may not have been sufficient to detect changes in functional abilities that occur more slowly over longer periods of time. Additionally, it is pertinent to highlight the limitations inherent in wrist-worn accelerometers, as movements of the upper arm, not necessarily related to ambulation, could potentially influence the accelerometer readings, possibly leading to an overestimation of the actual step counts. While Fitbit algorithms work to minimize these inaccuracies, this may be another limitation to consider when interpreting the findings. However, it is important to recognize that the use of continuous activity monitoring as an outcome measure in MS is still in its early stages, and further research is needed to fully understand its utility and limitations.
Future studies should explore the potential of continuous activity monitoring to capture changes in functional impairment over time and in response to treatment, as well as the factors that may influence its sensitivity and accuracy as a measure of disability progression in MS. Overall, according to our data, the use of continuous activity monitoring holds great promise as a sensitive and ecologically valid measure of disability progression in MS especially in individuals with MS exhibiting low to moderate disability levels, and further research in this area is warranted.
Footnotes
Acknowledgements
This communication reflects the views of the RADAR-CNS consortium, and neither IMI nor the European Union and EFPIA are liable for any use that may be made of the information contained herein.
Contributors
G.D.C., C.N., A.Z., M.B., M.M., F.S., A.I.G., L.R., M.L.L.P., M.M., R.B., S.K., E.L., E.G., F.B.P., B.W.S., A.F., S.C., L.L., S.V., N.C., R.D., M.H., V.N., X.M., P.S.S. and G.C. contributed to the study design. G.D.C. contributed to the data analysis, figures drawing and manuscript writing. G.D.C., C.N., A.Z., M.B., M.M., F.S., A.I.G., L.R., M.L.L.P., M.M., R.B., S.K., E.L., E.G., F.B.P., B.W.S., A.F., S.C., L.L., S.V., N.C., R.D., M.H., V.N., X.M., P.S.S. G.C. contributed to the critical revision of the manuscript. A.F. and S.C. contributed to the platform design and implementation. G.D.C., C.N., A.Z., M.B., M.M., F.S., A.I.G., L.R., M.L.L.P. and M.M. contributed to data collection.
Data Sharing Statement
The scientific data used in this paper is collected under the project: EU/EFPIA IMI RADAR-CNS (grant agreement no. 115902). The data usability and sharing are performed under the agreed guidelines of RADAR-CNS consortium. The anonymized data will be shared upon request subject to RADAR-CNS consortium approval. Pending the aforementioned approval, data sharing will be made in a secure setting, on a per-case-specific manner. Please submit such requests to the corresponding author of the paper. The shared data cannot be used for publication purposes without explicit consent of the RADAR-CNS consortium. The additional related documents are available (e.g. study protocol, statistical analysis plan, informed consent form) upon request.
Declaration of Conflicting Interests
The author(s) declared the following potential conflicts of interest with respect to the research, authorship and/or publication of this article: S.V. and V.N. are employees of Janssen Research & Development LLC and may own equity in the company.
Funding
The author(s) disclosed receipt of the following financial support for the research, authorship and/or publication of this article: This study was supported by EU/EFPIA IMI Joint Undertaking 2 (RADAR-CNS grant no. 115902).