
Abstract
Background:
The central vein sign (CVS) is a proposed magnetic resonance imaging (MRI) biomarker for multiple sclerosis (MS); the optimal method for abbreviated CVS scoring is not yet established.
Objective:
The aim of this study was to evaluate the performance of a simplified approach to CVS assessment in a multicenter study of patients being evaluated for suspected MS.
Methods:
Adults referred for possible MS to 10 sites were recruited. A post-Gd 3D T2*-weighted MRI sequence (FLAIR*) was obtained in each subject. Trained raters at each site identified up to six CVS-positive lesions per FLAIR* scan. Diagnostic performance of CVS was evaluated for a diagnosis of MS which had been confirmed using the 2017 McDonald criteria at thresholds including three positive lesions (Select-3*) and six positive lesions (Select-6*). Inter-rater reliability assessments were performed.
Results:
Overall, 78 participants were analyzed; 37 (47%) were diagnosed with MS, and 41 (53%) were not. The mean age of participants was 45 (range: 19–64) years, and most were female (n = 55, 71%). The area under the receiver operating characteristic curve (AUROC) for the simplified counting method was 0.83 (95% CI: 0.73–0.93). Select-3* and Select-6* had sensitivity of 81% and 65% and specificity of 68% and 98%, respectively. Inter-rater agreement was 78% for Select-3* and 83% for Select-6*.
Conclusion:
A simplified method for CVS assessment in patients referred for suspected MS demonstrated good diagnostic performance and inter-rater agreement.
Introduction
Early initiation of treatment in patients with multiple sclerosis (MS) improves clinical outcomes, making prompt diagnosis essential. 1 However, accurately diagnosing MS remains challenging in some cases due to radiological and clinical mimickers,2,3 leading to a high incidence of misdiagnosis, primarily overdiagnosis. 4 Unnecessary morbidity associated with disease-modifying therapies (DMTs) is associated with misdiagnosis. 5 While the 2017 McDonald criteria 6 allow for a shorter time to diagnosis,7,8 this comes at the cost of reduced specificity.9–11
The central vein sign (CVS) is a sensitive and specific radiologic biomarker for distinguishing MS from other causes of white matter lesions, including small vessel ischemic disease, migraine, and vasculitides,12–15 in single-center cohorts12,13,15 or retrospective/cross-sectional multicenter studies.16,17 The CVS can be visualized with different imaging sequences; FLAIR*, combining T2*-weighted segmented echoplanar imaging (segEPI) with fluid-attenuated inversion recovery (FLAIR), 18 has been shown to be more sensitive compared to susceptibility weighted imaging (SWI) methods at CVS detection.17,19
A key limitation of CVS studies to date is use of retrospective design, comparing participants with well-established MS diagnoses against participants with other well-established diagnoses. This type of study design likely amplifies differences between groups and is inadequate to inform clinical practice. In addition, while there is consensus on defining a CVS-positive lesion, 2 the optimal approach for measuring CVS positivity of a given brain scan for an MS diagnosis remains unclear. Percentage-based methods, which calculate a proportion of CVS-positive lesions using thresholds (35%–50%), are highly specific for MS;12,13,17,19,20 however, this is time-consuming, especially for individuals with many lesions. More efficient methods have been developed using simplified clinical algorithms, such as simplified counts of CVS + lesions. 21 These simplified methods offer promise as easy-to-use clinical tools. However, how these simplified methods perform in individuals at the time of presentation to MS centers is unknown.
Using 3 tesla (T) 3D FLAIR* magnetic resonance imaging (MRI), we conducted a multicenter pilot study under the auspices of the North American Imaging in Multiple Sclerosis Cooperative (NAIMS) to investigate (1) the feasibility of multicenter deployment of FLAIR* imaging and multi-rater CVS assessment, to inform a larger-scale multicenter prospective study, and (2) diagnostic performance of a simplified CVS method in accurately diagnosing MS using FLAIR* imaging in patients presenting for MS evaluation.
Materials and methods
Participants
The Central Vein Sign in MS (CAVS-MS) Pilot was a multicenter observational study aimed at examining the feasibility of CVS using 3T FLAIR* imaging to diagnose MS. Local Institutional Review Board (IRB) approval was obtained at 10 NAIMS sites. Individuals referred for a clinical/radiological suspicion of MS across the 10 sites were identified and approached for study participation. Written informed consent was obtained from all participants. Key inclusion criteria were age 18–65 years, referral to the academic site for new clinical/radiological suspicion of MS, and brain MRI scan demonstrating focal white matter T2 hyperintensities. Exclusion criteria were use of DMTs, contraindications to or intolerance of MRI or Gadolinium (Gd), and treatment with systemic corticosteroids in the 4 weeks preceding enrollment. Recruitment occurred between April 2018 and February 2020.
Overall, 97 participants in total were recruited. MRIs from 92 participants passed quality assessment by an MR physicist (P.S.). Four participants were removed from analysis due to excessive image artifacts. One participant was removed due to absent post-Gd imaging. In the analysis, only participants with a diagnosis of MS or an alternate diagnosis were included, and those diagnosed with clinically isolated syndrome or radiologically isolated syndrome were excluded, given the study’s cross-sectional design limiting longitudinal assessment of MS development.
Study design and outcomes
After informed consent, participants completed a study visit which included a research MRI. Subjects with MS were confirmed to fulfill 2017 McDonald criteria (MC) including the exclusion of other diagnoses. 6 MS diagnosis was assessed by subspecialty-trained neurologists using data from clinical practice, including clinical history, neurological exam, standard MRI studies, and additional testing, such as cerebrospinal fluid tests as deemed clinically relevant. Assessment of MS diagnosis was blinded to CVS status. For patients not diagnosed with MS, the alternate diagnosis was reported.
Image acquisition
All participants underwent a single brain MRI on a 3T scanner. Siemens (Siemens, Germany) scanners were used at seven sites (Prisma Fit (n = 2), Prisma (n = 1), Biograph mMR (n = 1), and Skyra (n = 3)) and Philips (Philips, Netherlands) scanners were used at three sites (Ingenia, Ingenia Elition X, and Achieva dStream). A detailed MRI manual and a prespecified imaging protocol were used to ensure uniform acquisitions across sites; protocol details are presented in Table 1. Examinations used a single dose (0.1 mmol/kg) of a macrocyclic gadolinium-based contrast agent (gadoterate, gadoteridol, or gadobutrol, depending on the site’s routine practice).
Brain MRI protocol used at all participating sites.
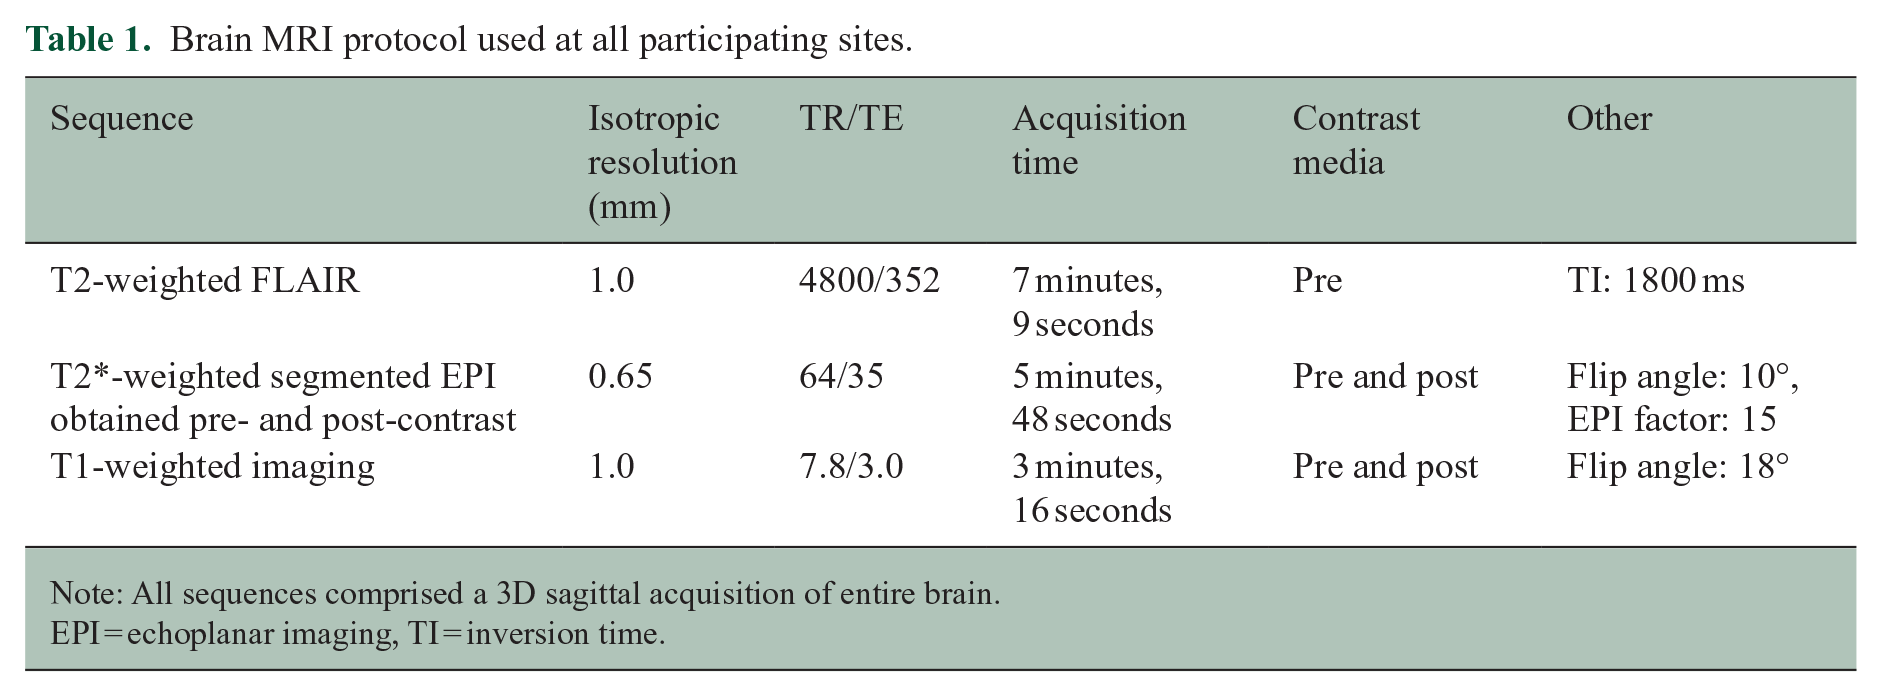
Note: All sequences comprised a 3D sagittal acquisition of entire brain.
EPI = echoplanar imaging, TI = inversion time.
Image analysis
Images were uploaded and post-processed on a dedicated MRI cloud platform (QMENTA® (Boston, MA)). Three postprocessing steps were used to generate FLAIR* images as previously reported. 18 Creation of FLAIR* images was automated, taking less than 30 minutes.
All CVS raters were trained on a standardized dataset of annotated images with CVS+ and CVS− lesions curated from a prior study. 21 For the simplified CVS method (Select-n* analysis), neurologists served as site raters and independently evaluated up to 12 participant MRIs for CVS on the QMENTA cloud platform. Raters identified up to six CVS+ lesions that met NAIMS CVS criteria 2 (Table 2) on post-Gd FLAIR* scans. Diagnostic performance of the CVS for MS was evaluated at counts of one CVS+ lesion (Select-1*) up to six CVS+ lesions (Select-6*). Detailed analyses focused on Select-3* and Select-6* as previous data supported these thresholds.15,21 For an inter-rater reliability (IRR) evaluation of the simplified method, two central raters (L.D., a fourth-year medical student, and M.A., a neuroimmunology fellow), both blinded to clinical information, evaluated the scans (L.D.: all scans, M.A.: 30 scans).
NAIMS CVS criteria. 2
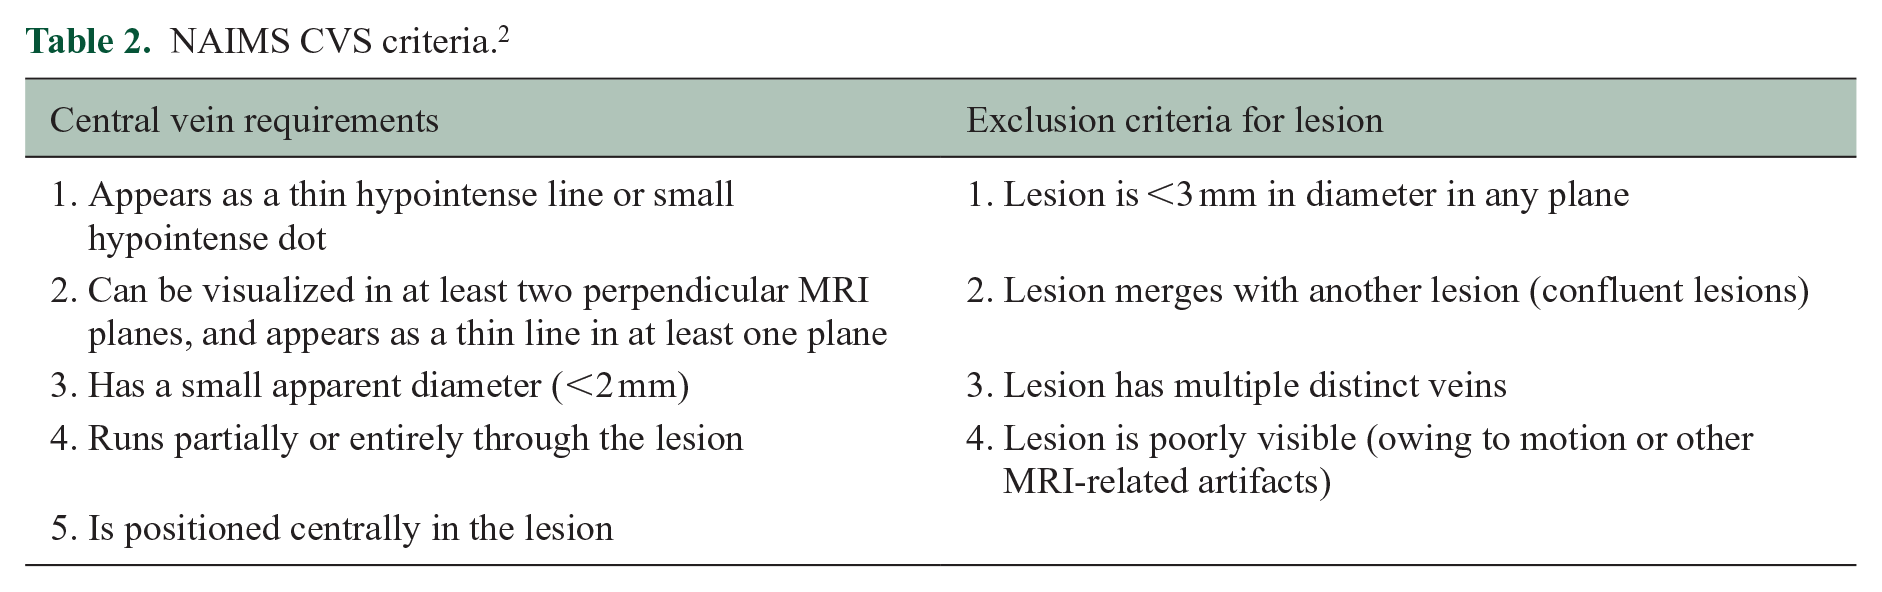
For the percentage-based CVS evaluation, FLAIR images were used to create a lesion mask using ITK-SNAP. Subsequently, post-Gd FLAIR* images were masked, and a central rater (L.D.) evaluated each scan. Lesion coordinates, location category, and CVS category were recorded for each lesion. Location categories included juxtacortical, periventricular, infratentorial, and subcortical/deep white matter. The following CVS categories were used: (1) CVS-positive (CVS+) if a central vein was identified on at least two of three planes, meeting NAIMS criteria; 2 (2) CVS-negative (CVS−) if there was no identifiable central vein; (3) CVS-indeterminate if there was the appearance of a vein on one plane with insufficient clarity to confidently identify it as CVS+ or CVS−; and (4) excluded if it met a NAIMS exclusion criteria. 2 The percentage of CVS+ lesions on each scan was calculated as the total number of CVS+ lesions divided by the sum of CVS+ and CVS− lesions. Thresholds were dichotomized using cutoffs from 35% up to 50%, with a 5% step size, based on past literature identifying these thresholds as being useful in discriminating MS from non-MS patients.12,13,17,20,22 For an IRR evaluation of the percentage-based method, the second central rater (M.A.) evaluated 30 scans.
Statistical analysis
Receiver operating characteristic (ROC) curves were constructed to visualize discriminative performance of the CVS for MS via the area under the ROC curve (AUROC). Youden’s J index was used to assess the optimal cutoff value for predicting MS. A chi-square test was used to compare differences in distributions of brain lesions based on MS diagnosis. The Mann–Whitney U Test was used to determine the differences in CVS detection between MS participants and non-MS participants.
IRR for the simplified method was determined at the Select-3* and Select-6* thresholds between a central rater (L.D.) and site raters using Cohen’s Kappa as a weighted average for the entire cohort and between two central raters (L.D. and M.A.) for a subset of 30 participants chosen randomly. For this calculation, raters had to agree that at least three lesions in a scan were CVS+ for Select-3*, or six for Select-6*. IRR for the percentage-based method was conducted between two central raters (L.D. and M.A.) on a subset of 30 participants chosen randomly using Cohen’s Kappa by evaluating lesions classified as CVS-positive or CVS-negative by both raters; agreement for (1) classifying WMLs as CVS-positive versus CVS-negative and (2) patient-level CVS positivity at the 40% threshold was calculated. For statistical analysis, GraphPad Prism 8 and JMP Pro 14 software were used.
Results
Demographics and clinical characteristics
In total, 78 participants were included in the analysis (see Figure 1). Demographics and clinical characteristics of participants are presented in Table 3. Of these, 37 (47%) participants (mean age ± SD: 41 ± 11) were diagnosed with MS. Two participants were diagnosed with primary-progressive MS; the remainder had relapsing–remitting MS. The most common presentations were sensory symptoms in a central nervous system (CNS) pattern (15/37), acute unilateral optic neuritis (6/37), double vision due to an internuclear ophthalmoplegia or sixth nerve palsy (4/37), and partial myelopathy (4/37). However, 41 (53%) participants (mean age 49 ± 10) did not have MS and were diagnosed with alternative diagnoses (non-MS). The most common diagnoses in this group were small vessel ischemic disease (n = 10), migraine (n = 7), and nonspecific white matter changes (n = 4); a full list is in Supplemental Table 1. Non-MS participants were on average older (p < 0.001, two-tailed t-test) with a higher prevalence of hypertension compared to MS participants (p = 0.028, Fisher’s exact test). Time since symptom onset was a median of 52 weeks in MS participants and 109 weeks in non-MS participants. Oligoclonal bands were tested for in 53 participants and were positive in 18/23 (78%) of MS participants and 5/21 (24%) of non-MS participants. For details on how participants fulfilled 2017 McDonald criteria, see Supplemental Table 2.
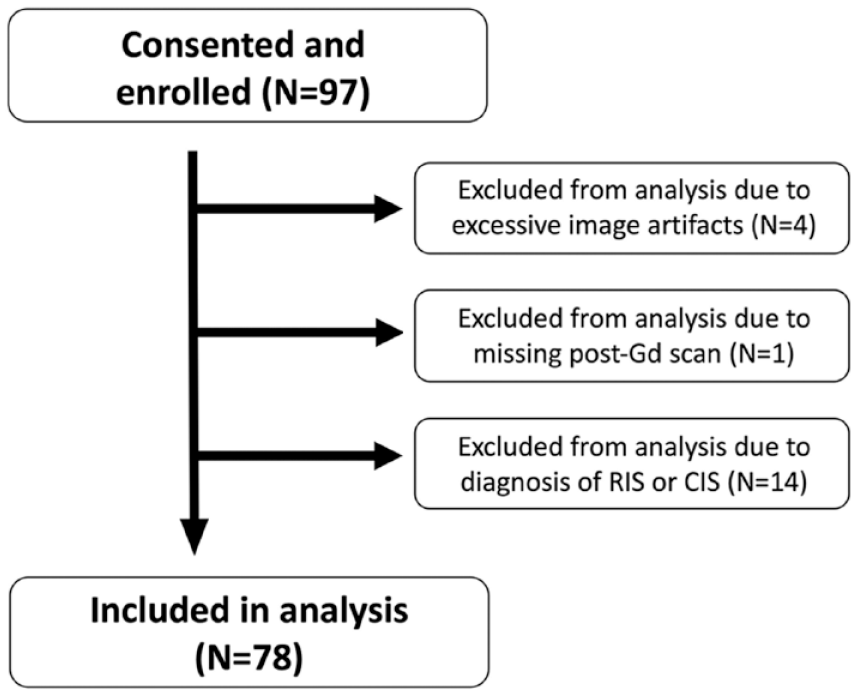
Flow diagram for study participants.
Demographics and clinical characteristics of study participants.
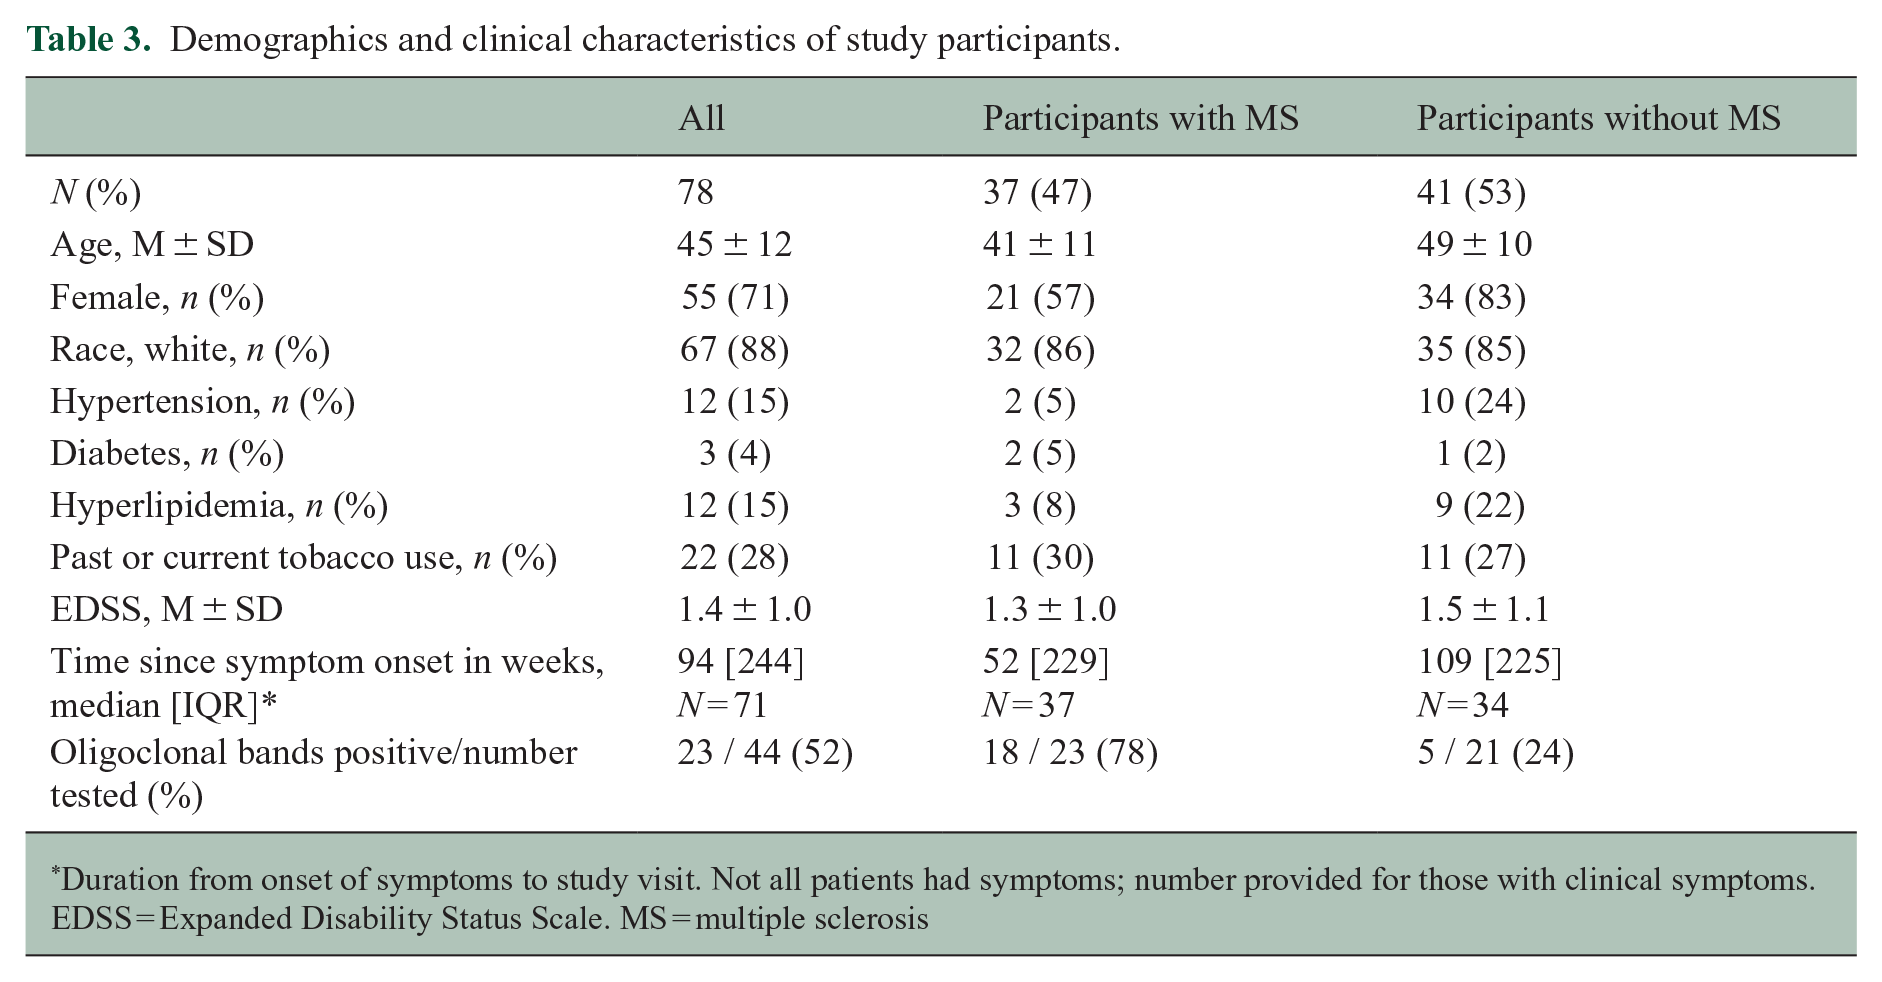
Duration from onset of symptoms to study visit. Not all patients had symptoms; number provided for those with clinical symptoms.
EDSS = Expanded Disability Status Scale. MS = multiple sclerosis
Site-rater simplified CVS analysis
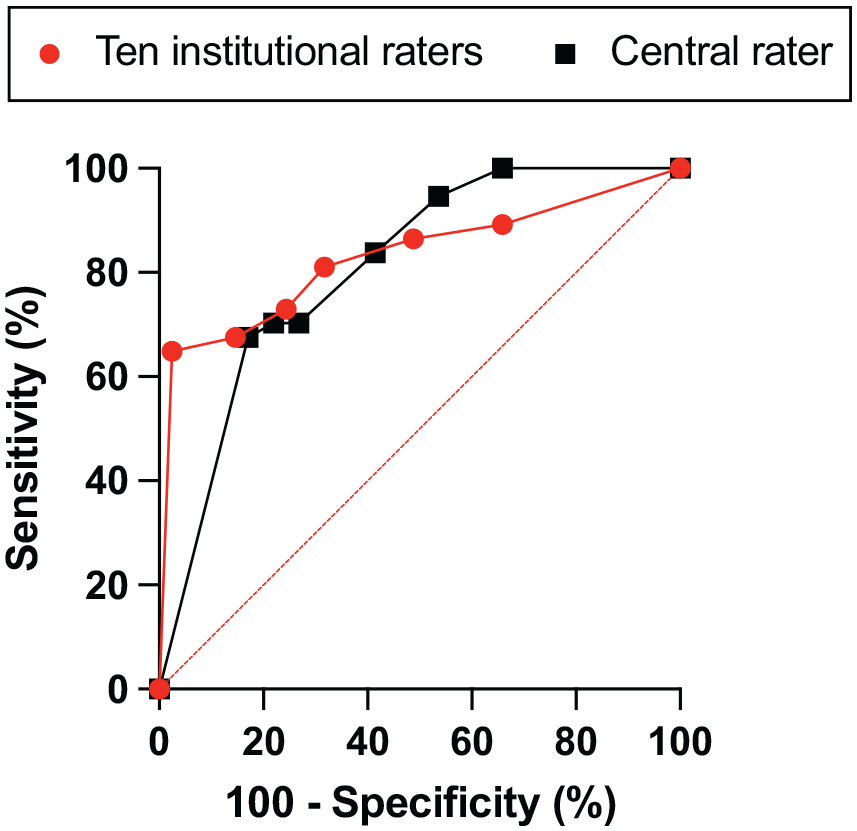
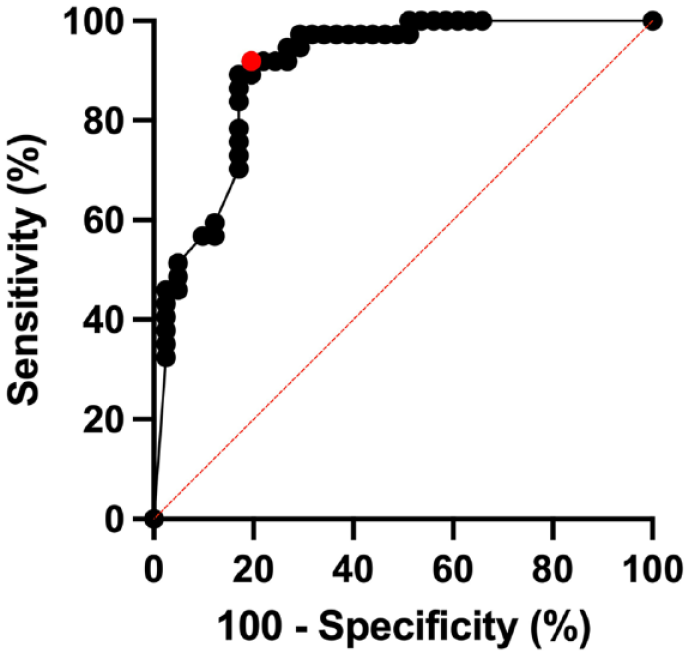
Examples of CVS-positive lesions as identified by the Select-n* technique are shown in Figure 2. For site ratings, the AUROC was 0.83 (95% CI: 0.73–0.93) (Figure 3). Table 4 demonstrates the performance of Select-n* at different thresholds. Diagnostic performance was optimized with Select-6* based on Youden’s J Index (sensitivity 65%, specificity 98%, and accuracy 82%). Diagnostic performance for Select-3* showed a sensitivity of 81%, specificity of 68%, and accuracy of 74%.
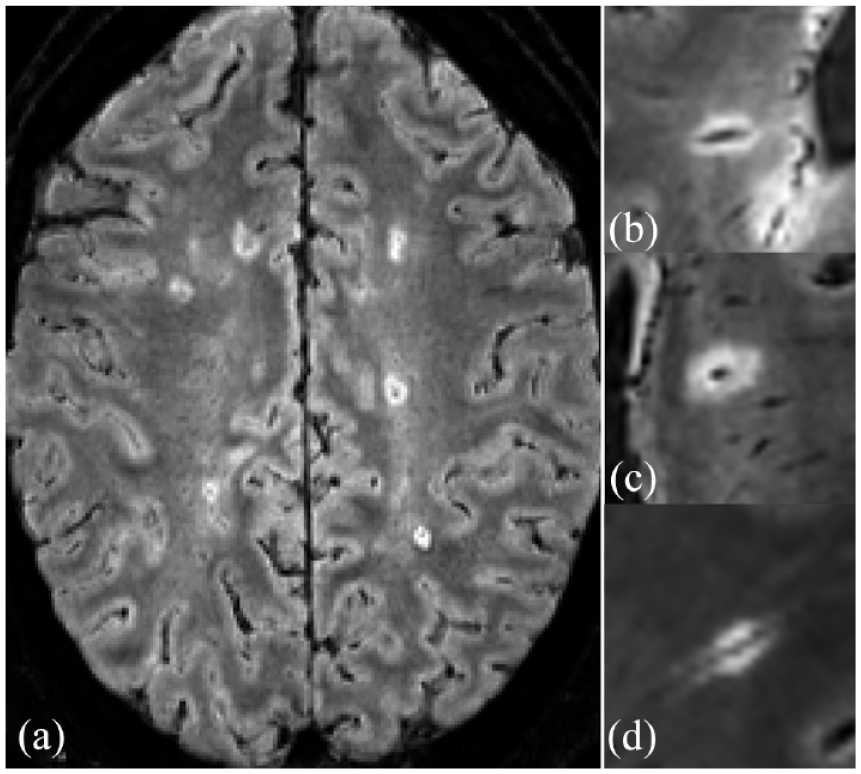
Example of CVS-positive lesions on FLAIR* contrast obtained on different scanners. (a) Axial slice demonstrating multiple CVS+ lesions in a participant with MS; magnified view of representative CVS+ lesions in different participants obtained on (b) Siemens Prisma Fit scanner, (c) Philips Ingenia scanner, and (d) Siemens Skyra scanner.
Diagnostic performance of Select-n* method.
Diagnostic performance of the CVS at different Select-n* thresholds based on the ratings of the 10 site raters using post-Gd FLAIR* imaging.
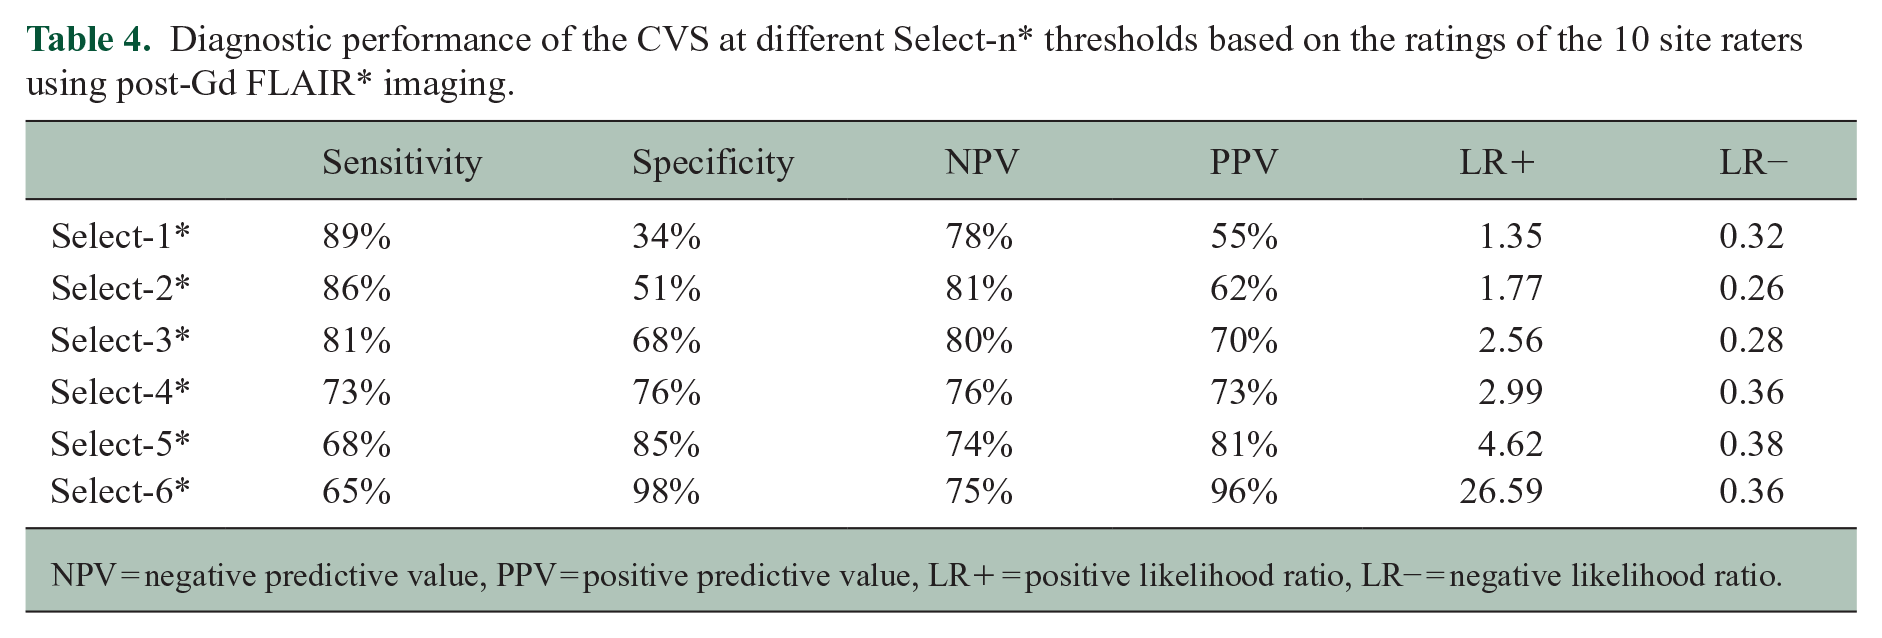
NPV = negative predictive value, PPV = positive predictive value, LR+ = positive likelihood ratio, LR− = negative likelihood ratio.
IRR for Select-3* on the entire cohort between a central rater and site raters demonstrated 78% agreement (Cohen’s Kappa, as a weighted average, was 0.54, indicating moderate agreement). IRR for Select-3* on a subset of 30 participants between two central raters demonstrated 70% agreement (κ = 0.45, indicating moderate agreement). For Select-6*, IRR between a central rater and site raters on the entire cohort was 83% (Cohen’s Kappa, as a weighted average, was 0.59, indicating moderate agreement). IRR for Select-6* on the subset of 30 participants between two central raters demonstrated 83% agreement (κ = 0.62, indicating substantial agreement). See Supplemental Table 3 for further details.
Central rater analysis
Single-rater analysis using the Select-n* method showed an AUROC of 0.81 (90% CI: 0.71–0.90) (Figure 3). With Select-3*, sensitivity was 84% and specificity was 59% for diagnosing MS, with an accuracy of 71%; with Select-6*, sensitivity was 68%, specificity 83%, and accuracy 76%. Youden’s J index was maximized with Select-6*. Diagnostic performance was similar using pre- or post-Gd FLAIR* images (Supplemental Table 4).
For the percentage-based analysis, a total of 5169 white matter lesions were assessed. Of these, 3471 lesions (67%) were excluded from CVS assessment based on NAIMS criteria. 2 The median numbers of CVS-eligible lesions per MRI were 15 (IQR: 22, range 1–100) for MS participants and 14 (IQR: 34.5, range 0–111) for non-MS participants (p = 0.94, Mann–Whitney U test). Of the CVS-eligible lesions, in the MS cohort, 496 (64%) were CVS+, 204 (27%) CVS−, and 71 (9%) CVS-indeterminate. In the non-MS cohort, 108 (12%) lesions were CVS+, 781 (84%) CVS−, and 38 (4%) CVS-indeterminate; see Supplemental Table 5 for details. MS participants had higher CVS+% (median (IQR) 79% (39%)) compared to non-MS participants (12% (39%)) (p < 0.0001, Mann–Whitney U test); see Figure 4. Figure 5 shows the ROC for diagnosing MS using the percentage-based method; the AUROC is 0.90 (95% CI: 0.83–0.97). Using a percentage-based threshold of 40%, sensitivity was 92% and specificity 76%, while when using a percentage-based threshold of 50%, sensitivity was 89% and specificity 80% (see Supplemental Table 6 for comparison of percentage-based vs simplified analysis methods). Using Youden’s J index, diagnostic performance was optimized at a threshold of 43%, with a sensitivity of 92% and specificity of 80%. IRR for classifying WMLs as CVS-positive versus CVS-negative was 87% (κ = 0.73, indicating substantial agreement). IRR for patient-level CVS positivity at the 40% threshold showed 80% agreement (κ = 0.60, moderate agreement).
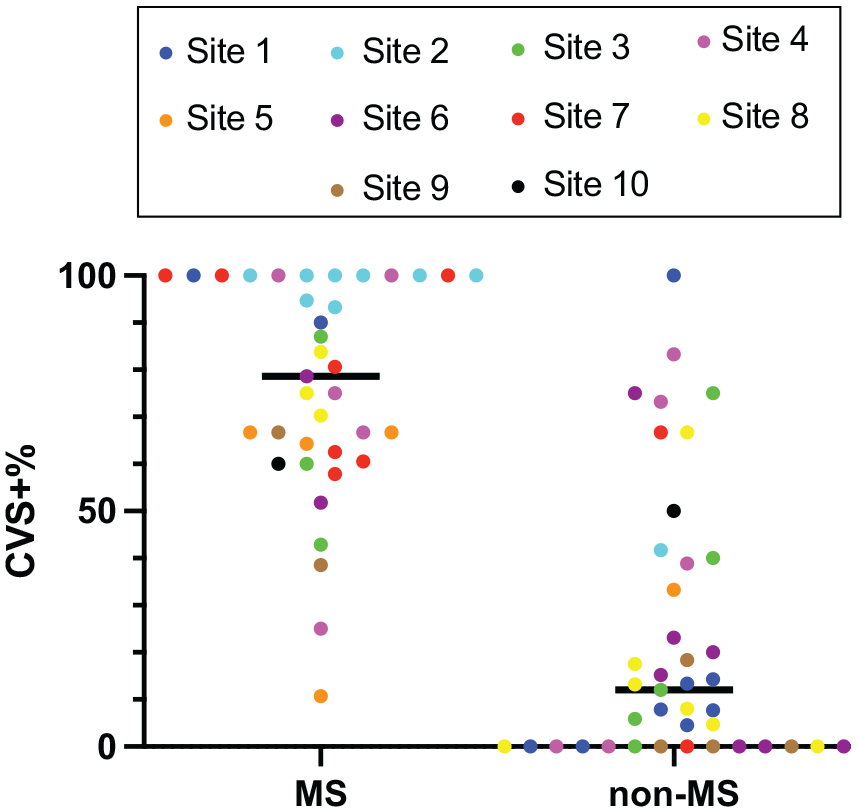
CVS percentage by site and diagnosis.
Diagnostic performance of percentage threshold-based method.
Discussion
The CAVS-MS pilot study was a multicenter study examining real-world performance of the CVS in patients presenting to an MS clinic for the evaluation of MS. The study population at enrollment was a heterogeneous sample reflecting the range of cases referred to MS centers across North America. We used the FLAIR* sequence, which incorporates 3D T2*-weighted and 3D T2-weighted FLAIR images for a single easy-to-use sequence, with optimized sensitivity for the CVS.17,19 We demonstrated feasibility of using FLAIR* across different sites and MRI scanners for simplified CVS rating, addressing a need for standardizing CVS imaging for clinical use. 23 We also compared CVS quantification methods, demonstrating that simplified lesion counting has similar diagnostic performance to percentage-based methods (AUROC of 0.83 vs 0.90), with the advantage of being time-efficient, an important characteristic for clinical utility. IRR was good across sites for simplified CVS rating (83% agreement for Select-6*, with moderate agreement per Cohen’s Kappa), demonstrating clinical feasibility.
The optimal tested threshold was Select-6* with a sensitivity of 65% and a specificity of 98%. With this high specificity, Select-6* could be useful in differentiating MS from mimickers, as it increases the likelihood of an MS diagnosis over 26-fold when positive. Our observed sensitivity for Select-6* was lower than that observed in prior studies, which reported sensitivities as high as 80%. 12 This could be explained by participants in prior studies having more lesions and longer disease duration. The McDonald criteria already have a high sensitivity for MS;9–11 therefore, implementation of a CVS method with high specificity would complement current diagnostic methods.
In comparison to Select-6*, the Select-3* method had a higher sensitivity (82%) but reduced specificity (68%). A previous study by our group in a smaller sample found a similar sensitivity (83%) but higher specificity for Select-3* (81%). 21 Because the acquisition and rating of lesions was similar, this difference in specificity may relate to cohort differences. A recent European multicenter study showed a lower sensitivity of 69% for Select-3*. 24 Some of this difference in sensitivity likely relates to the use of SWI in the European study.19,25 Indeed, when 3D T2*-weighted imaging was analyzed separately in that study, sensitivity for Select-3* was 93%.17,24 In our study, diagnostic performance of the Select-n method was largely unchanged based on Gd usage (Supplemental Table 4), supporting the use of this method in CVS analysis of pre-Gd FLAIR* scans.
Overall, the percentage-based assessment showed that approximately two-thirds of lesions were CVS-positive in MS patients, similar to other published reports. 17 When applying a diagnostic threshold, we found an optimal balance between sensitivity and specificity at around a 40% threshold (43% using Youden’s J index), similar to prior experience.16,19
While replicating findings of smaller, single-center trials,12–15 our current study is unique in investigating participants presenting for a diagnostic investigation for MS. Our findings support the notion that the CVS can be detected at the time of initial presentation, corresponding well to the findings described in radiologically isolated syndrome (RIS). 26 Using this simple, quick CVS assessment as part of the standard MRI for first-time MS evaluation could serve as an adjunct diagnostic. The ability of the CVS to expedite diagnosis was not formally explored here and is a future direction in an ongoing prospective study conducted by our group.
This study provides evidence that implementation of FLAIR* for CVS detection is feasible across sites. Only four studies were rejected due to image artifacts, and overall image quality was high. Acquisition times were clinically feasible with combined scan duration for FLAIR and T2*-weighted imaging of approximately 12 minutes. Future directions include a larger multicenter longitudinal prospective study (U01NS116776-02, NCT04495556), which aims to provide additional evidence on CVS performance in diagnosing MS while evaluating both simplified and emerging automated methods of CVS detection.27,28
Our study has several limitations. While counting-based CVS quantification performed well in this cohort compared to percentage-based methods, there may be certain populations for whom these methods work less well. Our cohort had few vasculopathies, and prior work had demonstrated that percentage-based thresholds performed better in distinguishing MS from inflammatory CNS vasculitides. 12 Furthermore, our study only included patients referred to an academic center for possible MS; more atypical/challenging cases are likely referred to these centers, limiting generalizability to the broader MS patient population. Another limitation to generalizability is exclusion of patients prescribed DMTs; though intended to exclude patients later in the disease course, it may bias toward selection of patients with lower T2 lesion loads. In addition, though some MS patients at disease onset do not yet have brain MRI lesions, we did include brain lesions as a requirement for enrollment, given the aim of this study to analyze the CVS.
Of note, the inter-rater agreement was not perfect; it was rated as moderate by Cohen’s kappa. In deploying the CVS clinically, ensuring homogeneity of CVS interpretation by clinicians will be important. Automated methods, not explored in this study, could be helpful tools for time-efficient, homogeneous CVS evaluation. 29 In addition, our study only examined dedicated 3D T2*-weighted imaging at 3T; this may not be available at all sites. Dedicated studies comparing SWI and T2*-weighted imaging for CVS detection are needed, which will be evaluated in the CAVS-MS study. 27 Finally, median time from symptom onset to presentation to an MS center in this study was long; this is unfortunately representative of current dynamics given ongoing neurologist shortages (in previous studies, the delay to see an MS-trained neurologist in various countries ranges from 7 months to 3.9 years).30–33 We did not place artificial restraints on time from symptom onset to enrollment, to allow the study to reflect real-world CVS utilization.
In conclusion, this multicenter pilot study demonstrates the feasibility of using the CVS in a real-world setting. This work demonstrates that simplified CVS methods rated by neurologists can accurately discriminate MS cases from non-MS cases in a cohort of patients newly referred to an MS center. The Select-6* method demonstrated high specificity for MS; future work will aim to establish if its use can aid in more accurately diagnosing MS.
Supplemental Material
sj-docx-1-msj-10.1177_13524585231214360 – Supplemental material for A multicenter pilot study evaluating simplified central vein assessment for the diagnosis of multiple sclerosis
Supplemental material, sj-docx-1-msj-10.1177_13524585231214360 for A multicenter pilot study evaluating simplified central vein assessment for the diagnosis of multiple sclerosis by Lynn Daboul, Carly M O’Donnell, Moein Amin, Paulo Rodrigues, John Derbyshire, Christina Azevedo, Amit Bar-Or, Eduardo Caverzasi, Peter A Calabresi, Bruce AC Cree, Leorah Freeman, Roland G Henry, Erin E Longbrake, Jiwon Oh, Nico Papinutto, Daniel Pelletier, Vesna Prchkovska, Praneeta Raza, Marc Ramos, Rohini D Samudralwar, Matthew K Schindler, Elias S Sotirchos, Nancy L Sicotte, Andrew J Solomon, Russell T Shinohara, Daniel S Reich, Pascal Sati and Daniel Ontaneda in Multiple Sclerosis Journal
Footnotes
Acknowledgements
The authors thank the Race to Erase MS, the North American Imaging in MS Cooperative, the National Institute of Neurological Disorders and Stroke, and the National Institutes of Health Medical Research Scholars Program for providing the funding and support for this investigation.
Declaration of Conflicting Interests
The author(s) declared the following potential conflicts of interest with respect to the research, authorship, and/or publication of this article: L.D., C.M.O.D, M.A., J.D., E.C., P.Ra., and M.K.S. have declared no conflicts of interest. P.Ro. employed by and holds stocks in QMENTA. C.A. received consulting fees for scientific advisory boards for Genentech, EMD Serono, Alexion Pharmaceuticals, and Sanofi Genzyme. A.B.O. has received personal fees for advisory board participation and consulting from Abata, Accure, Atara Biotherapeutics, Biogen, BMS/Celgene/Receptos, GlaxoSmithKline, Gossamer, Horizon Therapeutics, Immunic, Janssen/Actelion, Medimmune, Merck/EMD Serono, Novartis, Roche/Genentech, Sangamo, Sanofi Genzyme, Viracta; and grant support to the University of Pennsylvania from Biogen Idec, Roche/Genentech, Merck/EMD Serono, and Novartis. P.A.C. is a PI on grants to JHU from Biogen and Annexon and served on scientific advisory boards for Disarm Therapeutics and Biogen. B.A.C.C. received compensation for consulting from Alexion, Atara, Biogen, EMD Serono, Novartis, Sanofi, and TG Therapeutics. L.F. received fees for consultancy and advisory board participation from Genentech, Novartis, Celgene/Bristol Myers Squibb, EMD Serono, and TG Therapeutics; received fees for educational activities from Medscape, LLC, and the MS Association of America; program sponsorship to UT from EMD Serono; and grant support to UT from NIH/NINDS, PCORI, Genentech, and EMD Serono. R.G.H. received research support from Roche, Genentech, Atara, and MedDay and consulting for Novartis, Sanofi/Genzyme, Roche/Genentech, QIA, and Neurona. E.E.L. received research support from Genentech, Biogen and consulting for Genentech, Janssen, TG Therapeutics, NGM Bio, Bristol Myers Squibb, and EMD Serono. J.O. received research support from Biogen Idec, Roche, and EMD Serono; consulting compensation from EMD Serono, Sanofi/Genzyme, Biogen Idec, Roche, Celgene, and Novartis. N.P. received research support from the Race to Erase MS Foundation. D.P. received consulting compensation from EMD Serono, Sanofi Genzyme, Roche, and Novartis. V.P. employed by and holds stocks in QMENTA. M.R. employed by and holds stock options in QMENTA. R.D.S. received fees for advisory board participation (Biogen, EMD Serono, Sanofi Genzyme) and consulting (EMD Serono, Biogen). E.S. received fees for scientific advisory boards and consulting for Alexion, Viela Bio, Horizon Therapeutics, Genentech, and Ad Scientiam; speaking honoraria from Alexion, Viela Bio, and Biogen. N.L.S. received research support from the National Institutes of Health, National Multiple Sclerosis Society, Patient-Centered Outcomes Research Institute, Race to Erase MS Foundation, and Biogen Idec. A.J.S. received fees for consulting: Greenwich Biosciences, Horizon Therapeutics, Kiniksa Pharmaceuticals, Octave Bioscience, TG Therapeutics; non-promotional speaking: EMD Serono; research funding: Bristol Myers Squibb; contracted research: Sanofi, Novartis, Actelion, Genentech/Roche. R.T.S. supported NIH R01NS112274, R01MH112847, and R01MH123550 and received consulting income from Octave Bioscience. D.S.R. supported by the Intramural Research Program of NINDS; received additional research support from Vertex Pharmaceuticals, Sanofi Genzyme, and Abata Therapeutics. P.S. received research support from the National Institutes of Health and the National Multiple Sclerosis Society. D.O. received research support from the National Institutes of Health, National Multiple Sclerosis Society, Patient-Centered Outcomes Research Institute, Race to Erase MS Foundation, Genentech, Genzyme, and Novartis; consulting fees from Biogen Idec, Genentech/Roche, Genzyme, Novartis, and Merck.
Funding
The author(s) disclosed receipt of the following financial support for the research, authorship, and/or publication of this article: We thank the Race to Erase MS Foundation, The North American Imaging in MS Cooperative, the National Institute of Neurological Disorders and Stroke, and the National Institutes of Health Medical Research Scholars Program for providing funding and support for this investigation.
ORCID iDs
Supplemental Material
Supplemental material for this article is available online.
References
Supplementary Material
Please find the following supplemental material available below.
For Open Access articles published under a Creative Commons License, all supplemental material carries the same license as the article it is associated with.
For non-Open Access articles published, all supplemental material carries a non-exclusive license, and permission requests for re-use of supplemental material or any part of supplemental material shall be sent directly to the copyright owner as specified in the copyright notice associated with the article.