
Abstract
Background:
The MS disease-modifying therapies (DMTs) prescribing landscape in Australia have changed over time.
Objectives:
This study evaluated the utilisation and cost trends of MS-related DMTs in Australia over 10 years and investigated differences between States/Territories.
Methods:
The prescription and costs of 16 DMTs were extracted from the Pharmaceutical Benefits Scheme for 2013–2022. Descriptive approaches analysed the total number of people prescribed DMTs and total DMT costs per 10,000 population, proportions of prescriptions/costs by DMT groups and the number of people prescribed each individual DMT and costs of each DMT over the 10-year period. All estimates were for Australia and each State/Territory individually.
Results:
The number of people prescribed DMT and costs per 10,000 population had substantial growth between 2013 and 2022: 125%/164% for Australia, and 94%–251%/129%–373% for individual States/Territories. Higher efficacy group accounted for 54% of total people prescribed DMTs in 2013 and 75% in 2022. Fingolimod was the most popular DMT until 2020, then was dominated by ocrelizumab. The trends of individual DMT prescriptions and costs differed between states particularly in Western Australia (WA), Tasmania and Northern Territory (NT).
Conclusion:
DMT prescriptions and costs continuously increased over the last decade, particularly for higher efficacy DMTs, and their trends differed between States/Territories.
Introduction
Multiple sclerosis (MS) is an inflammatory/neurodegenerative disease of the central nervous system (CNS) leading to increasing disability over time with subsequent reduction in health-related quality-of-life and increased costs. 1 The global prevalence of MS has increased by 500,000 people to 2.8 million people from 2013 to 2020, 2 and in Australia, MS prevalence increased by 30% over 2017–2021 to 33,335 people. 3 Currently, no treatment is available to cure or reverse the progression of disability accumulation in MS, but many clinical trials have shown that disease-modifying therapies (DMTs) effectively reduce the relapse rate and severity of MS with some reported to show positive effects on slowing MS disability progression. 4 DMTs, also called immunotherapies, work by modifying the activity of the immune system to slow the frequency and severity of attacks to the CNS. The first DMT in Australia was interferon beta-1b that was introduced in 1996. Since then, the availability of DMTs has steadily grown, with Australia among the world leaders in terms of accessibility to the largest range of DMTs. 5 While some of the early-generation interferons are being gradually withdrawn from the Australian market, new medications are continuously being approved and subsidised by the Australian Government. By December 2022, 16 DMTs were listed on the Australian Government’s subsidised medicine formulary – the Pharmaceutical Benefits Scheme (PBS). All the listed DMTs are to manage relapsing–remitting MS except one (siponimod) that is specifically aimed at secondary-progressive MS. 6
Based on their clinical efficacy and administration route, currently available DMTs are commonly categorised into three groups:7,8 Group 1: classical injectable DMTs (β-interferons and glatiramer acetate); Group 2: moderate efficacy DMTs (dimethyl fumarate, teriflunomide and diroximel fumarate); and Group 3: higher efficacy DMTs (ofatumumab, natalizumab, alemtuzumab, ocrelizumab, fingolimod, cladribine, siponimod and ozanimod). Treatment decision-making among different DMTs is influenced by many factors, including the applicable clinical guidelines, MS patient profiles (e.g. their sociodemographic, clinical, biological and neuroradiological prognostic features, preferences and lifestyles), neurologists’ profile and access restrictions to specific DMTs often imposed by reimbursement bodies due to economic or safety concerns. 9
Currently, two different treatment approaches are common: (1) escalation therapy, commencing with a modestly effective initial agent and substituting with a more efficacious medication in cases of disease progression; and (2) induction therapy, starting with a high-efficacy treatment and stepping back to lower efficacy treatment options following a period of disease stability. 9 Recently, increasing evidence suggested the early initiation of high-efficacy DMTs may have a beneficial long-term impact on disease progression in MS patients9,10 which may have consequences for the shift of existing DMT usage landscape. We therefore aimed to investigate the nature and extent of differences in MS DMT utilisation patterns and costs in Australia in the last 10 years and to assess the differences between Australian States/Territories. Our findings will help healthcare decision makers in standardising the use of DMTs across Australia and in understanding the associated economic impacts.
Methods
Under the Australian PBS system, the subsidised DMTs are readily accessible to all eligible residents and citizens, including those from countries with reciprocal healthcare agreements. Patients with a current Medicare (the publicly funded universal healthcare insurance scheme in Australia) card can access PBS-listed DMTs. The cost of a medicine is negotiated between the federal government and the supplier of the medicine. While there are patient out-of-pocket costs associated with PBS prescriptions, these costs vary based on factors such as the medication’s pricing category under the PBS and the patient’s specific circumstances. There are two main categories of patient co-payments: general patient co-payment, which is the amount non-concessional patients are required to pay for each prescription, and concessional patient co-payment, which is the amount payable by those holding a valid concession card, such as a Pensioner Concession Card, Health Care Card or Department of Veterans’ Affairs Card. As of 2022, the co-payment for general patients was $42.50, while for concessional patients was $6.80 per prescription. Moreover, safety net thresholds are in place to assist patients with high medication expenses. Once these thresholds are reached, further reductions in co-payments apply. As of 1 January 2022, the general patient safety net threshold was set at $1542.10 annually, while the concessional patient threshold was $326.40. Upon reaching the safety net thresholds, general patients pay for further PBS prescriptions at the concessional co-payment rate and concessional patients are dispensed PBS prescriptions at no further charge for the remainder of that calendar year. 11 The patient contribution rates are usually adjusted on 1 January each year. The Australian Government Department of Health publishes online the monthly PBS Schedule Item Statistics Reports containing the PBS prescription volumes and associated government expenditures. 12 We obtained the prescription data and government costs of 16 DMTs from 1 January 2013 to 31 December 2022, for all Australian States and Territories. Population data were extracted from the Australian Bureau of Statistics, and the June estimates were used for each year.
Most DMTs are prescribed monthly, while ocrelizumab is prescribed twice a year, cladribine is prescribed twice a year for 2 years and alemtuzumab is prescribed once a year for 2 years. To account for the difference in prescription frequency, the annual prescription volumes of monthly prescribed DMTs were divided by 12, volumes of cladribine and ocrelizumab were divided by 2 and alemtuzumab volume was divided by 1, to approximate the number of people prescribed each DMT per year. The original reported government expenditures were used for the analyses to reflect the economic burden of DMTs to the government. A descriptive approach was used to summarise the DMT prescription and costs trends over the last 10 years. We calculated (1) the number of people with DMT prescriptions and DMT costs (both per 10,000 population per annum) and changes in these parameters from 2013 to 2022; (2) the proportions of people receiving DMT prescriptions and costs of each DMT group for each year; and (3) the annual number of people receiving prescriptions and costs by individual DMTs. We did the analyses for Australia overall, as well as for each Australian State and Territory separately.
Results
DMT prescription
Figure 1 shows the total number of people prescribed DMTs per 10,000 population in Australia and by State/Territory over 10 years. The number of people with DMT prescriptions increased rapidly from 2013 to 2015, stabilised between 2015 and 2018 and gradually increased thereafter. The number of people with DMT prescriptions per 10,000 population exhibited a general increase in all Australian States and Territories over time, with the states of Tasmania (TAS), Victoria (VIC) and South Australia (SA) showing relatively higher numbers. The Northern Territory (NT) had the lowest number of people prescribed DMTs per 10,000 population over 10 years. The growth rate of people prescribed DMTs from 2013 to 2022 in Australia was 125% (from four per 10,000 population to eight per 10,000 population). Australia Capital Territory (ACT) experienced the largest growth over 10 years (251%), followed by NT (163%) and New South Wales (NSW) (141%) (Supplement Table S1).
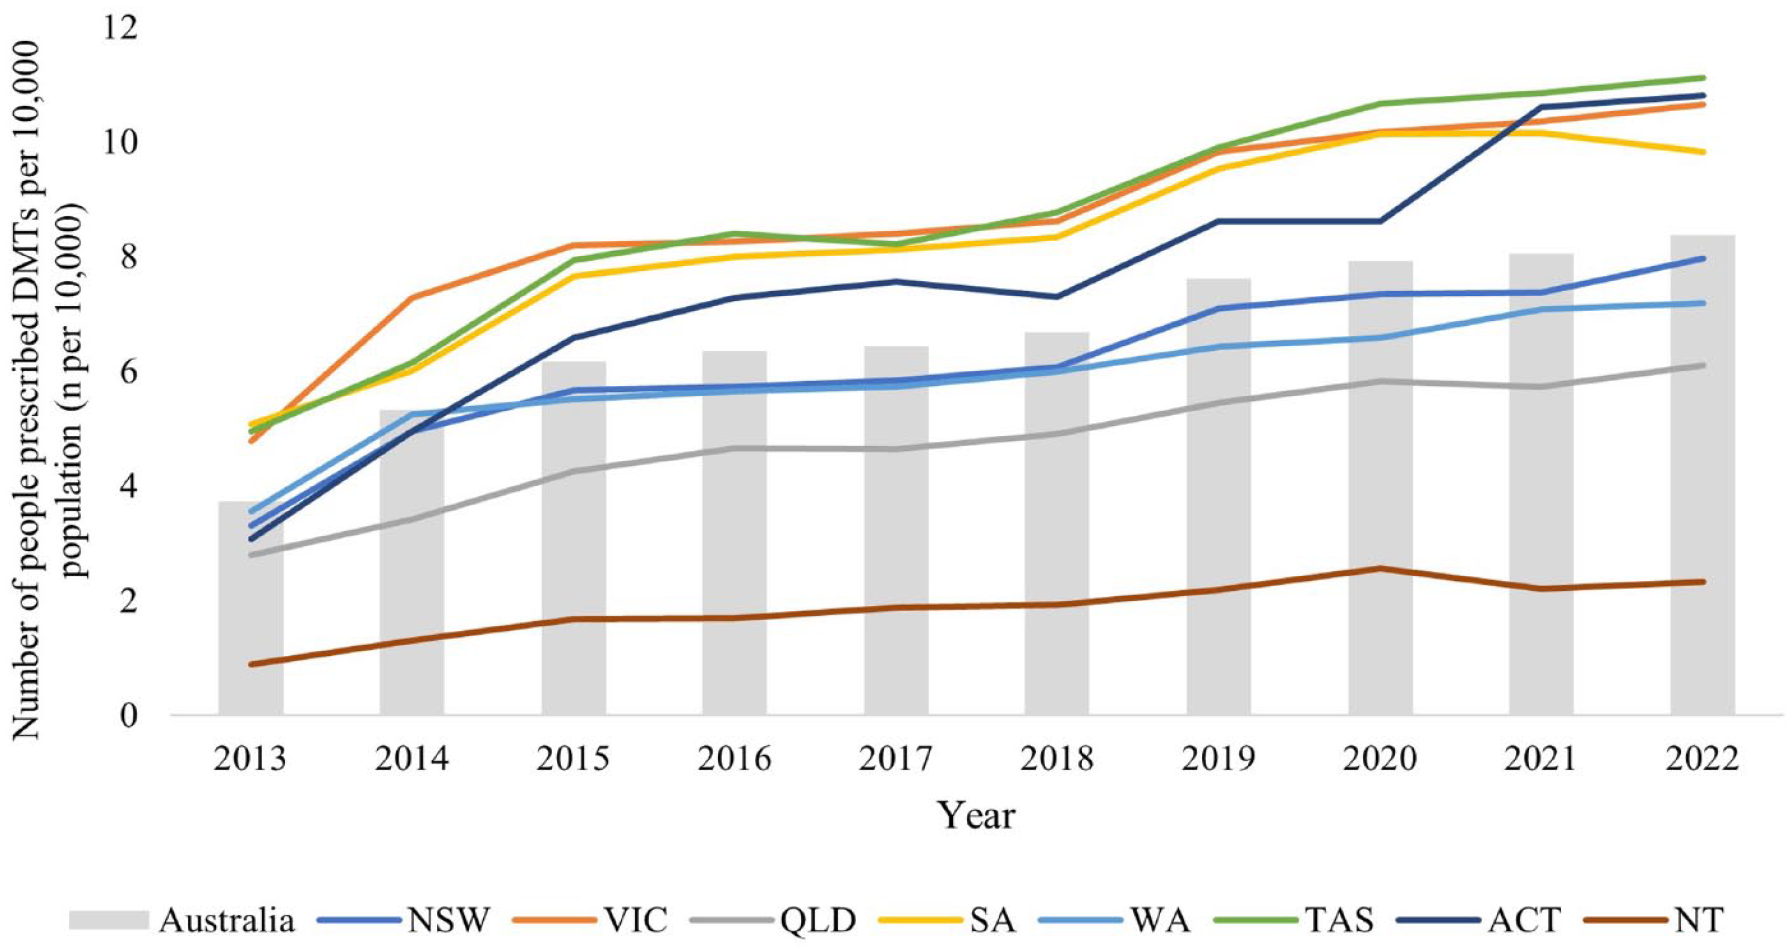
The number of people with DMT prescriptions per 10,000 population in Australia and each States/Territories.
Figure 2 shows the proportions of people prescribed DMTs between 2013 and 2022 by DMT groups. In 2013, Group 3 accounted for 54% of total number of people prescribed DMTs, and its share continuously increased thereafter and reached 75% in 2022. Group 1 accounted for 46% in 2013, which continuously decreased over the 10 years and reached 10% in 2022. Group 2 DMTs were listed on PBS from 2013, with their proportion increasing in the following 2 years then decreasing gradually, but still exceeded Group 1 from 2018. The trends of the prescription proportions by DMT group were similar in most Australian States and Territories, but the timepoint at which Group 2’s popularity exceeded that of Group 1 varied (Supplement Table S2). For instance, Group 2 DMTs dominated Group 1 the earliest in Western Australia (WA) in 2015, followed by VIC (2017), NSW (2018), TAS (2020), Queensland (QLD, 2021) and SA (2022). Group 2 still had a lower prescription proportion than Group 1 in the ACT and NT even in 2022.
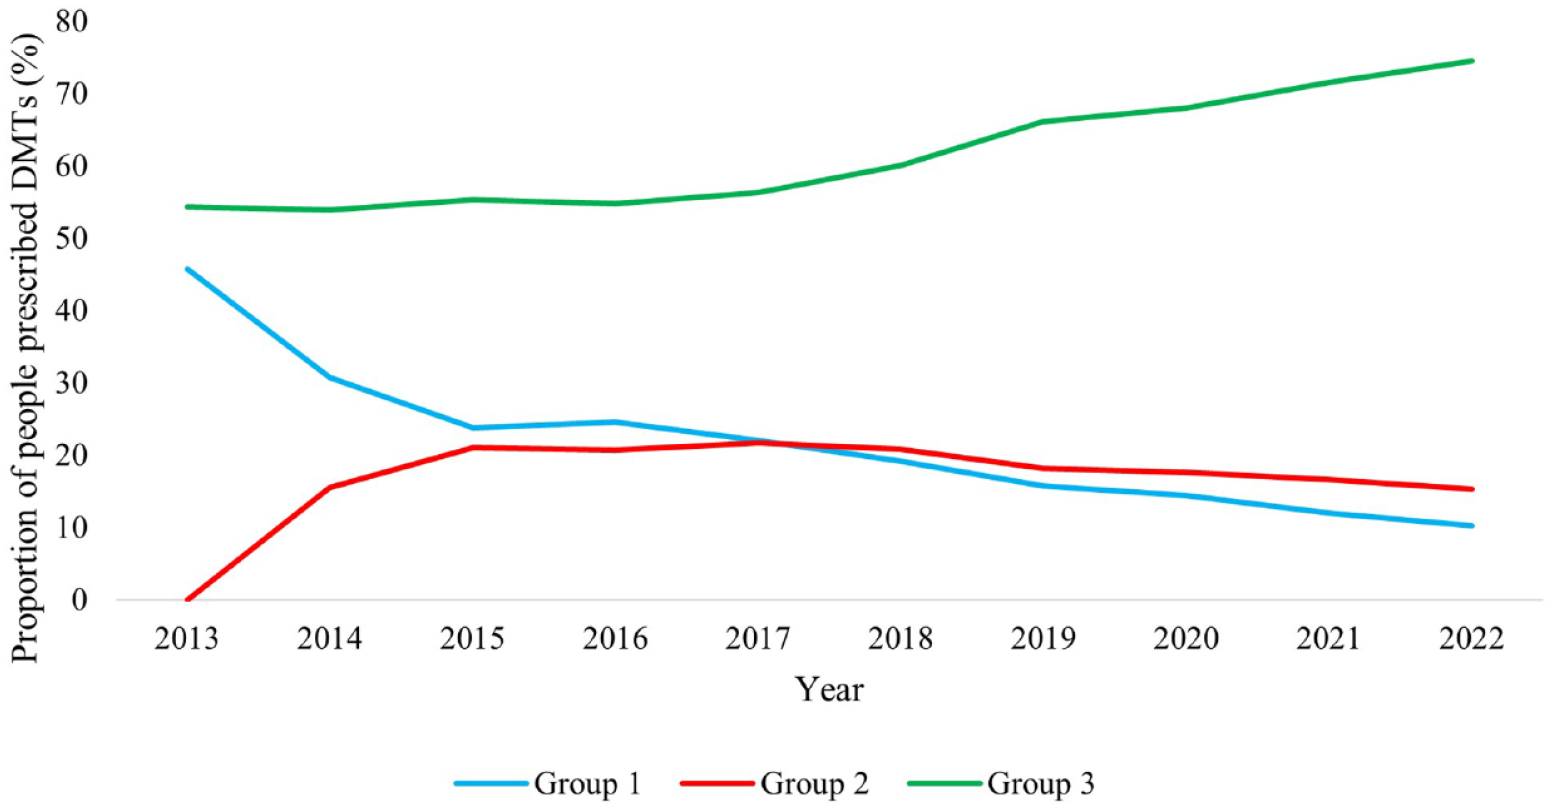
The trends of proportions of people prescribed DMTs by DMT groups between 2013 and 2022 in Australia.
Figure 3 shows the annual number of people prescribed individual DMTs in Australia over the last 10 years. Fingolimod was the most used DMT until 2020, with the number of people prescribed with fingolimod increasing between 2013 and 2015, then declining gradually thereafter. The prescription of ocrelizumab exceeded fingolimod after 2020. By 2022, the top 3 commonly prescribed DMTs were ocrelizumab, fingolimod and natalizumab. The trends of individual DMT prescriptions were largely similar in most of the States/Territories except in WA, TAS and NT (Supplement Figures S1a–1h). In WA, fingolimod was the most prescribed DMT before ocrelizumab became available, but the differences in the number of people using fingolimod and other DMTs were smaller than other States/Territories. The number of people with ocrelizumab prescriptions exceeded fingolimod shortly after the introduction of ocrelizumab in 2018. By 2021, ocrelizumab and natalizumab became the top 2 most used DMTs in WA. In TAS, natalizumab was more frequently prescribed than fingolimod over 10 years, and the number of people with ocrelizumab prescriptions was far more than other DMTs after 2018 compared with other States/Territories. In NT, fingolimod was the most frequently prescribed DMT over 10 years though its prescription started declining after 2018.
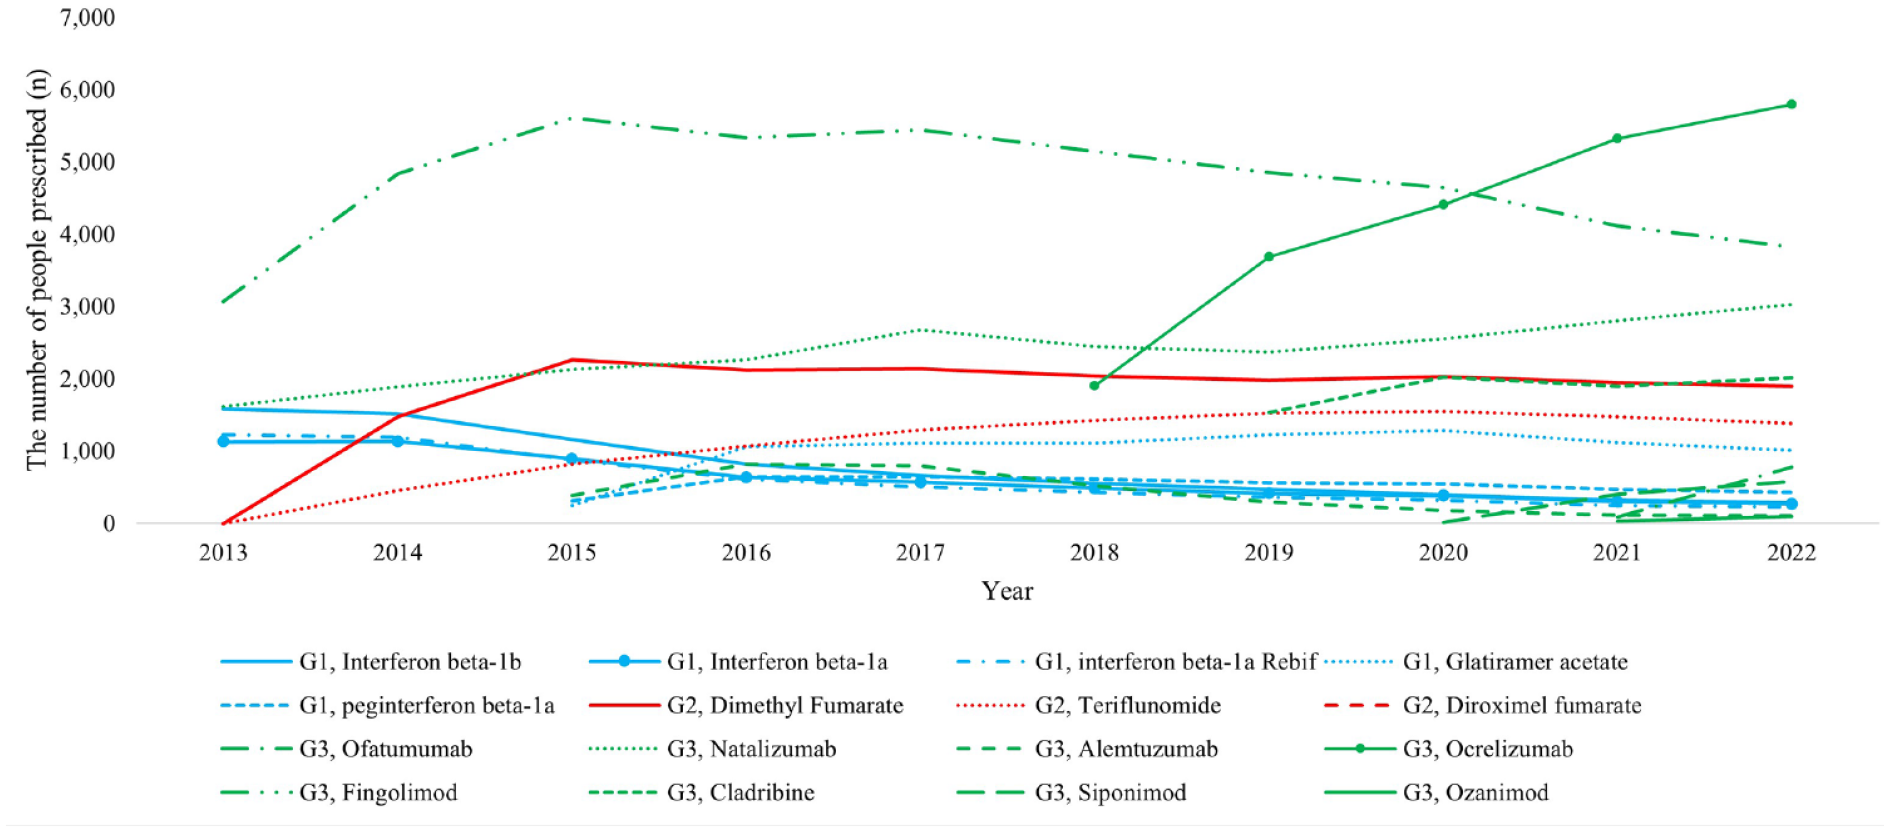
The annual number of people prescribed individual DMTs in Australia.
DMT government costs
During 2013–2022, the annual total DMT costs to the Australian government continuously increased from $173,876,822 to $515,782,763, with the annual costs per 10,000 population increasing by 164% from $75,180 to $198,407. The DMT costs per 10,000 population were higher in TAS, VIC and SA (Figure 4). They increased continuously in all states, but the ACT experienced the highest increases from 2013 to 2022 (373%), followed by NT (249%) and TAS (218%) (Supplement Table S3).
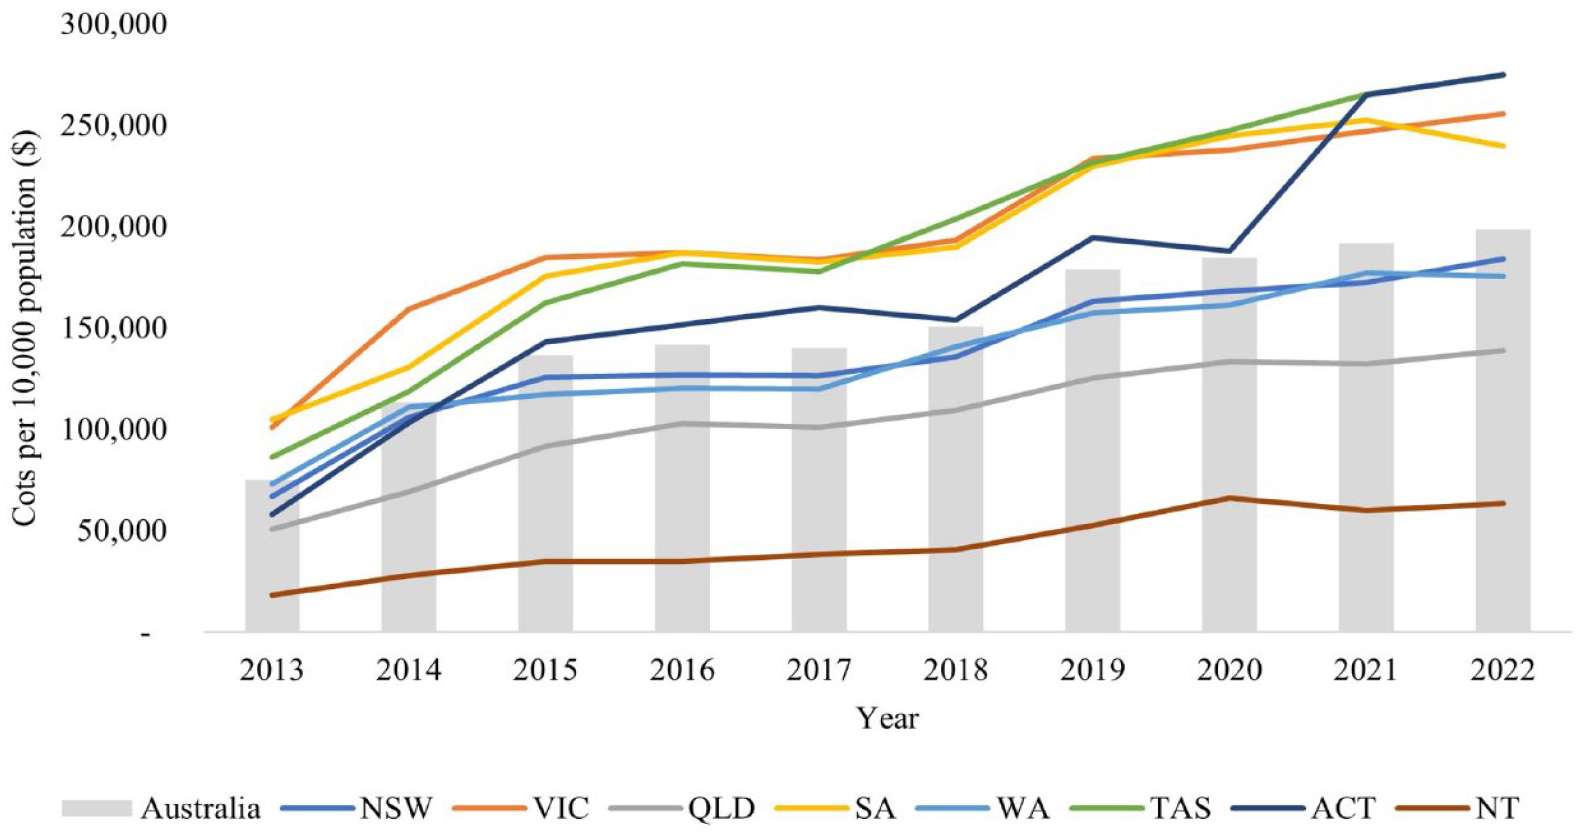
Annual DMT costs incurred by the government per 10,000 population in Australia and for individual States/Territories.
Figure 5 shows the proportional costs of three DMT groups between 2013 and 2022. In 2013, the costs of Group 3 accounted for 71% of total costs and sustained until 2018 and then increased gradually to 91% at 2022. Group 1 accounted for 29% of total DMT costs in 2013, which continuously decreased and reached 4% in 2022. The costs of Group 2 exceeded Group 1 at 2015 but declined gradually from 2018 and reached similar level in 2022. The cost proportion of three DMT groups exhibited similar trends in all States/Territories, except in NT where the cost proportion of Group 2 remained lower than Group 1 throughout (Supplement Table S4).
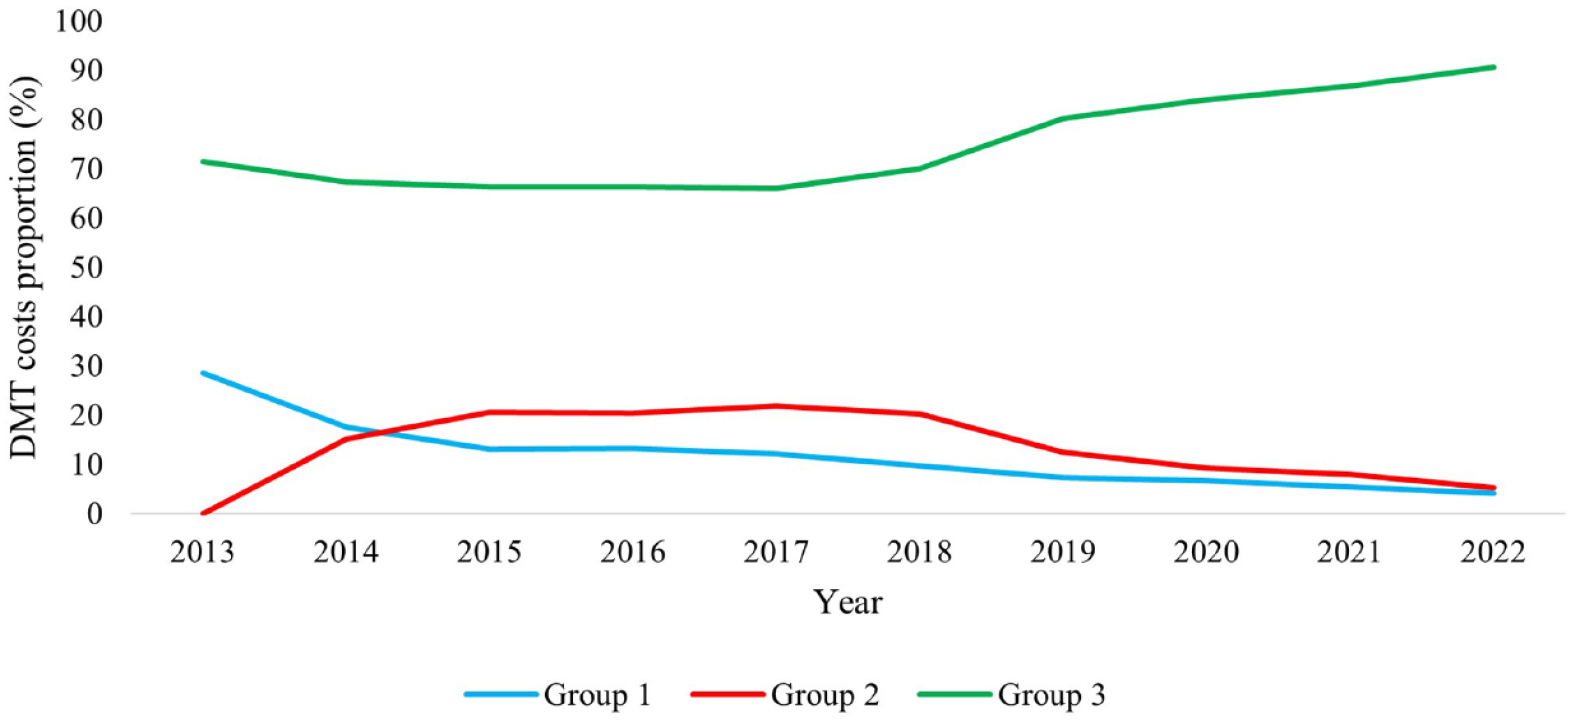
The trends in costs proportion by DMT groups between 2013 and 2022.
Figure 6 shows the annual total cost burden of individual DMTs in Australia between 2013 and 2022. Fingolimod had the highest costs in 2013 and its costs increased until 2015 and then started declining. The costs of ocrelizumab exceeded those of fingolimod in 2020 and continued increasing. By 2022, the top 3 costs of DMTs were for ocrelizumab, fingolimod and cladribine. The trends of individual DMT costs were largely similar in most States/Territories except in WA, TAS and NT (Supplement Figure S2a–2h). In WA, fingolimod had the highest costs before ocrelizumab became available, but the differences in costs between fingolimod and other DMTs were smaller than in other States/Territories. The costs of ocrelizumab exceeded fingolimod shortly after 2018 when it became available. By 2022, the top 3 costs of DMTs in WA were for ocrelizumab, fingolimod and natalizumab. In TAS, the costs of ocrelizumab surged in 2 years and had much higher costs than other DMTs after 2020. By 2022, the top 3 costs of DMTs in TAS were for ocrelizumab, cladribine and natalizumab. In NT, the costs of fingolimod were highest before ocrelizumab and cladribine were introduced, then it was exceeded by ocrelizumab and cladribine in 2020, but the differences on costs between fingolimod, ocrelizumab and cladribine were much smaller than other States/Territories.
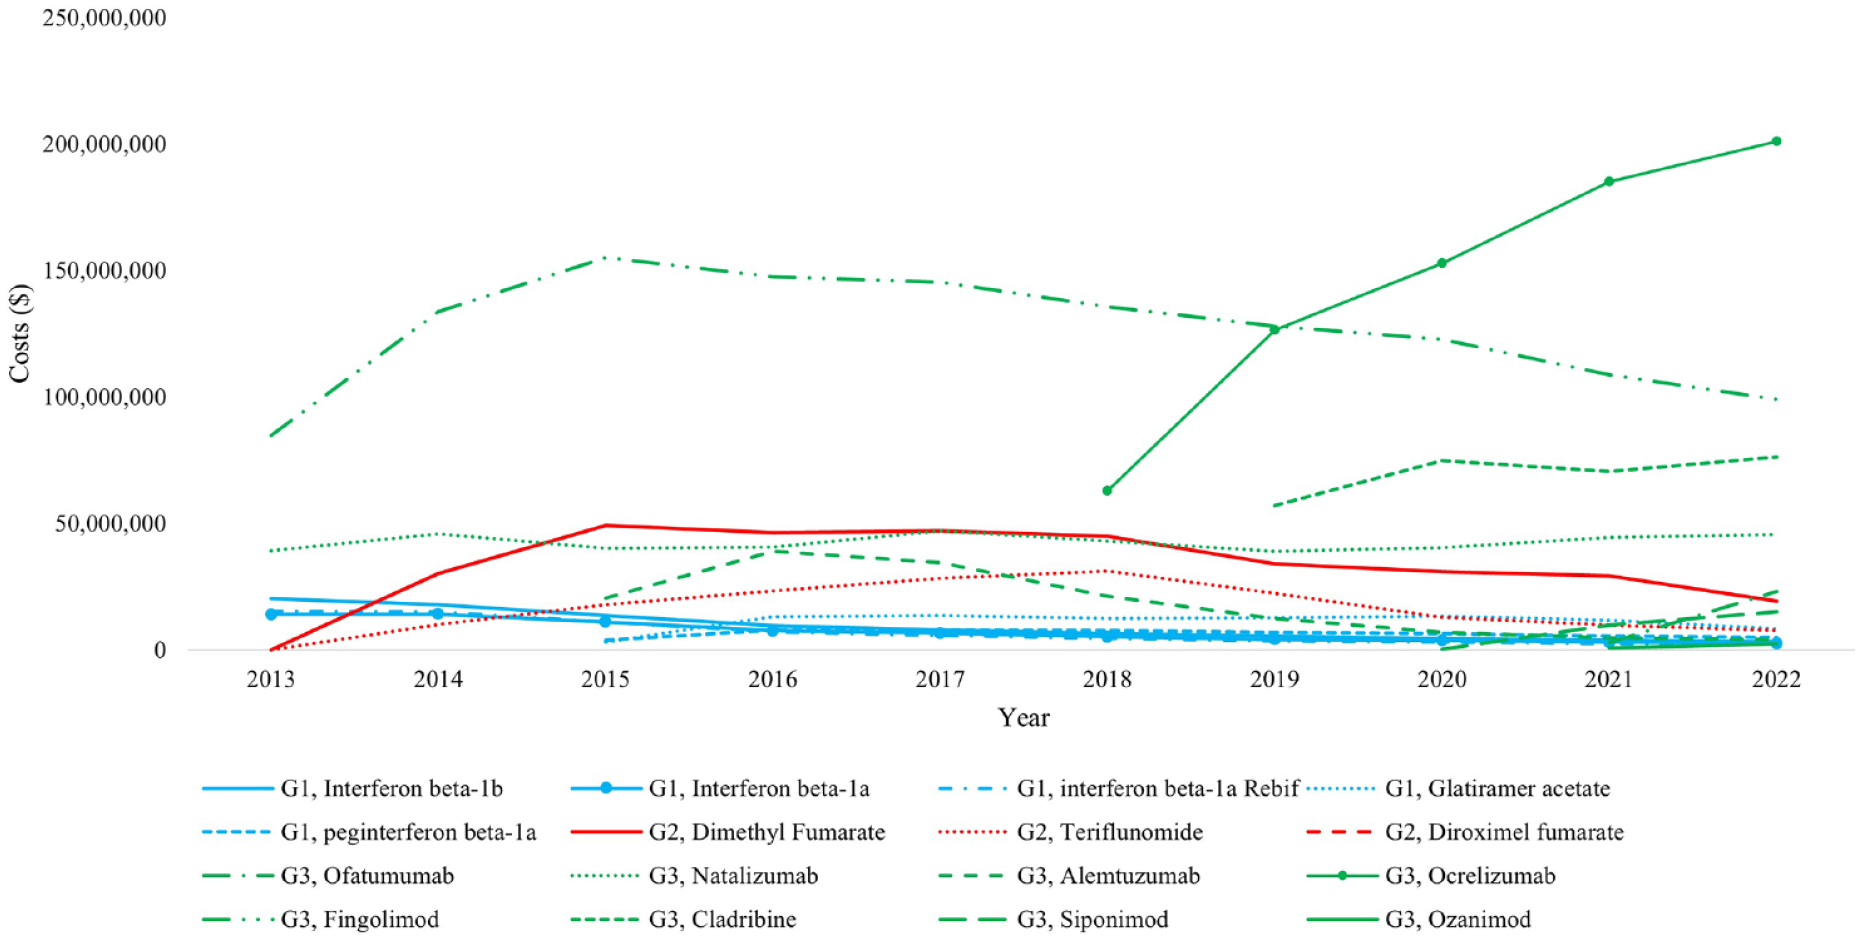
The annual total cost of individual DMTs in Australia.
Discussion
The number of people prescribed MS DMTs and the DMT costs continuously increased in Australia over the last decade, particularly for Group 3 DMTs. The total number of people prescribed DMTs per 10,000 population increased by 125%, with the total DMT costs per 10,000 population increased by 164% in the same period. While the overall increasing utilisation trend of DMTs was similar in all States/Territories, the detailed patterns varied in terms of total, group and individual DMTs which may indicate differences in DMT selection practices by prescribers and patients. The growth rates in the number of people prescribed DMTs differed between States/Territories, resulting in subsequent differences in the growth rates of DMT costs. ACT experienced the largest growth in both the number of people prescribed DMTs (251%) and costs (373%). In terms of DMT groups, the prescription of higher efficacy (Group 3) DMTs continuously increased over 10 years and accounted for 75% of total people prescribed DMTs and 91% of total DMT costs in 2022, whereas the classical injectable (Group 1) DMTs and moderate efficacy (Group 2) DMTs both experienced declining prescribing rates. The timepoint when the proportion of people with Group 2 prescription exceeded Group 1 varied between States/Territories and occurred earliest in WA. Fingolimod was the most common individual DMT until 2020, after which it was exceeded by ocrelizumab. The same pattern was seen in most States/Territories except in WA and TAS where the number of people prescribed ocrelizumab dominated other DMTs much earlier.
The total number of people with DMT prescriptions in Australia continuously increased over the last 10 years, with subsequent higher total DMT costs to the government, which is in alignment with other studies from Australia and other countries.5,13,14 The main attributes of the increasing prescription trend may include increasing incidence and prevalence of MS stemming from the changes in risk factors and the expansion of diagnostic criteria,15–17 a greater variety of available DMT options and better accessibility to subsidised DMTs. 18 As a result of the increasing prescriptions, the total costs that the Australian Government paid for DMTs increased. However, the growth rate of costs (164%) was much greater than that of the number of people prescribed DMTs (125%). This could be a consequence of the increasing prices of some of the existing DMTs but is mainly due to the introduction of newer and more expensive Group 3 DMTs. 19 For example, the monthly costs per unit of ofatumumab are 3 times higher than the interferon beta-1b. Nevertheless, the greater availability of higher efficacy DMTs may associate with lower indirect costs of MS, by allowing people with MS to stay longer and be more productive in the workforce, 15 as well as lead to decreased direct costs by reducing hospitalisation rates and slowing the progression of disability.20,21 It is also worth to note that the private spending was not included in this analysis. However, due to universal coverage of medications listed on the PBS, apart from co-payments up to defined safety net thresholds, there is a negligible private expenditure on registered medications in the Australian healthcare setting. When comparing the total number of people prescribed DMTs and cost trends by States/Territories, TAS, VIC and SA had higher prescription and costs during 2013–2022, but ACT and NT recorded the fastest growth. Previous literature has shown significant impacts of remoteness on the use of DMTs. 22 However, with the increasing use of digital healthcare technologies in MS management, 23 the impact of remoteness barrier is likely to have diminished, which may explain the high growth rate of DMT prescription volumes in the NT recently, where much of the state is considered very remote.
Higher efficacy (Group 3) DMTs were predominantly prescribed in Australia in the last 10 years, especially after 2018 when the proportion of people prescribed it started rapidly increasing. In comparison, classical injectable (Group 1) DMTs were gradually replaced, especially during 2013 to 2015, the 2 years when moderate-efficacy (Group 2) DMTs were newly listed on the PBS. By 2018, the proportion of Group 2 DMTs exceeded Group 1 DMTs. The increasing trend of Group 3 DMTs and decreasing trend of Groups 1 and 2 DMTs in recent years may be explained by new research findings, suggesting the positive impacts of the early use of high-efficacy DMTs on significantly reducing the inflammatory activity and slowing/halting disease progression.9,10,24 The shifting trend from classical injectable DMTs to Group 2 oral DMTs aligns with previous studies.13,14,25 The cause of this shift may include convenience of administration, better efficacy and the consideration of safety profile, dosage and medicine adherence.8,26,27 However, there was a significant inter-state/territory variation on how long it took Group 2 DMTs to become more frequently prescribed than Group 1. For example, the prescription proportion of Group 2 DMTs exceeded Group 1 earliest in WA in 2015, but in the ACT and NT, Group 2 prescription was less than Group 1 till December 2022. A complete understanding of the factors driving this time variation will be helpful in medication and clinical guideline promotion and hence the better management of MS. However, our study was not able to identify the relevant factors; hence, we recommend future research to investigate the possible causes of observed variations in the DMT utilisation patterns across Australia and internationally.
Fingolimod was the most used DMT in Australia until 2020 and then was exceeded by ocrelizumab. By 2022, the top 3 commonly prescribed DMTs were ocrelizumab, fingolimod and natalizumab, while the top 3 DMTs with most government costs were ocrelizumab, fingolimod and cladribine. The discrepancy where cladribine, rather than natalizumab, ranks as the third most expensive DMT can be primarily attributed to significant price differences between the two drugs. Specifically, the per-unit cost of cladribine is substantially higher than that of natalizumab, with cladribine being approximately 14 times more expensive. Not surprisingly, the popularity of individual DMT usage in Australia was different from other countries. For example, the most common DMTs in the United States in 2019 were dimethyl fumarate, glatiramer acetate and fingolimod, 14 and the most common DMTs in Iran in 2020 were rituximab, glatiramer acetate and interferon beta-1a. 25 Within Australia, the popularity of individual DMTs varied between States/Territories. While the actual DMT usage reflects not only neurologist preferences for DMT characteristics but also patient preferences, prescription guidelines, reimbursement policies, DMT accessibility and marketing efforts, 28 it also could be a result of an absence of standard guidelines for decision-making regarding DMT selection. 29 Understanding the real-world variety of DMT use and the related factors should therefore be the key for the development of future standardised guidelines. We encourage neurologists, patient advisory groups, policy makers and other stakeholders to work together to facilitate the development of standard national DMT use guideline to ensure an equitable access to DMTs for all people with MS across all jurisdictions.
A key strength is that our study presents national data on all DMT use and costs over 10 years in Australia and by States/Territories which ensured data accuracy and provided a comprehensive understanding of the real-world evidence. There are some limitations. First, a small number of DMT prescriptions were likely for those with clinically isolated syndrome that were at risk of developing MS. 30 We are not able to estimate the potential proportion of DMT use related to clinically isolated syndrome due to lack of information. Second, the demographic data on patients and neurologists from each state were not available. This information may have explained some difference on DMT usage patterns between States/Territories. Finally, PBS only recorded the subsidised use of DMT and costs, it did not cover the private hospital and inpatient records.
Conclusion
The number of people prescribed DMTs and the DMT costs in Australia continuously increased over the last decade, particularly in case of category 3 DMTs. The DMT utilisation patterns and government costs and their growth rates differed between Australian States/Territories and over time. Our findings highlight the need to understand the drivers of such differences to identify various barriers and facilitators to standardising the use of DMTs in Australia.
Supplemental Material
sj-docx-1-msj-10.1177_13524585231213230 – Supplemental material for The disease-modifying therapy utilisation and cost trend for multiple sclerosis in Australia between 2013 and 2022
Supplemental material, sj-docx-1-msj-10.1177_13524585231213230 for The disease-modifying therapy utilisation and cost trend for multiple sclerosis in Australia between 2013 and 2022 by Ting Zhao, Bruce V Taylor, Julie A Campbell and Andrew J Palmer in Multiple Sclerosis Journal
Footnotes
Data Availability
The data that support the findings of this study are openly available in Australia Government Department of Health.
Declaration of Conflicting Interests
The author(s) declared no potential conflicts of interest with respect to the research, authorship and/or publication of this article.
Funding
The author(s) received no financial support for the research, authorship and/or publication of this article.
Supplemental Material
Supplemental material for this article is available online.
References
Supplementary Material
Please find the following supplemental material available below.
For Open Access articles published under a Creative Commons License, all supplemental material carries the same license as the article it is associated with.
For non-Open Access articles published, all supplemental material carries a non-exclusive license, and permission requests for re-use of supplemental material or any part of supplemental material shall be sent directly to the copyright owner as specified in the copyright notice associated with the article.