
Abstract
Background:
Myelin oligodendrocyte glycoprotein (MOG) antibody-associated disease (MOGAD) and pediatric-onset multiple sclerosis (POMS) share clinical and magnetic resonance imaging (MRI) features but differ in prognosis and management. Early POMS diagnosis is essential to avoid disability accumulation. Central vein sign (CVS), paramagnetic rim lesions (PRLs), and central core lesions (CCLs) are susceptibility-based imaging (SbI)-related signs understudied in pediatric populations that may help discerning POMS from MOGAD.
Methods:
T2-FLAIR and SbI (three-dimensional echoplanar imaging (3D-EPI)/susceptibility-weighted imaging (SWI) or similar) were acquired on 1.5T/3T scanners. Two readers assessed CVS-positive rate (%CVS+), and their average score was used to build a receiver operator curve (ROC) assessing the ability to discriminate disease type. PRLs and CCLs were identified using a consensual approach.
Results:
The %CVS+ distinguished 26 POMS cases (mean age 13.7 years, 63% females, median EDSS 1.5) from 14 MOGAD cases (10.8 years, 35% females, EDSS 1.0) with ROC = 1, p < 0.0001, (cutoff 41%). PRLs were only detectable in POMS participants (mean 2.1±2.3, range 1–10), discriminating the two conditions with a sensitivity of 69% and a specificity of 100%. CCLs were more sensitive (81%) but less specific (71.43%).
Conclusion:
The %CVS+ and PRLs are highly specific markers of POMS. After proper validation on larger multicenter cohorts, consideration should be given to including such imaging markers for diagnosing POMS at disease onset.
Introduction
Pediatric-onset multiple sclerosis (POMS) and myelin oligodendrocyte glycoprotein antibody-associated disease (MOGAD) are two distinct conditions that can show overlapping clinical and imaging features. 1 Although MOGAD has a lower incidence when compared to MS, it is particularly frequent in childhood, representing about one-third of all first pediatric central nervous system (CNS) demyelinating events.2,3 Early differentiation between POMS and MOGAD is crucial due to significant prognostic and management differences.1,4 POMS is characterized by chronic multiphasic inflammation with high relapse rates, potentially impacting cognitive and physical development. 5 In contrast, only 30% to 50% of initial CNS demyelinating events in MOGAD children are multiphasic. 6 Diagnosis of POMS allows early initiation of preventive disease-modifying therapies (DMTs), while evidence-based treatment guidelines for MOGAD are limited. Certain DMTs may be ineffective or harmful for pediatric MOGAD.4,5
The McDonald criteria, 7 which have been validated to diagnose MS in pediatric patients,5,8–10 are more cautiously employed in children under 11 years. The newly proposed diagnostic criteria for MOGAD, developed by an international panel, 11 suggest the use of clinical syndrome, MOG-IgG serostatus, as well as the exclusion of alternative diagnoses such as MS and neuromyelitis optica spectrum disorder (NMOSD). In this proposed diagnostic approach, not yet validated in adults and children, 12 magnetic resonance imaging (MRI) represents only a supportive role. In fact, although certain conventional MRI features may suggest a diagnosis of MOGAD over POMS (i.e. different spatial distribution and temporal evolution of brain lesions; different patterns of optic nerve and spinal cord involvement),11,13–15 considerable overlap exists, and no imaging feature is currently considered highly specific for any of the two conditions. Relying solely on MOG-IgG serostatus has, however, also some limitations, as titers can fluctuate after disease onset, and low titers (< 1:100) are considered less specific because it can be found in other demyelinating disorders, including POMS. 16 Assessing and developing additional highly specific imaging markers of POMS is therefore important and desirable as it can improve and facilitate diagnosis allowing early DMT start for POMS and monitoring of MOGAD cases.
Central vein sign (CVS) and paramagnetic rim lesions (PRLs) are susceptibility-based imaging (SbI)-related signs considered highly specific for adult-onset MS (AOMS).17,18 Histopathologically, PRLs are characterized by the presence of iron-enriched microglia and macrophages. These lesions are regarded as chronic active lesions, potentially representing a marker of smoldering inflammation in MS.19–22 Several studies assessed the prevalence of CVS positive rate (%CVS+) in AOMS and most of its mimickers, and a threshold between 40% and 50% has recently been proposed as an additional criterion for MS diagnosis.17,23 PRLs are considered highly specific to AOMS and have never been observed in MOGAD, not even in pathological studies.18,24,25 An additional subtype of white matter (WM) lesion identified with SbI are the central core lesions (CCLs), characterized by central rather than peripheral hypointensity on SbI, thought to represent early repair mechanisms. 26 Despite being highly promising, these SbI-related signs have been rarely and partially assessed in a small number of POMS and pediatric MOGAD subjects.27–29 CCL prevalence has never been assessed in MOGAD.
This study evaluates the effectiveness of CVS and PRLs in distinguishing POMS from MOGAD. High specificity and sensitivity of new imaging markers could significantly improve the diagnostic process in pediatric demyelinating disorders, particularly for MS cases with low MOG-IgG titers and possible MOGAD cases missing early MOG-IgG serostatus.
Methods
Participants
Participants with POMS and MOGAD from UCSF Regional Pediatric MS Center were retrospectively included in this study. Only MRI scans from 2014 to 2022 with SbI were analyzed.
The inclusion criteria were:
For all participants:
Age <18 years,
Negative AQP4-IgG serostatus,
MRI scan performed at 1.5/3T,
Abnormal brain MRI with presence of at least one T2 lesion > 3 mm adequate for CVS assessment. 30
For POMS participants:
Meet the 2017 McDonald criteria for MS diagnosis, 7
MOG-IgG negative by Mayo Clinic live cell-based assay (< 1:10).
For MOGAD subjects:
CNS demyelinating event with course suggestive of MOGAD,
MOG-IgG is positive based on Mayo Clinic live cell-based assay (⩾1:10).
For this study, scans that were acquired for either clinical or research purposes were analyzed. For the clinical scans, patients of any age under 18 years could be included in the analysis as long as they met the above inclusion criteria. Research MRI scans were only obtained on subjects with age between 7 and 18 years to avoid clinically unnecessary sedation. Exclusion criteria were motion-compromised T2-FLAIR or SbI and exclusive presence of confluent T2 lesions. Clinical characteristics were obtained by electronic medical health records review and reflect data available at the time of MRI acquisition. The local ethics board approved the study (IRB#23-38563), and the requirement for individual Research HIPAA Authorization was waived for all subjects.
MRI acquisitions and protocols
Fourteen of 40 subjects had brain MRI without contrast performed on a Siemens 3TSkyra scanner equipped with a 64-channel coil (Erlangen, Germany) with a protocol including standard sagittal three-dimensional (3D) T2-FLAIR with 1 mm3 cubic voxel (acquisition time = 4:42 minutes) and sagittal segmented 3D echoplanar imaging (3D-EPI) with 0.65 mm3 cubic voxel and the following main acquisition parameters: TR/TE = 68/37 milliseconds, EPI factor = 15, anterior to posterior phase encoding, flip angle = 10 degree (acquisition time = 6:08 minutes). The other 26 participants underwent a clinical MRI examination at 3T (n = 15) or 1.5T (n = 11), including T2-FLAIR and susceptibility-weighted imaging (SWI) or similar sequences. The name of the MRI machine, vendor, model, and parameters of the specific susceptibility sequences acquired is reported in Table 1. These 26 participants, representing 62% of POMS and 72% of MOGAD, received contrast administration at the time of scanning.
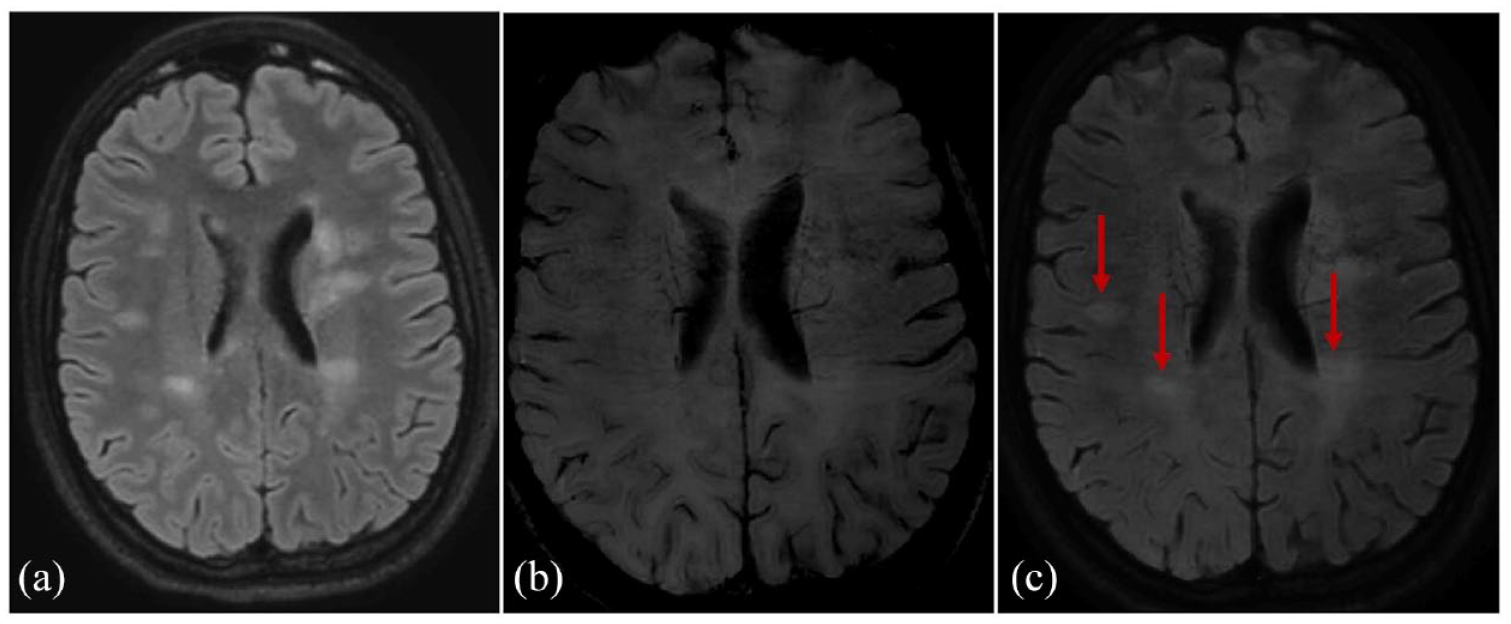
Parameters of SWI sequences clinically acquired.
Here reported imaging parameters and contrast administration for the susceptibility sequences acquired clinically in the subset of 26 participants. All the sequences were three-dimensional (3D), included the posterior fossa, and were acquired axially.
Image processing and CVS assessment
The 3D-EPI is an isotropic T2*-weighted sequence that, with a magnitude reconstruction, offers optimal contrast for the detection of the CVS (see Figure 1). For the 14 subjects that had this sequence acquired, the %CVS+ was computed directly on the images without needing additional image processing. For the 26 subjects with SWI acquired clinically, to optimize CVS visualization, the axial FLAIR images were linearly registered (12 degrees of freedom) to the SWI through FSL’s FLIRT using the mutual information as the cost function, so that the two sequences could be overlayed for visual analysis (see Figure 2). Two readers, SS (neuroradiologist with 9 years of experience) and AV (pediatric neurologist with 3 years of experience), assessed %CVS+ blinded to clinical information. Based on NAIMS guidelines, 30 lesions were excluded from the CVS assessment if they were < 3 mm, merged with other lesions, or presented multiple distinct veins in their context. The %CVS+ was computed in relationship with the total number of lesions adequate for CVS assessment. For each group, the total number of lesions and the total number of lesions adequate for CVS assessment are reported in Table 2. The results from the two independent %CVS+ assessments were averaged and used as predictors in the statistical analysis. Inter-rater reliability was calculated using intraclass correlation coefficients (ICCs) with a two-way random effects model for absolute agreement on average measures to determine the consistency between the two raters’ assessments.
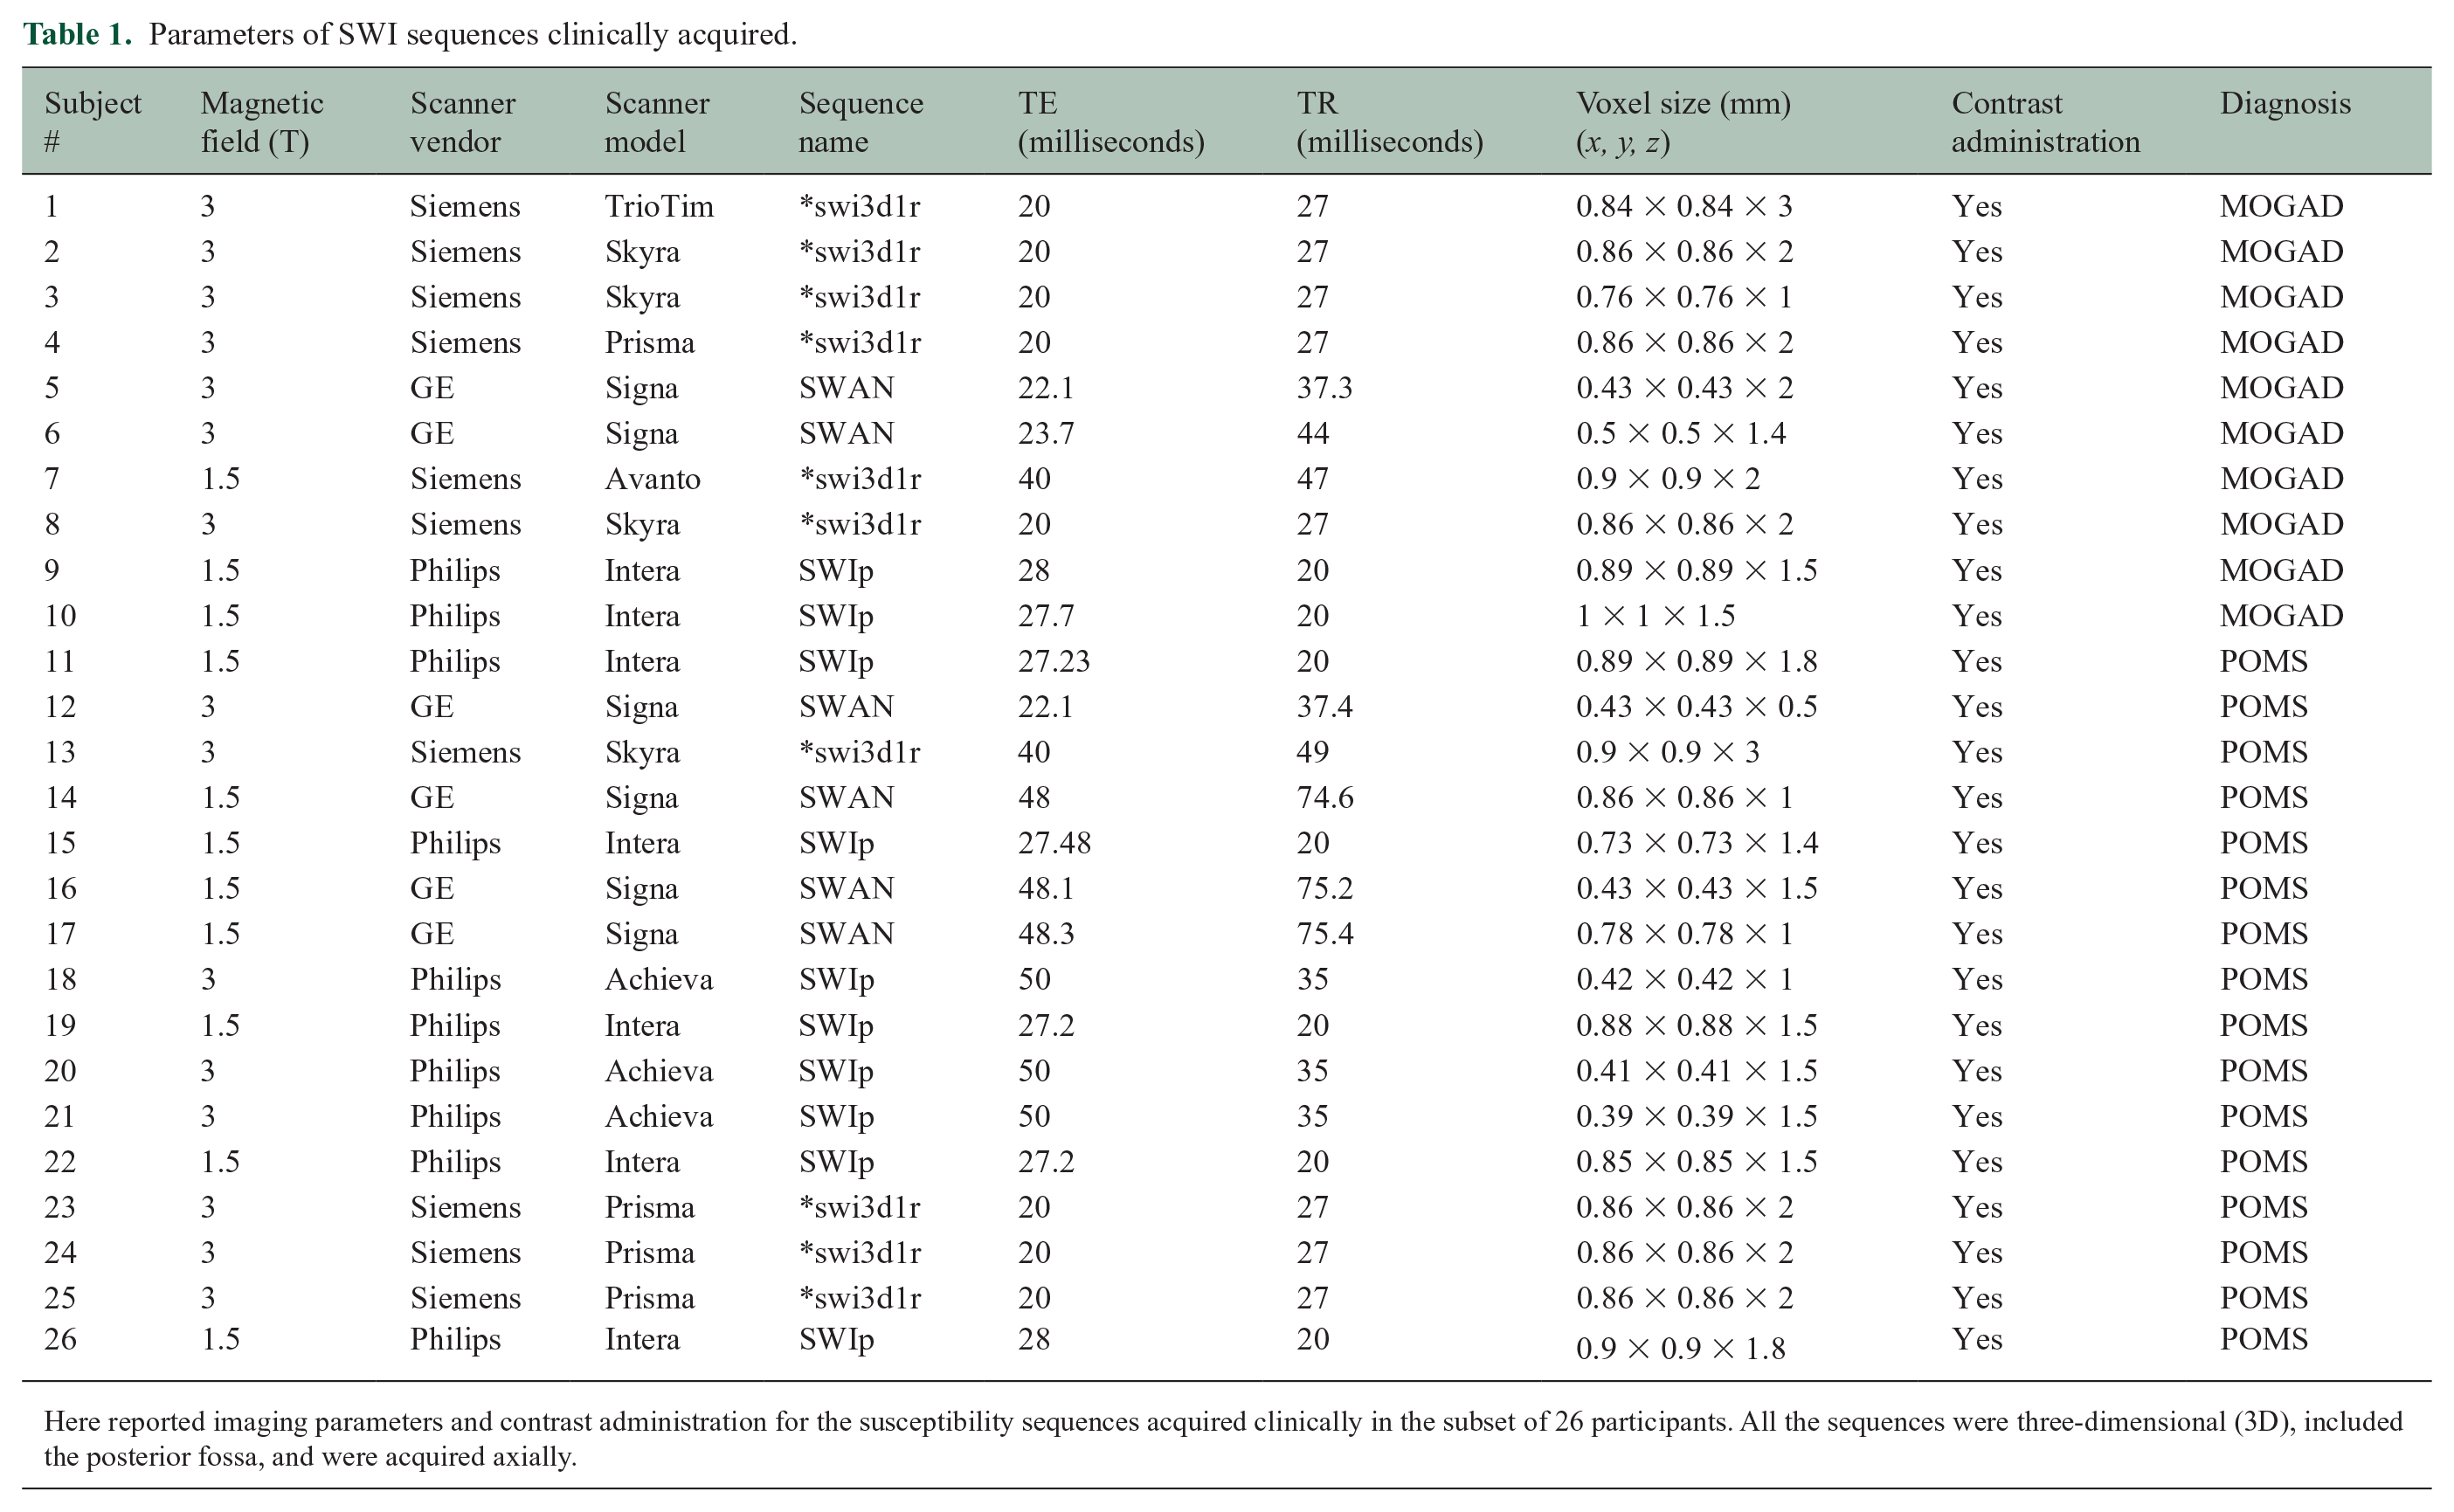
CVS assessment on 3D-EPI in a POMS subject. 3D-EPI in one of the POMS participants reveals positive central vessel signs in at least three of the four lesions included in this axial brain section (shown by arrows).
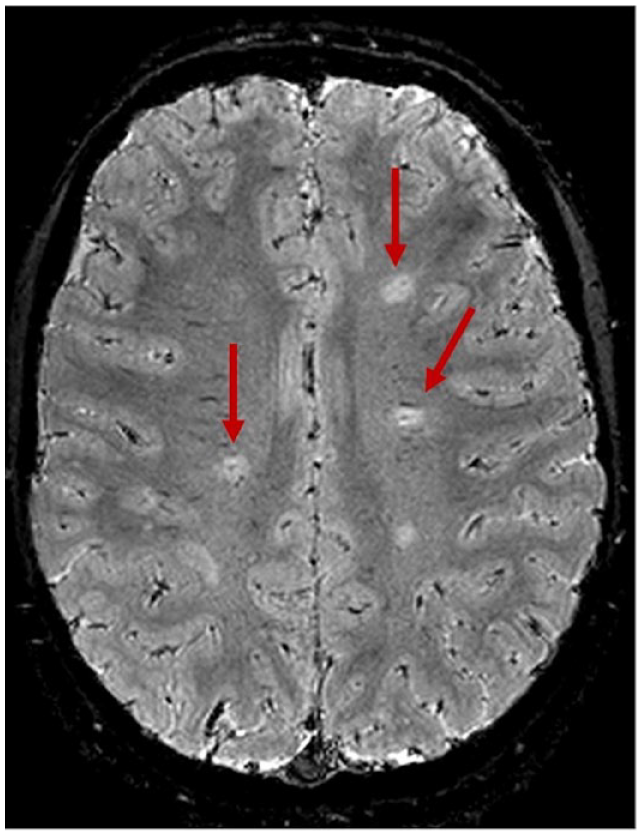
CVS assessment on SWI. CVS assessment on SWI sequences was performed (a) after linear registration of the T2-FLAIR (b) in the SWI space. This post-processing allowed the (c) overlying of the two images for optimal detection of the central vein (arrows). (a), (b), and (c) are images of a POMS participant.
Demographic, laboratory, and radiological data for the two disease groups.
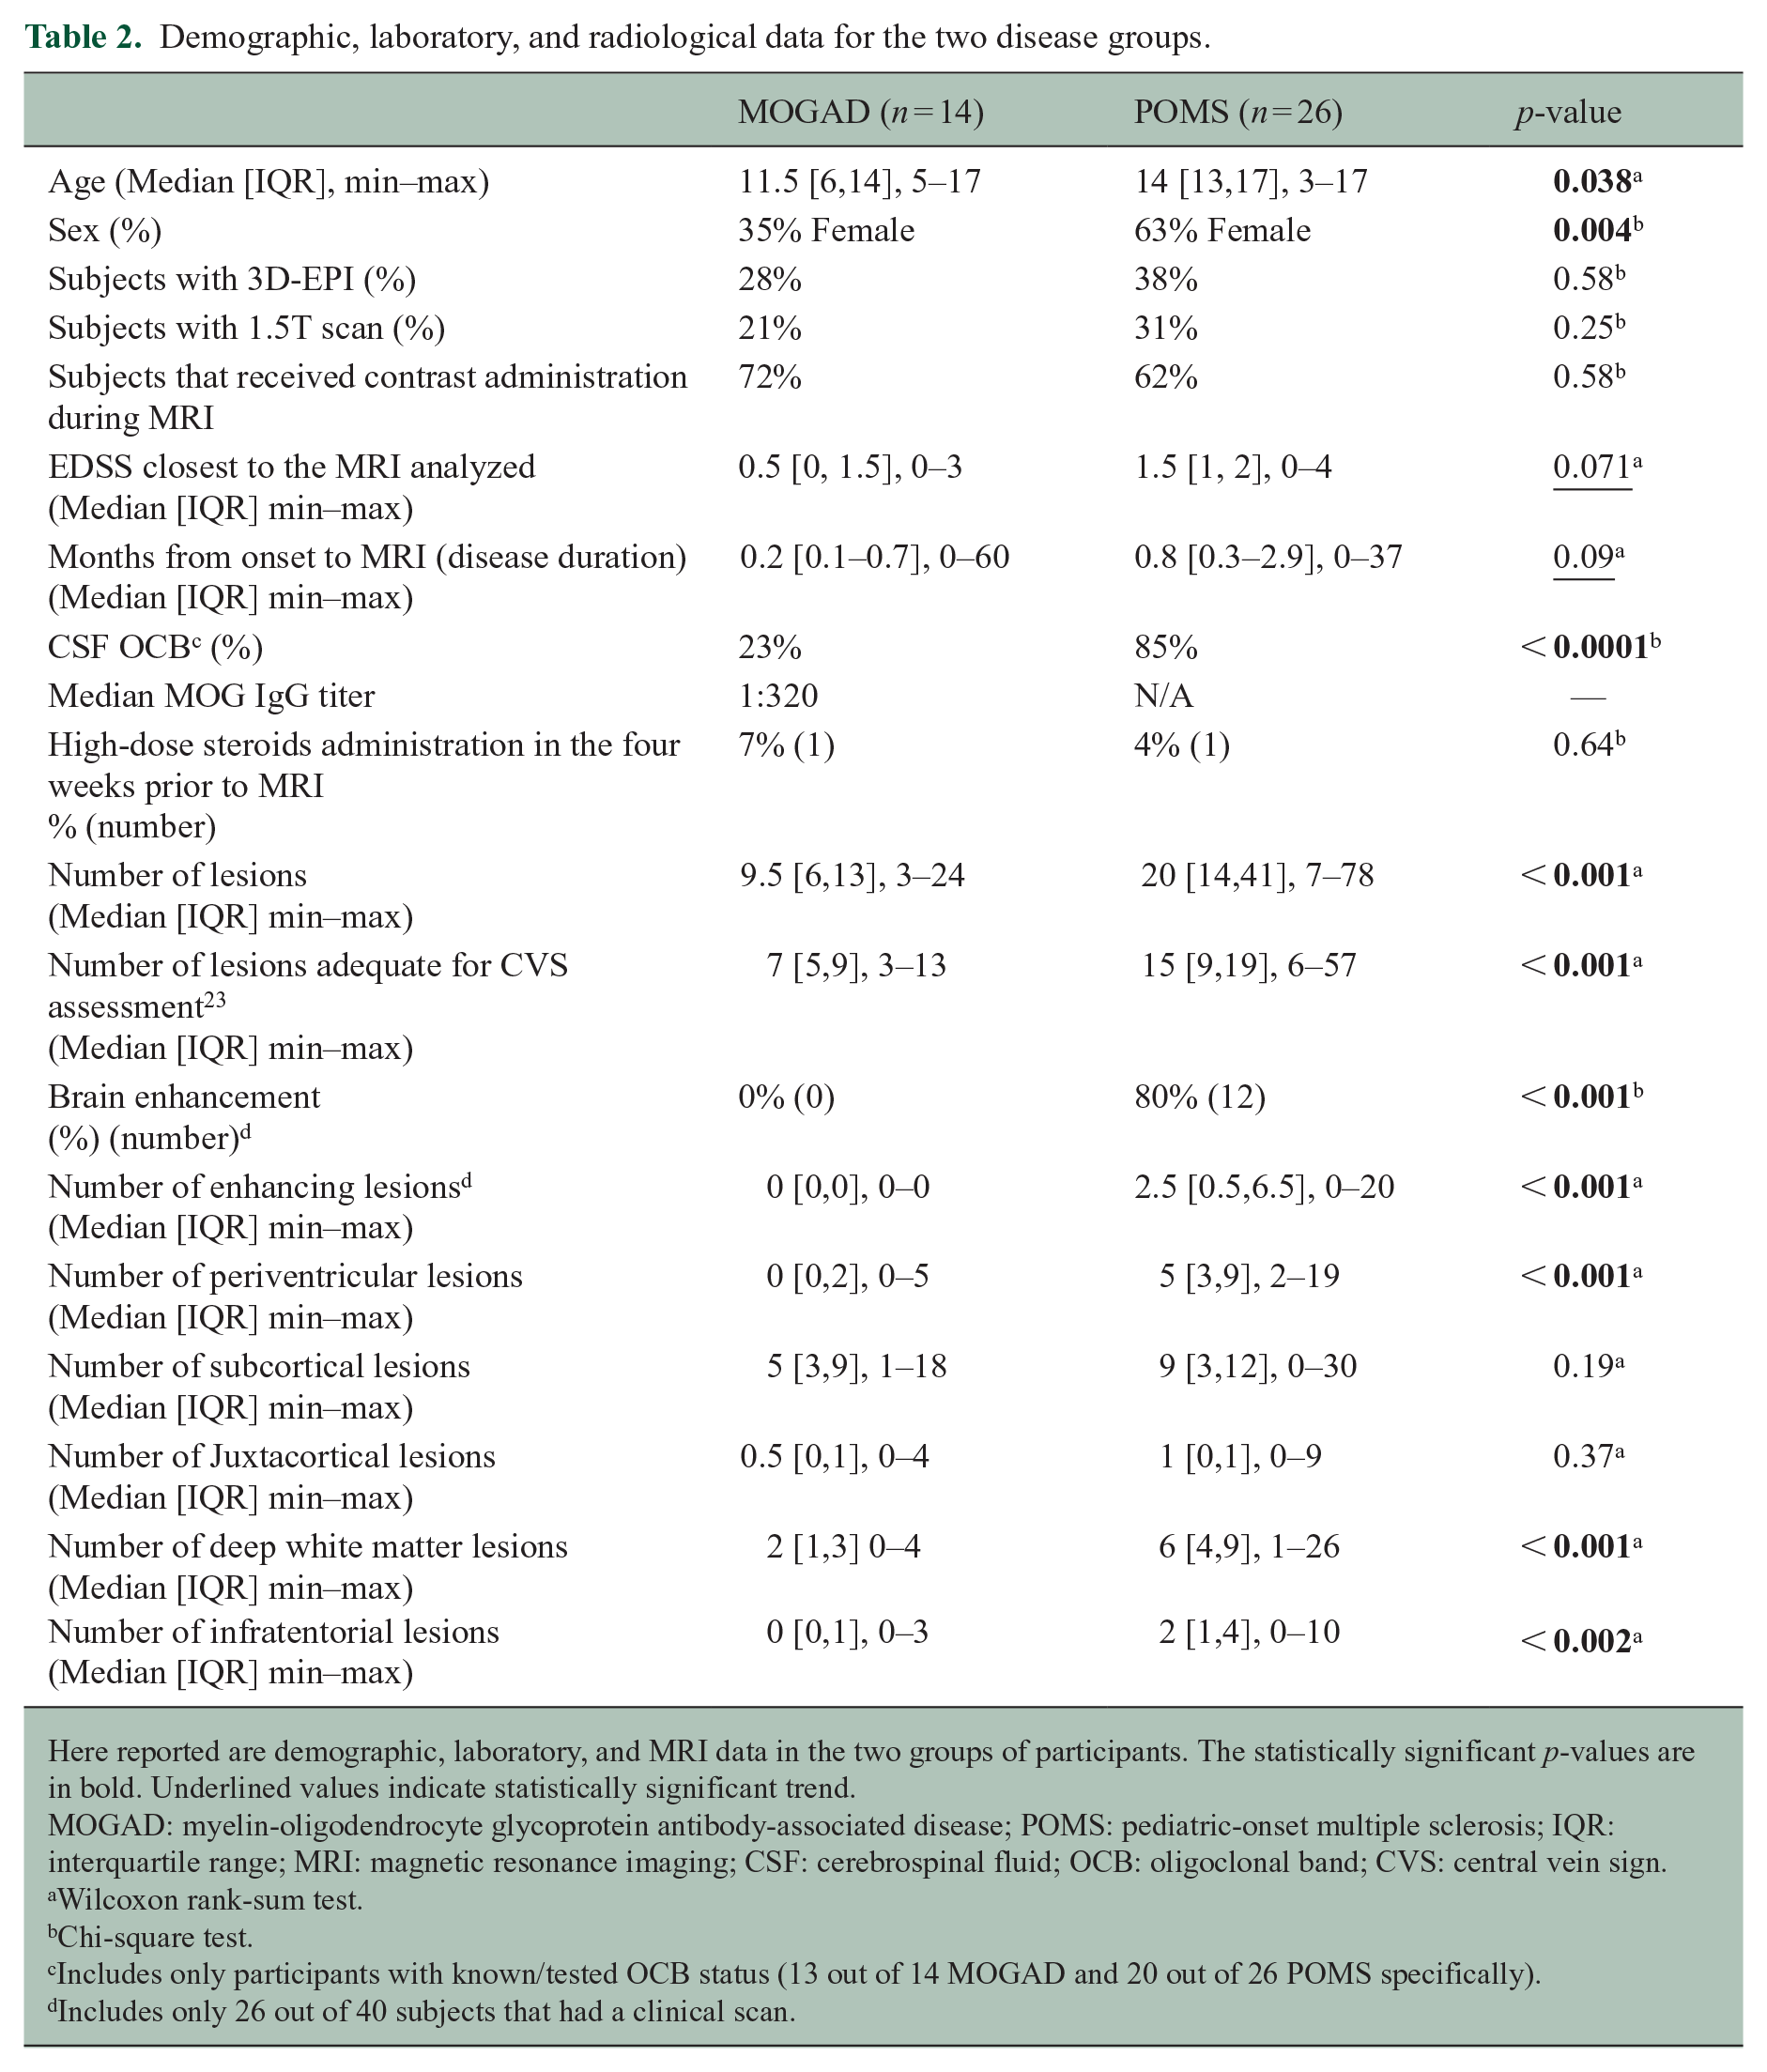
Here reported are demographic, laboratory, and MRI data in the two groups of participants. The statistically significant p-values are in bold. Underlined values indicate statistically significant trend.
MOGAD: myelin-oligodendrocyte glycoprotein antibody-associated disease; POMS: pediatric-onset multiple sclerosis; IQR: interquartile range; MRI: magnetic resonance imaging; CSF: cerebrospinal fluid; OCB: oligoclonal band; CVS: central vein sign.
Wilcoxon rank-sum test.
Chi-square test.
Includes only participants with known/tested OCB status (13 out of 14 MOGAD and 20 out of 26 POMS specifically).
Includes only 26 out of 40 subjects that had a clinical scan.
Image processing and PRL and CCL assessment
For the 14 subjects with 3D-EPI, phase images were created in two steps:
In the first step, raw phase images were skull stripped and unwrapped through FSL’s “prelude.” 31
In the second step, background field contribution was removed through the VSHARP implementation found in the STI Suite. 32
For the 26 subjects with clinically acquired SWI, a similar post-process was performed only when phase images were not already available. Two readers (SS, AV) assessed by consensus presence and number of PRLs and CCLs for each scan looking at phase and magnitude images as well as T2-FLAIR (see Figures 3 and 4).
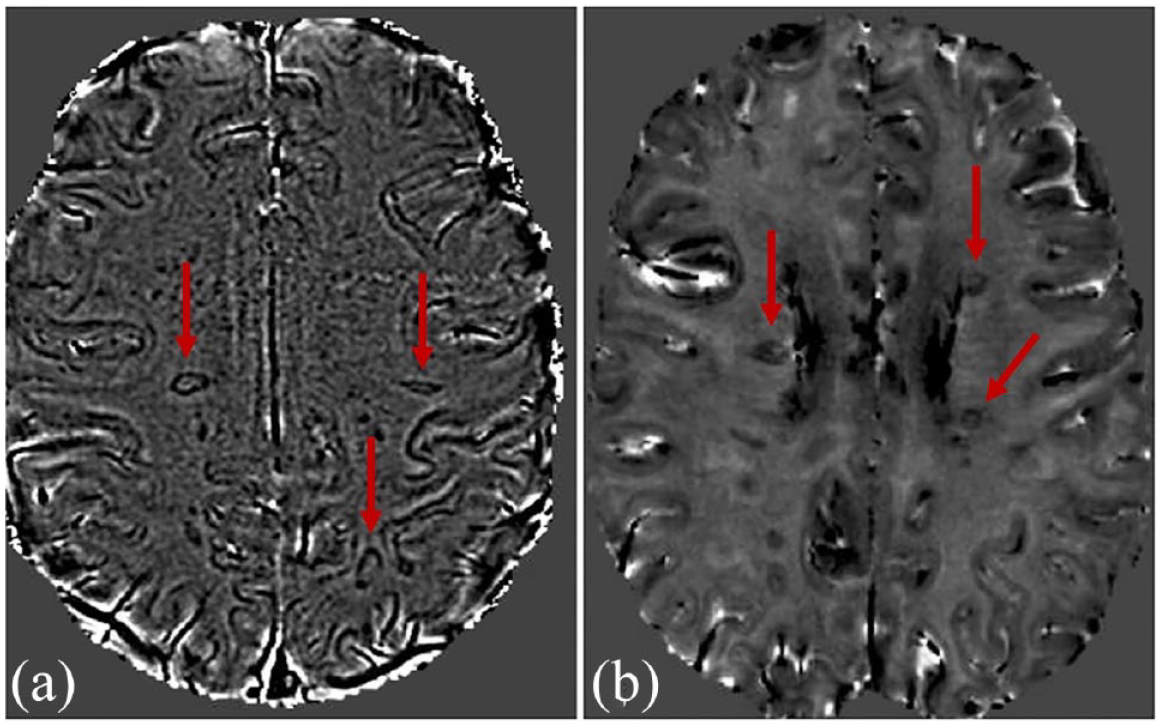
PRL assessment on phase images from SWI and phase images from 3D-EPI. Phase images derived from (a) SWI and (b) 3D-EPI similarly reveal PRLs (arrows) in subcortical and periventricular white matter in two of the POMS participants.
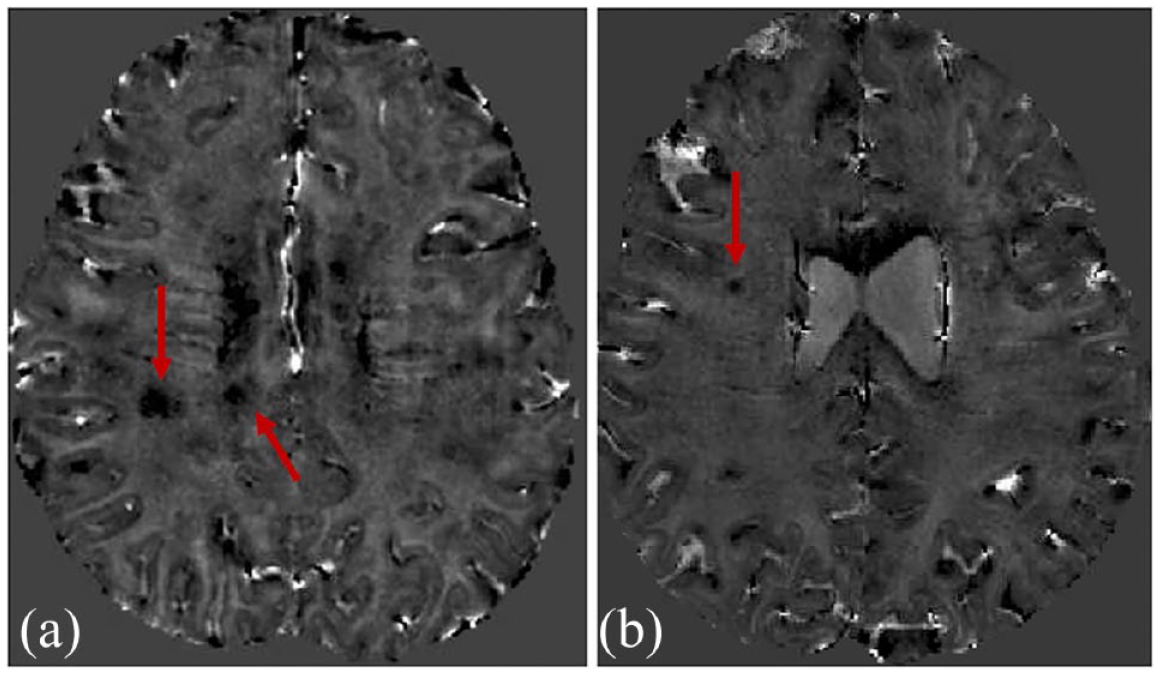
CCL in POMS and MOGAD. Phase images derived from 3D-EPI shows CCL (arrows) in a (a) POMS and (b) MOGAD participant.
Statistical analysis
Differences between MOGAD and POMS in demographics, lesion distribution, disease severity, type of SbI sequences analyzed, scan field strength, MRI contrast administration, disease duration, presence of oligoclonal bands, and EDSS closest to the analyzed MRI were compared using t-test, Wilcoxon rank-sum test or chi-square test, as appropriate. An ROC was constructed to assess the ability of %CVS+ to discriminate disease type. This was further explored with a sensitivity analysis including only patients with an MRI obtained within 90 days from onset. PRLs and CCLs were treated as binary variables (presence/absence) and sensitivity and specificity were calculated using the clinical diagnosis as the reference standard to measure the relationship between such findings and POMS/MOGAD diagnosis. Statistical analyses were performed with JMP17 (SAS Institute, NC) and STATA 16.1 (College Station, TX). The alpha level was set at 0.05, and all tests were two-sided.
Results
Demographics and clinical features
A final cohort of 14 MOGAD and 26 POMS was selected, as depicted in Figure 5. MOG-IgG testing via live cell-based assay were performed in both groups as previously described.33,34 All participants within the MOGAD group unequivocally fulfilled the recently published proposed criteria. 11 In particular, only 2 of the 14 MOGAD participants had a low MOG-IgG titer (1:40 for both subjects), but were classifiable as MOGAD per proposed criteria as they presented supporting MRI features for a MOGAD diagnosis (bilateral optic neuritis (ON) and longitudinally extensive myelitis). Of the 14 MOGAD subjects, only three fulfilled the 2017 McDonald criteria at the time of their MRI. MRI analyzed were acquired shortly after MOGAD and POMS onset, specifically within 90 days from onset for 33 of the 40 participants included in the study (see Table 2).
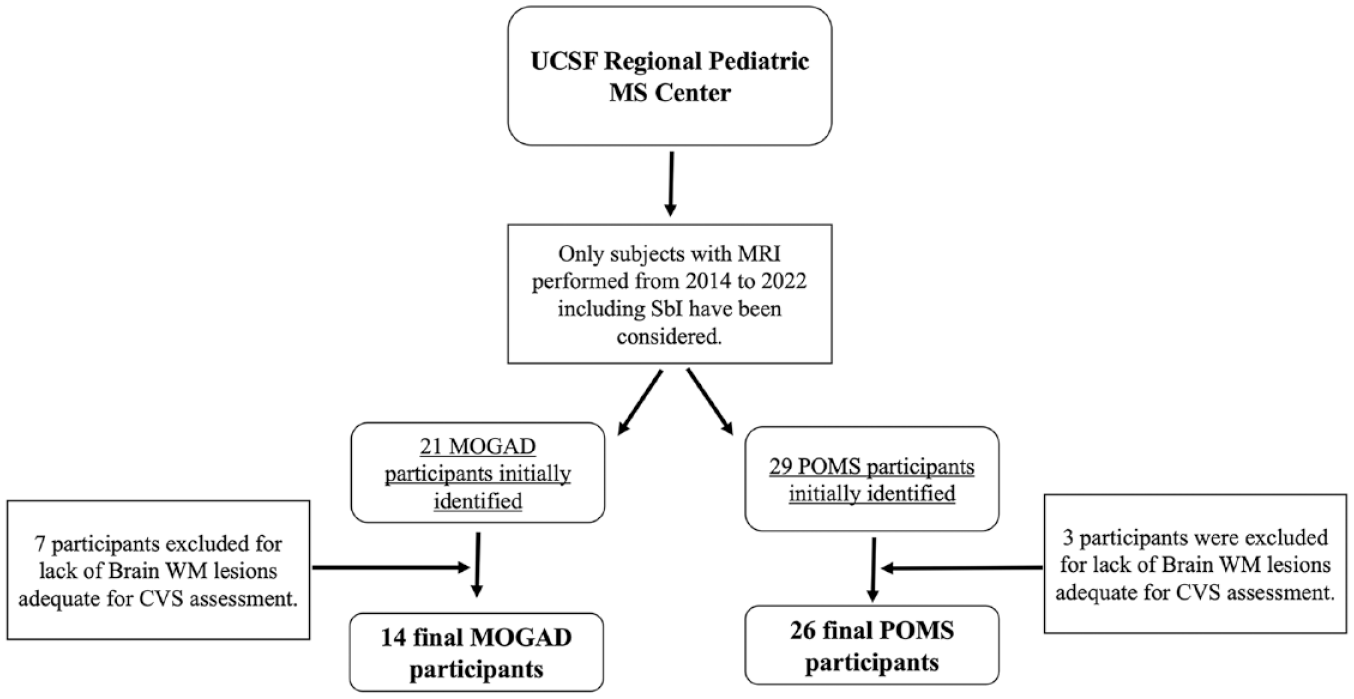
Chart representing the algorithm for participants’ selection. Here depicted is a flow chart for POMS and MOGAD participants’ selection.
Regarding the clinical features, 11 of the 14 MOGAD participants had a multiphasic disease course. Compared to MOGAD, POMS participants were older, had a higher rate of females, and showed a trend toward higher median EDSS (see Table 2). No statistically significant differences in disease duration, scan field strength, MRI contrast administration, and type of SbI sequences were identified between the two groups. In the MOGAD group, the median MOG-IgG titer was 1/320. The oligoclonal band (OCB) status was unknown or not tested for 1 of 14 MOGAD and 6 of 26 POMS participants. Considering only those with known OCB status, 23% of MOGAD and 85% of POMS participants had OCB. Only two subjects (one MOGAD and one POMS participant) had received high-dose steroids within the 30 days preceding the MRI. In the MOGAD group, the most common presenting phenotype was acute disseminated encephalomyelitis (ADEM, n = 5, see Table 3). Three patients presented with bilateral ON, while two exhibited a combination of ADEM and ON. In the POMS group, the most common phenotype was brainstem syndrome (n = 10). Seven patients presented with cerebral deficits, whereas a total of four experienced transverse myelitis (three isolated and one in combination with ON and cerebral deficit).
First clinical presentation.
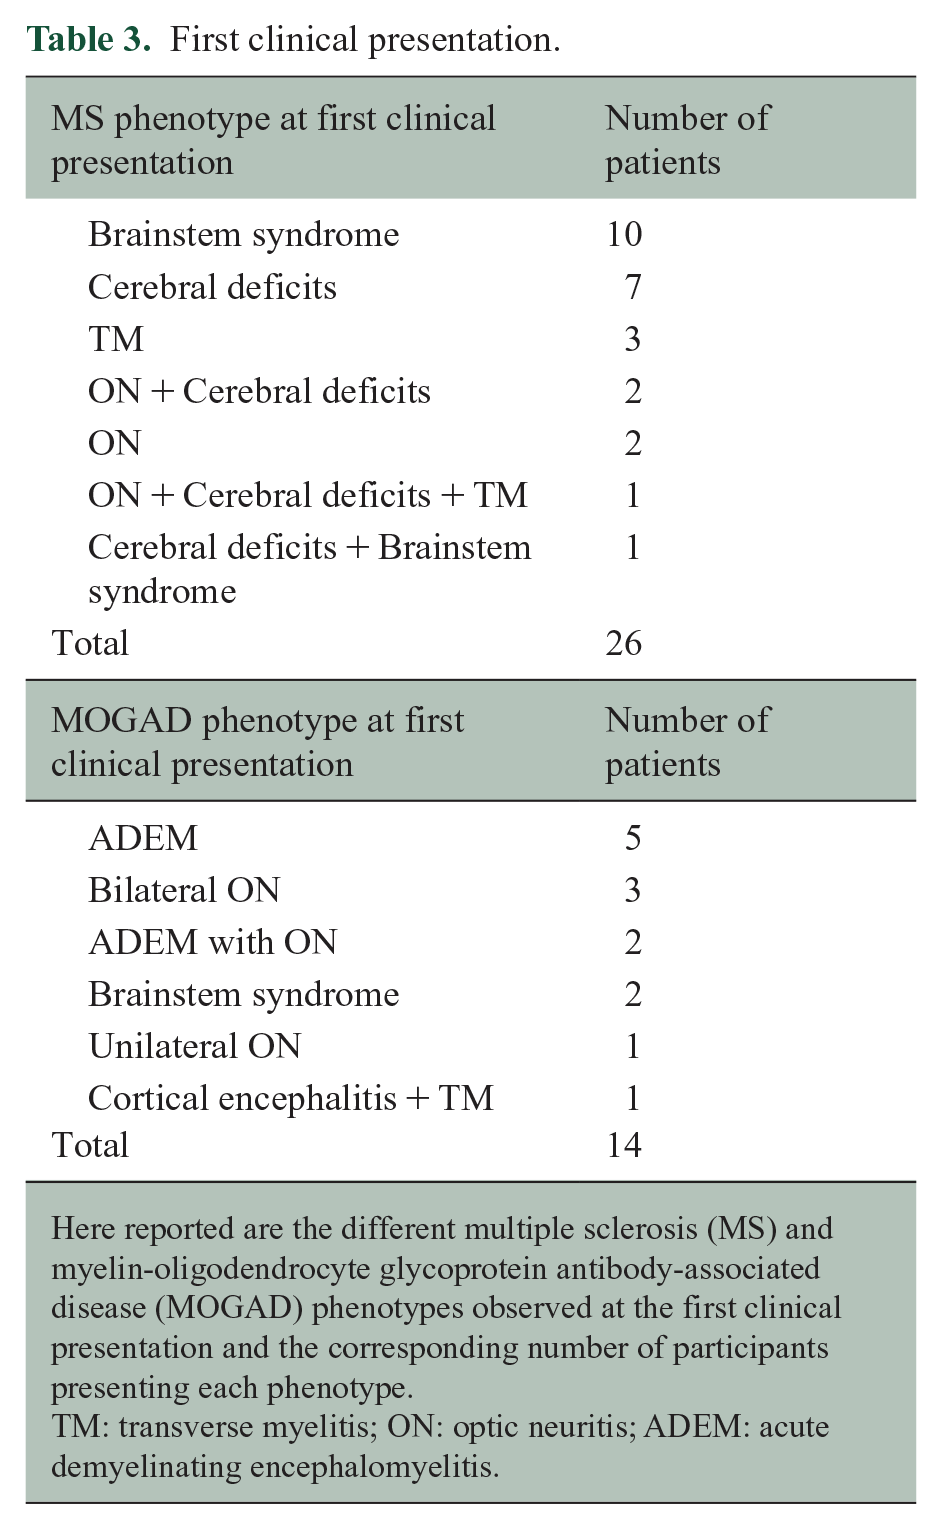
Here reported are the different multiple sclerosis (MS) and myelin-oligodendrocyte glycoprotein antibody-associated disease (MOGAD) phenotypes observed at the first clinical presentation and the corresponding number of participants presenting each phenotype.
TM: transverse myelitis; ON: optic neuritis; ADEM: acute demyelinating encephalomyelitis.
Lesion distribution and enhancement
POMS participants had a higher number of total T2 lesions and a higher number of lesions adequate for CVS assessment when compared to MOGAD (see Table 2). A higher number of lesions in POMS than MOGAD were located within periventricular, deep, and infratentorial WM. No statistically significant difference in number of subcortical and juxtacortical lesions was detectable between the two groups. In the subgroup of subjects that received contrast (n = 26), 80% of POMS but no MOGAD showed enhancing lesions.
%CVS+ distinguishes POMS from MOGAD
There was no overlap between POMS and MOGAD for the %CVS+ (area under the ROC = 1; p < 0.0001), with a cutoff of 41% perfectly separating both groups (see Figure 6(a) and Table 4). The average %CVS+ was 63±8% for POMS and 22±12% for MOGAD participants. A 41% cutoff allowed the distinction of the two conditions even in the six MOGAD participants with low MOG-IgG titer and in the five POMS that were younger than 11 years (see Figures 1 vs 7). Regarding MRI data heterogeneity, only 14 of 40 subjects had 3D-EPI acquired instead of the SWI acquired clinically and did not receive contrast administration. There was, however, no statistically significant difference in the distribution of SWI/3D-EPI sequences analyzed for CVS and contrast administration among POMS and MOGAD subjects (chi-square test p = 0.58). For both POMS and MOGAD, %CVS+ was similar when assessed on 3D-EPI compared to SWI (%CVS+ for POMS 63% on 3D-EPI and 63% on SWI; %CVS+ for MOGAD 16% on 3D-EPI and 25% on SWI; t-test p = 0.48 and 0.12, respectively). In the MOGAD group, no statistically significant difference in %CVS+ was found between participants fulfilling (n = 3) or not (n = 11) the 2017 McDonald criteria for MS diagnosis (21.69% vs 22.12%, p = 0.96). Regarding the two independent assessments of the CVS, ICC computation revealed a good inter-rater reliability (0.83) with a 95% confidence interval (0.68–0.91), accepting both a moderate (lower bound < 0.75) and excellent reliability (upper bound > 0.90). In addition, we conducted a sensitivity analysis on a subgroup of patients (n = 33) who had MRI scans within 90 days of the clinical event and the presented cutoff was unchanged.
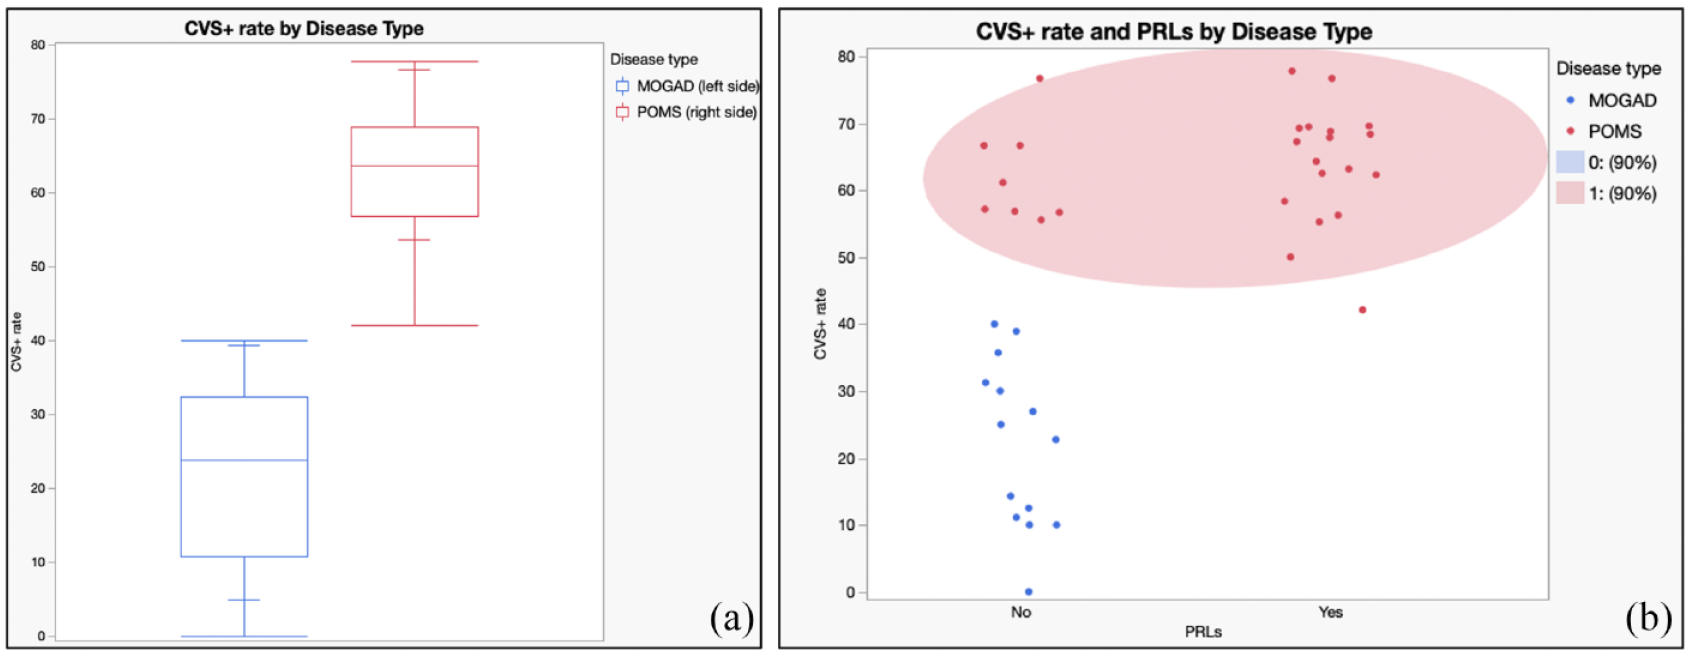
CVS and PRL by disease group. (a) Boxplots for CVS+ rate (%CVS+) by disease type visually demonstrate distinction between MOGAD and POMS. (b) Scatterplot for both %CVS+ and PRLs presence by disease type show how the presence of PRLs may suggest a diagnosis of POMS even in POMS subjects with a %CVS+ rate close to the 41% threshold.
Sensitivity and specificity of SbI-related signs.
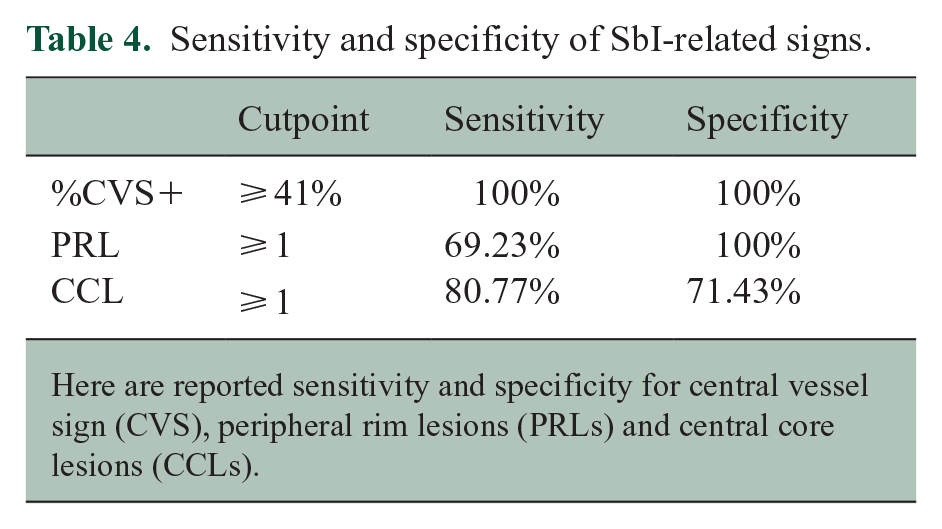
Here are reported sensitivity and specificity for central vessel sign (CVS), peripheral rim lesions (PRLs) and central core lesions (CCLs).
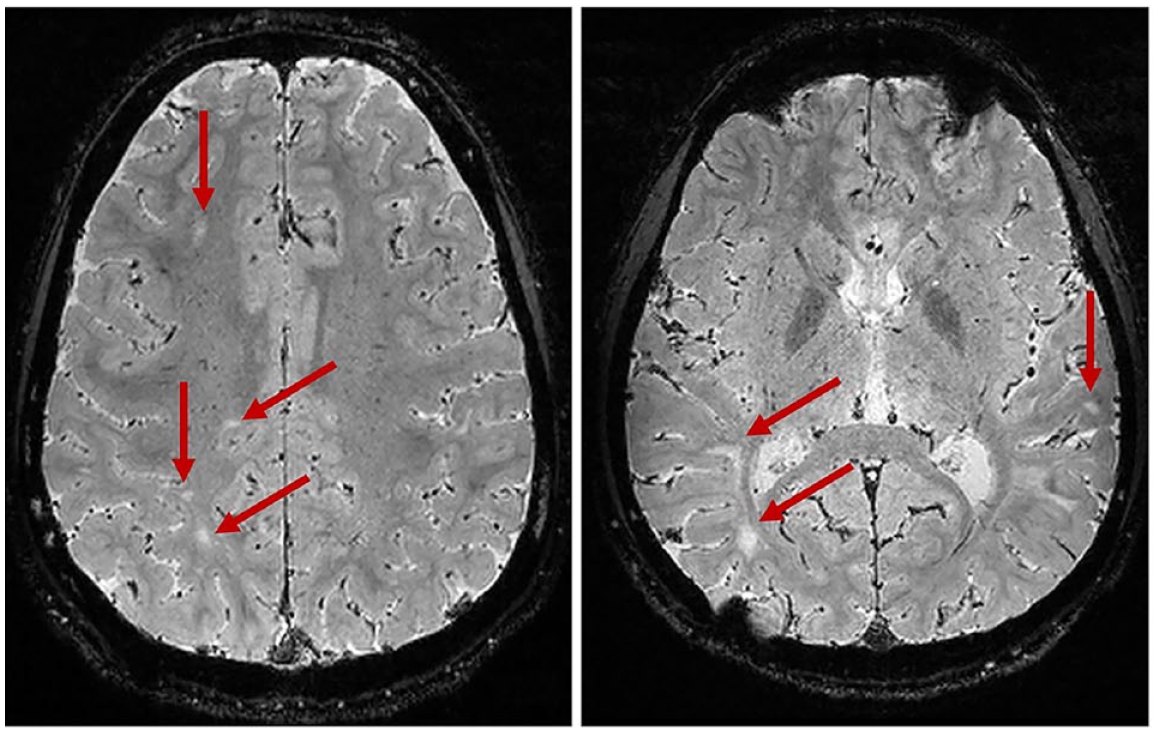
Lack of CVS in MOGAD. None of the lesions (arrows) in these two 3D-EPI axial sections of the brain of a MOGAD participant show positive central vessel sign.
PRLs are highly specific for POMS
No PRLs were detected in MOGAD subjects. A total of 55 PRLs were detected in the POMS group, none of which showed enhancement or had appeared from a prior scan. Eighteen of 26 POMS participants (69%) showed at least one PRL (mean 2.1 ± 2.3, range 1–10). The most common locations for PRLs were periventricular (44%) and subcortical WM (40%), followed by deep (12%) and the infratentorial WM (4%; see Figure 3). The presence of PRLs was related to a diagnosis of POMS with high specificity (100%) but modest sensitivity since only 69% of POMS participants had this finding (see Figure 6(b) and Table 4). No statistically significant difference in EDSS could be found between POMS participants showing at least one PRL in comparison to those without PRLs (Wilcoxon test; p = 0.5), suggesting a lack of correlation between PRLs and accumulated disability. However, as purely descriptive finding, we report that the POMS participant that showed the highest number of PRLs (n = 10) also presented the highest EDSS in the whole cohort (EDSS = 4).
CCLs are more frequent in POMS compared to MOGAD and are potentially associated with enhancement
CCLs were more frequently observed in POMS (mean 3.4±3, 0–9) compared to MOGAD participants (mean 0.64±1; see Figure 4) and their presence was related to a diagnosis of POMS with a sensitivity of 81% and a specificity of 71% (see Table 4). However, several POMS participants presented enhancing lesions, whereas no MOGAD subject did. Thirty percent of the CCLs detected in POMS showed enhancement. Only for POMS but not for MOGAD, participants with at least one CCL showed a trend toward higher EDSS compared to those without any CCL (median EDSS when CCL present = 2 (IQR 1–2; n = 21) vs median EDSS when CCL absent = 1 (IQR 0–1.5; n = 5; p = 0.065).
Discussion
We report the rate of three SbI-related signs in POMS and pediatric MOGAD, while prior studies have either focused only on one of these signs or have limited their observation to POMS. We show that assessing the %CVS+ on SbI allows a perfect distinction between POMS and pediatric MOGAD shortly after disease onset with a 41% scan level cutoff. Furthermore, the presence of at least one PRL within the brain WM is highly specific to a diagnosis of POMS. Imaging markers with high specificity for POMS could significantly improve the diagnostic process in pediatric CNS demyelinating disorders.
Only a few studies assessed the prevalence of the %CVS+ in pediatric demyelinating diseases. In a cohort of 10 POMS and 10 pediatric MOGAD, the %CVS+ was significantly higher in POMS for both readers but with a very low inter-rater reliability. 29 Only trained neuroradiologists and/or clinicians with years of neuroimaging experience should provide visual CVS assessments. 30 In addition, regarding assessments performed on clinically acquired SWI, it is always important to report sequence parameters as significant heterogeneity can exist among scanners and vendors (see Table 1). None of the imaging parameters of the analyzed SWI sequences, nor the identity or credentials of who, among the authors, performed the readings were reported in this recent publication, and we, therefore, suspect that the striking difference between the two ratings could be related to either insufficient training or high heterogeneity of MRI data.
In a case series assessing the %CVS+ on 3D-EPI, two experienced readers concordantly found an average %CVS+ of 57% in 10 POMS subjects, which approaches what we observed. 27 Three of the 10 subjects included in the study, however, did not reach the 40% threshold currently suggested for diagnosing MS, and this was likely related to the presence of a significant amount of confluent periventricular lesions.
CVS assessment in 52 AOMS and adult MOGAD found a slightly lower %CVS+ compared to what we observed, 44% and 12%, respectively. 23 This could be related to the inclusion of a higher number of 1.5T scans (50% vs 27% in our study), which are known to reveal lower %CVS+ when compared to 3T. 35 Surprisingly, a recent assessment in eight adult MOGAD reported a 78% %CVS+, 36 but this may be related to computation that involved the total lesion burden without accounting for lesions that should be excluded. The same group argues against using the CVS for diagnosing POMS, 37 advocating that veins in gadolinium-enhancing lesions could be obscured by T2 signal changes related to edema. 38 Very interestingly, we found a significantly higher %CVS+ in POMS compared to MOGAD, even though 80% of POMS receiving gadolinium had enhancing lesions and no MOGAD participant did.
Pathological studies in MOGAD revealed three patterns of demyelination: perivenous (21%), confluent (29%), and transitional (50%), the latter of which is characterized by both perivenous and confluent elements. 39 It has been suggested that WM lesions in MOGAD when compared to MS, exhibit a confluent pattern around smaller veins, which could be less easily detectable on SbI. 40 We hypothesize this might represent the pathological substrate for the imaging differences we observed in the two diseases.
PRLs are considered highly specific for MS and are present across all MS phenotypes.18,24,25 The presence of PRLs has also been reported in 77% of 13 POMS subjects in a recent study, a similar rate compared to our observation. 28 Our results confirm these findings suggesting that chronic inflammation is present from the early phases of MS, even in young subjects. Unlike prior AOMS studies, 41 we did not find correlations between EDSS and presence of PRLs, but this might be related to our limited sample size. Nonetheless, the presence of PRLs appears to be highly specific to POMS. These findings are supported by pathological MOGAD studies that show a lack of smoldering or iron-rich peripheral lesions. 39
In our study, CCL were more frequently observed in POMS than MOGAD. The mean of CCL in our cohort resembles a recent report in POMS (3.4 vs 5 CCL per subject, respectively), 28 whereas no CCL assessment has been previously reported in MOGAD. This subtype of WM lesion is currently understudied pathologically, but it may reflect disease activity and/or subsequent early repair mechanisms, with the hypointense core possibly related to iron deposition because of dying oligodendrocytes or leaky blood vessels (blood-barrier breakdown). 26 Interestingly, 30% of CCL in our POMS participants showed enhancement. The trend suggesting slightly higher EDSS in POMS participants with at least one CCL when compared to POMS participants without any CCL is possibly related to the association between CCL and enhancement, as subjects with enhancement may present higher EDSS at the time of MRI.
Our study has some limitations. First and most importantly, the sample size was small, especially for the MOGAD group and therefore larger multicenter cohorts are required to properly validate our findings. Nonetheless, pediatric demyelinating diseases are rare, and collecting high-quality standardized data in this age group is difficult. As a matter of fact our cohort currently represents the largest one in which such assessments have been performed (both for number of POMS and pediatric MOGAD). In addition to its sample size, however, our study is also strengthened by scans obtained shortly after disease onset and the good inter-rater reliability between the two masked readers. Using different SbI sequences with or without contrast administration, acquired at different field strengths is a potential source of heterogeneity. However, POMS and MOGAD groups in our study do not differ for such features (see Table 2), and %CVS+ in POMS and MOGAD were similar when assessed on either SWI or 3D-EPI. One of the most important considerations for the CVS assessment in MOGAD is the higher number of confluent lesions detectable in this disease when compared to MS; such lesions are, in fact, not eligible for CVS assessment. This and the fact that a significant proportion of MOGAD subjects did not show any brain lesions limited the number of MOGAD subjects that could be included in our study and may therefore also represent a real-world challenge to apply CVS as an imaging biomarker in pediatric demyelinating diseases. A recent study found that the median time for MOGAD lesions to resolve was 3 months after onset. 42 In our study, the median time to MRI from the clinical event onset in the MOGAD group was 0.2 (IQR 0.1–0.7) months. While it is possible that certain T2 hyperintense lesions may have resolved prior to the image acquisition, their influence is unlikely to be a major factor driving the outcomes. This assertion gains further support from a sensitivity analysis conducted, wherein patients who underwent scans more than 3 months after the clinical event were excluded. Remarkably, this exclusion did not alter the outcome, reinforcing the credibility of the study’s findings, underscoring the consistency of the cutoff criteria employed and their potential translation to clinical practice after proper validation. The tendency toward resolution of MOGAD WM lesions altogether with the inclusion criteria specifically requiring the presence of at least one brain WM lesion adequate for CVS assessment may have increased the likelihood of selecting participants with a relapsing disease course in comparison to monophasic (see Figure 5). The rate of recurrent disease in MOGAD ranges from 30% to 50%, 6 whereas in our cohort 78% of MOGAD participants had relapses. While this could make our MOGAD cohort slightly less representative than that seen in clinical practice, it is unlikely that brain lesions in relapsing MOGAD would be pathologically different when compared to the monophasic disease.
Conclusion
SbI can differentiate POMS from pediatric MOGAD with high sensitivity and specificity. Early differentiation is vital for treatment and disability prevention. Larger multicenter cohorts are needed to confirm these findings.
Footnotes
Data Availability Statement
All data generated or analyzed during this study are included in this published article.
Declaration of Conflicting Interests
The author(s) declared the following potential conflicts of interest with respect to the research, authorship, and/or publication of this article: SS, NP, VAS, AA, HZ, JA, WAS, JC, JH, SSZ, PS, RGH, and EW have no disclosures relevant to this study.
AV is supported by a Biogen Fellowship.
Funding
The author(s) disclosed receipt of the following financial support for the research, authorship, and/or publication of this article: This study was funded by a pilot grant from the Consortium of MS Centers (PI Waubant).