
Abstract
Background:
Optical coherence tomography (OCT) is a biomarker of neuroaxonal loss in multiple sclerosis (MS).
Objective:
The objective was to assess the relative role of OCT, next to magnetic resonance imaging (MRI) and serum markers of disability in MS.
Methods:
A total of 100 patients and 52 controls underwent OCT to determine peripapillary retinal nerve fiber layer (pRNFL) and ganglion cell-inner plexiform layers (GCIPL). Serum neurofilament light chain (sNfL), total lesion volume (TLV), and brain parenchymal fraction (BPF) were also assessed. The associations of OCT with disability were examined in linear regression models with correction for age, vision, and education.
Results:
In patients, pRNFL was associated with the Symbol Digit Modalities Test (SDMT; p = 0.030). In the multivariate analysis including sNfL and MRI measures, pRNFL (β = 0.19, p = 0.044) and TLV (β = −0.24, p = 0.023) were the only markers associated with the SDMT. pRNFL (p < 0.001) and GCIPL (p < 0.001) showed associations with the Expanded Disability Status Scale (EDSS). In the multivariate analysis, GCIPL showed the strongest association with the EDSS (β = −0.32, p < 0.001) followed by sNfL (β = 0.18, p = 0.024).
Conclusion:
The associations of OCT measures with cognitive and physical disability were independent of serum and brain MRI markers of neuroaxonal loss. OCT can be an important tool for stratification in MS, while longitudinal studies using combinations of biomarkers are warranted.
Introduction
Neuroaxonal loss in the central nervous system (CNS) is probably the most relevant pathological substrate of disability in multiple sclerosis (MS). 1 However, this process is difficult to quantify in vivo. One candidate is magnetic resonance imaging (MRI) and particularly volumetric measures, since several studies showed associations of brain atrophy with disability in MS. 2 However, brain volumetric measures could not yet be established at a large scale as markers in clinical routine and individualized prognostic algorithms, due to technical and biological factors that cause large measurement variability. 2 Another candidate, the serum neurofilament light chain (sNfL), can be measured easily in vivo and rises upon neuroaxonal damage. 3 Several studies showed associations of sNfL with disability progression and cognitive disability in MS.3–6 However, sNfL also reflect neuroinflammatory activity in MS,7–9 while high levels were described in aging and other diseases of the central and peripheral nervous system. 10
Thus, there is an urgent need for markers of CNS neuroaxonal loss in MS, which combine high accuracy with the possibility for integration in individualized algorithms in clinical routine. Such markers could be obtained by the optical coherence tomography (OCT), which quickly produces individual results regarding the thickness/volume of retinal layers and has high intra- und inter-rater reliability. 11 The ganglion cell-inner plexiform layer (GCIPL) and the retinal nerve fiber layer (RNFL) contain neurons and axons of the visual pathway, respectively. Thinning of these layers is well described in MS and probably reflects neurodegeneration in the entire CNS. 12
Previous studies showed associations of OCT measures with physical and cognitive disability in MS.13–19 However, data on the relative role of OCT, next to other established markers of neuroaxonal loss, are limited. Thus, we aimed at studying the relative role of OCT as a marker of cognitive and physical disability, compared to serum (sNfL) and brain MRI measures (lesions, brain volume) in MS.
Methods
Study participants
We included 100 MS patients (relapsing remitting MS (RRMS) and progressive MS) and 52 healthy controls (HC).
Patients were recruited from a local cohort in the MS center at the University Hospital Basel (UHB). The inclusion criteria were as follows: (1) age ⩾18 years old, (2) eligibility for OCT (i.e. ability to fixate with each eye) and MRI (e.g. no claustrophobia), and (3) MS diagnosis according to the 2010 revised McDonald criteria. The exclusion criteria were as follows: (1) serious ophthalmological comorbidity (e.g. glaucoma), (2) refractive errors >6 diopter, and (3) bilateral optic neuritis (ON) history.
We recruited HC through advertisement (n = 21) and from an HC cohort from our MS center, which was created approximately 10 years ago (n = 31). All HC from this cohort were contacted again during 2017–2019 and invited to participate in this study. The inclusion criteria were as follows: (1) age ⩾18 years old, (2) negative history of neurological, ophthalmological, or psychiatric diseases, and (3) no refractive errors >6 diopter.
The characteristics of the study participants are presented in Table 1.
Characteristics of the study participants including OCT and measures of disability.
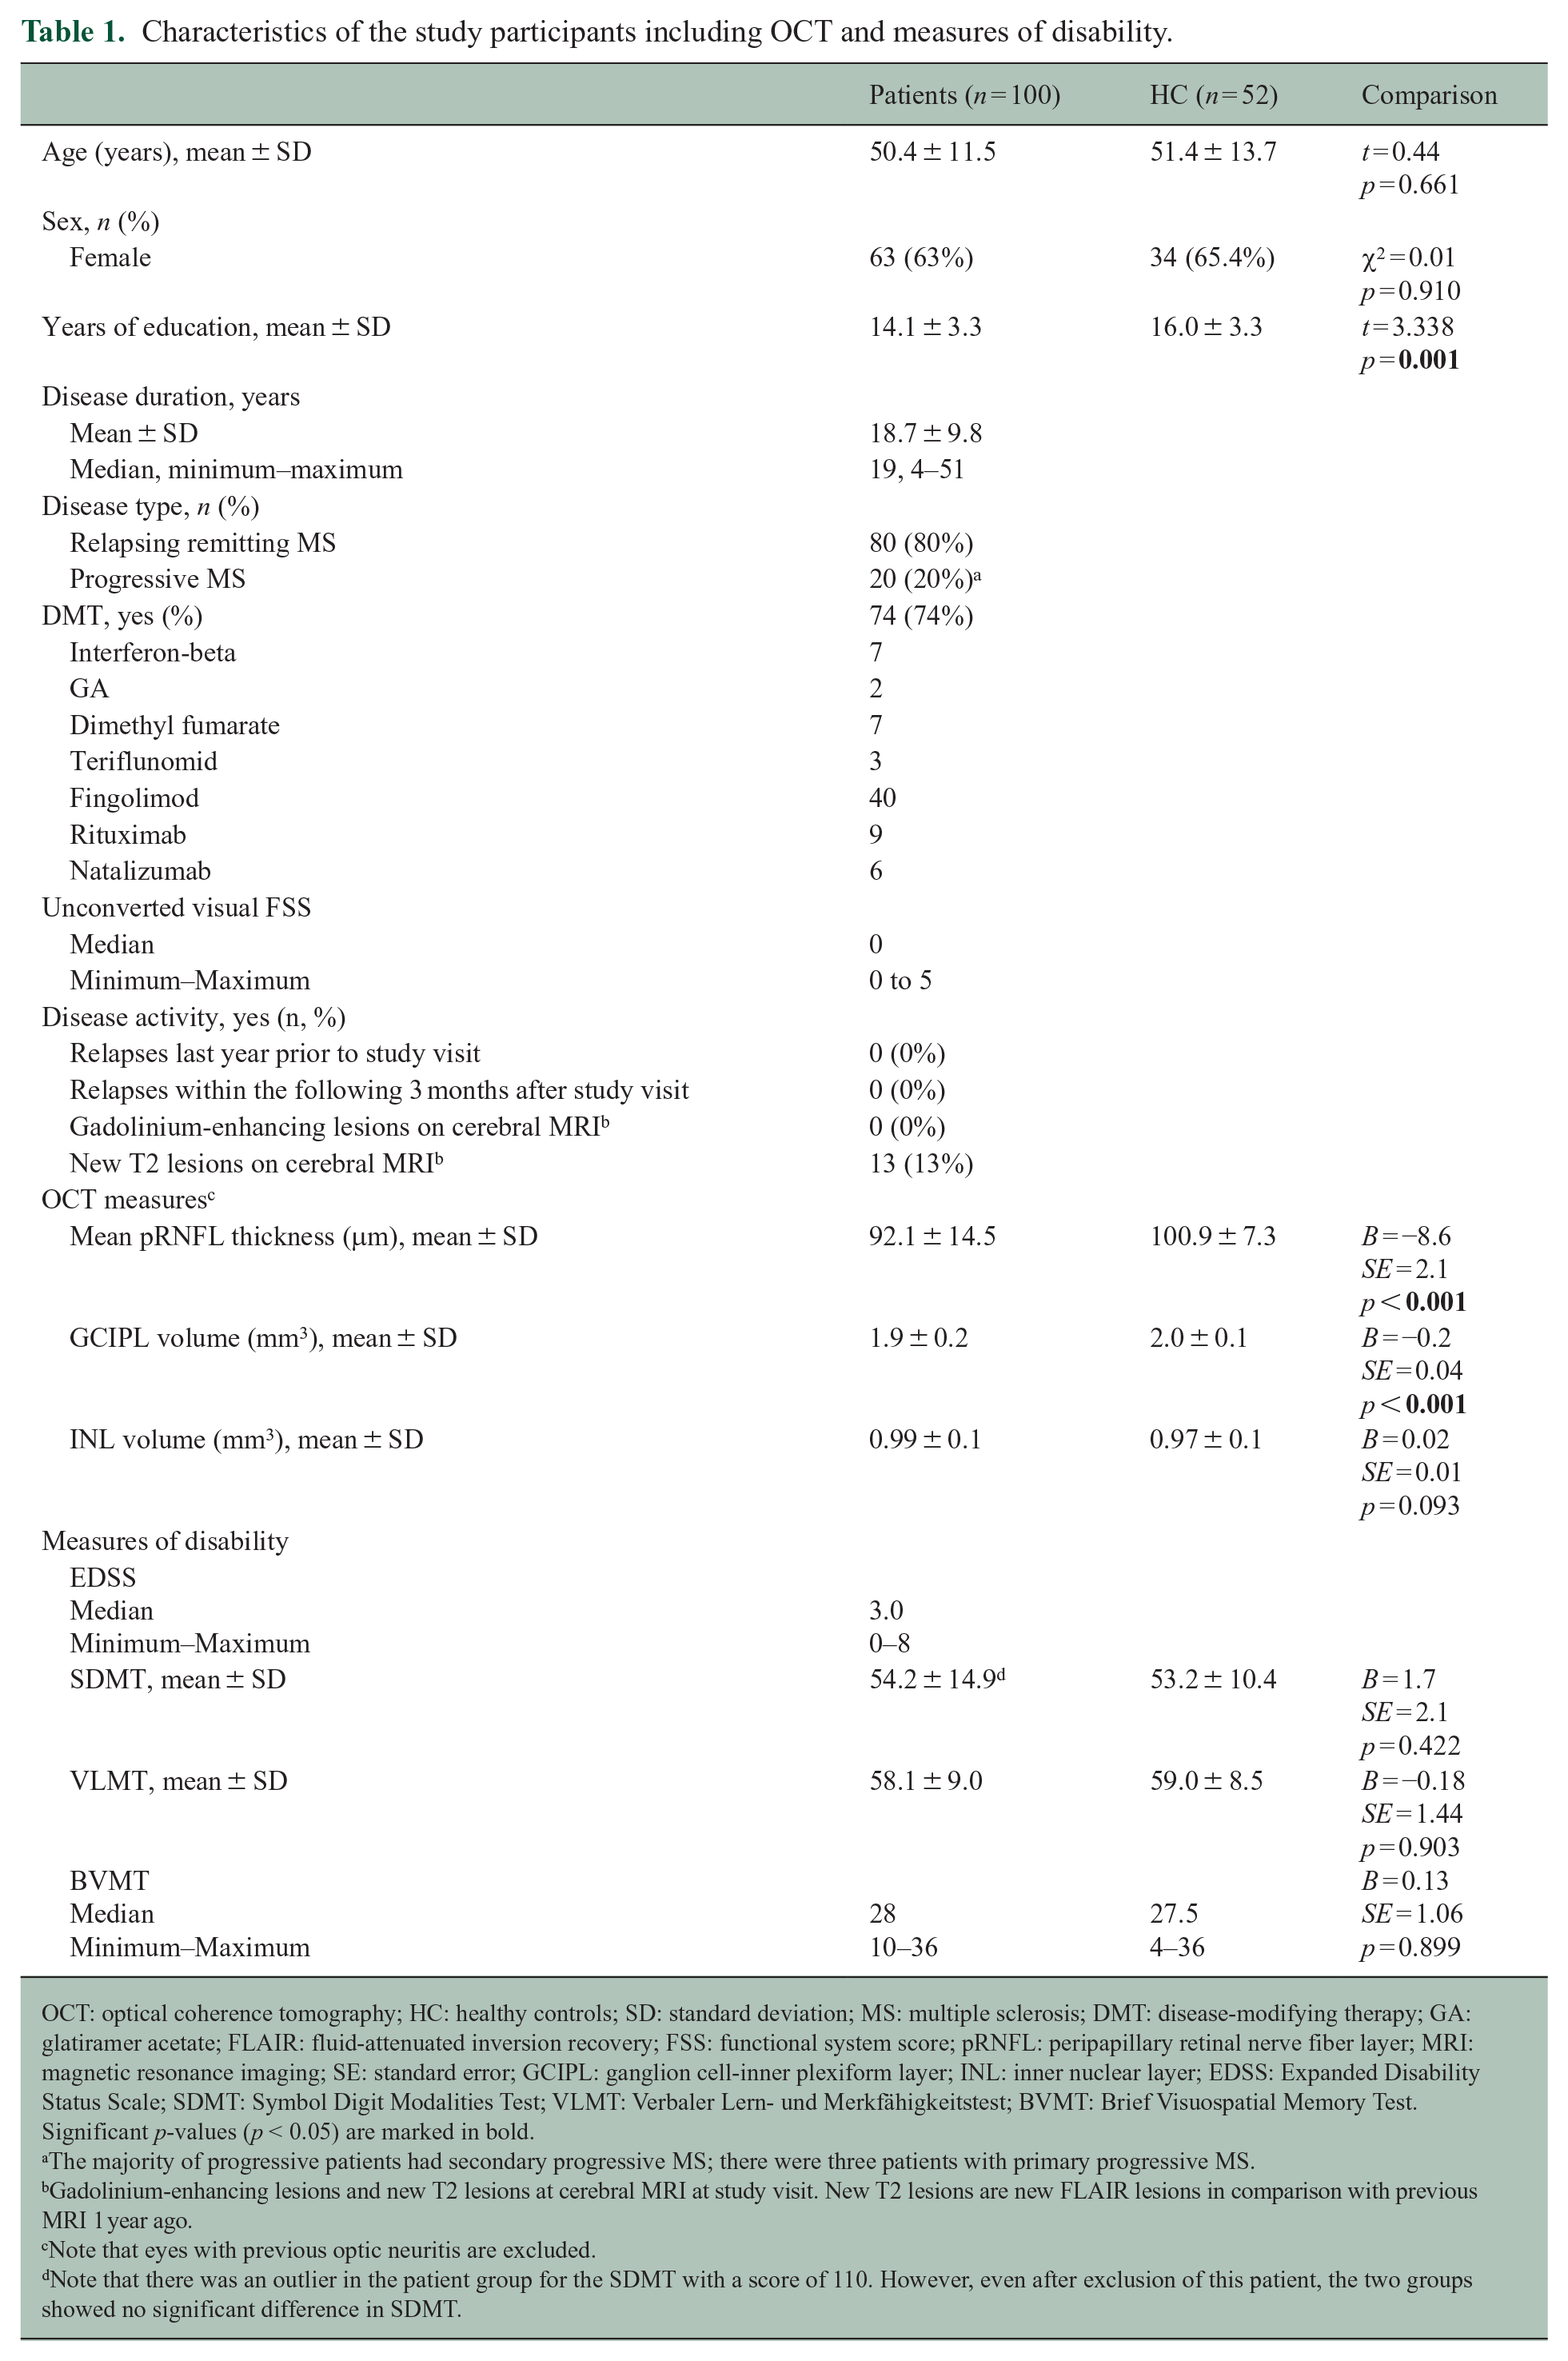
OCT: optical coherence tomography; HC: healthy controls; SD: standard deviation; MS: multiple sclerosis; DMT: disease-modifying therapy; GA: glatiramer acetate; FLAIR: fluid-attenuated inversion recovery; FSS: functional system score; pRNFL: peripapillary retinal nerve fiber layer; MRI: magnetic resonance imaging; SE: standard error; GCIPL: ganglion cell-inner plexiform layer; INL: inner nuclear layer; EDSS: Expanded Disability Status Scale; SDMT: Symbol Digit Modalities Test; VLMT: Verbaler Lern- und Merkfähigkeitstest; BVMT: Brief Visuospatial Memory Test.
Significant p-values (p < 0.05) are marked in bold.
The majority of progressive patients had secondary progressive MS; there were three patients with primary progressive MS.
Gadolinium-enhancing lesions and new T2 lesions at cerebral MRI at study visit. New T2 lesions are new FLAIR lesions in comparison with previous MRI 1 year ago.
Note that eyes with previous optic neuritis are excluded.
Note that there was an outlier in the patient group for the SDMT with a score of 110. However, even after exclusion of this patient, the two groups showed no significant difference in SDMT.
The study was approved by the local ethics committee (Ethikkommission Nordwest- und Zentralschweiz; 285/11) and conducted in accordance with the Declaration of Helsinki. All participants gave written informed consent before being included in the study.
All subjects underwent OCT, cognitive testing, and blood sampling (for patients: also clinical examination and brain MRI) usually at the same day (further details below). History of ON was assessed by standardized medical history.
Assessment of physical disability (EDSS)
Patients were examined by experienced neurologists in the MS center at the UHB. Physical disability was assessed using the Neurostatus-Expanded Disability Status Scale (EDSS). Vision was assessed by the visual unconverted functional system score (FSS). We divided patients into those with low EDSS (EDSS ⩽3.5) and high EDSS (EDSS ⩾4.0).
Assessment of cognitive disability (BICAMS)
All subjects underwent the cognitive evaluation by trained psychology students using the Brief International Cognitive Assessment for Multiple Sclerosis (BICAMS), 20 which consists of three tests: the Symbol Digit Modalities Test (SDMT, oral form) to evaluate information processing speed; the German version of the Rey Auditory Verbal Learning Test, known as “Verbaler Lern- und Merkfähigkeitstest” (VLMT 21 ), to evaluate verbal memory; and the Brief Visuospatial Memory Test (BVMT), to evaluate visual memory. VLMT and BVMT were missing in three patients. A test was considered impaired if the score was at least 1.5 SD below the average of the HC. 14
OCT
All participants underwent OCT at the same day as the BICAMS and the EDSS assessments, except for two cases (one HC who underwent the OCT 9 days and one patient 3 months after the clinical assessment; we included this patient, since she had no history of ON since the clinical visit).
OCT was performed on a Heidelberg Engineering Spectralis device (Heidelberg, Germany), in a dark room, without pupil dilation. The mean peripapillary RNFL (pRNFL), the volume of the GCIPL, and the inner nuclear layer (INL) volume were used in the analysis. Details regarding the OCT scanning protocol are given as Supplemental material.
Eyes with history of ON (n = 35) were excluded, since the pronounced local damage would be a confounder to our analysis. For patients with unilateral ON, we included only the non-affected eye and for the rest, we took the average values of both eyes.
MRI: assessment of brain volume and TLV in MS patients
Most patients underwent a brain MRI the same day as the clinical examination and BICAMS.
MRI examinations were performed in the Clinic of Radiology at the UHB in a 3 Tesla Scanner (Skyra; Siemens, Erlangen, Germany). The details of the protocol are given as Supplemental material.
MS lesions were automatically segmented on the fluid-attenuated inversion recovery (FLAIR) sequence with the deep learning-based tool MD-GRU (Multi-dimensional Gated Recurrent Units) 22 and manually corrected by one experienced rater. Brain measurements for patients were obtained with FreeSurfer (v. 6.0.0) after white matter (WM) lesion filling and the brain parenchymal fraction (BPF) were calculated (gray matter (GM) volume + WM volume/estimated total intracranial volume). FreeSurfer reconstructions were manually checked and corrected. Four MRIs could not be analyzed with FreeSurfer due to image quality.
Neurofilament light chain in serum
Most subjects underwent blood sampling at the same day as the BICAMS; in eight patients, the blood sample was collected within a maximum period of 12 days, and in four HC, within a maximum period of 5 days. sNfL levels were missing in four patients.
The sNfL concentration for this study was measured in the MS center at the UHB. Operators blinded to clinical data performed the analysis using a highly sensitive single-molecule array (SimoaTM) immunoassay. 8
Statistical analysis
Group comparisons between patients and HC were investigated using t test (age), chi-square test (sex), and linear regression models (LRM) with correction for age, sex, and education (cognitive tests). Correlations were assessed with the Pearson test for normally distributed variables and the Spearman test for non-normally distributed variables. For non-normally distributed measures (EDSS, FSS, total lesion volume (TLV), BVMT, and sNfL), we used the log10. In addition, for sNfL, we used age-adjusted Z scores based on a large HC cohort. 8
The associations of OCT measures with disability were assessed through multivariate LRM, including age, sex (for the EDSS, since male sex is usually associated with higher disability in MS), education (for cognitive tests), and unconverted visual FSS (for EDSS, SDMT, and BVMT, as these rely on vision). In these models, OCT measures (GCIPL, INL, and pRNFL) were included separately as independent variables (three models) to avoid collinearity problems. Besides, we performed logistic regression models to examine the associations between OCT measures and group (SDMT impaired vs. non-impaired; EDSS low vs. high)
Finally, we used multivariate LRM that included age, sex (for EDSS), unconverted visual FSS, education (for SDMT), and OCT measures next to the other biomarkers: sNfL, BPF, and TLV. For cognition, we focused on the SDMT. In the SDMT model, we included pRNFL (it was associated with the SDMT in the LRM with correction for vision), and in the EDSS model, we included GCIPL (it showed the strongest correlation with the EDSS). Standardized betas were calculated. We checked for collinearity in the models using the variance inflation factor (VIF) and considered a cut-off value of 3. No model had to be excluded due to collinearity among the independent variables (VIF for SDMT model ranging from 1.1 to 2.1 and for the EDSS model: 1.1–1.9). Moreover, we performed a sensitivity analysis in the subgroup of patients with no MRI activity (no new MRI lesions compared to the previous MRI from the last year), to ensure that the results were not driven by active patients.
Missing values were not considered for specific statistical tests, but the entire patient data were included in the analysis. For the entire analysis, statistical significance was set at p < 0.05 (without correction). All statistical analysis was performed using R 23 version 4.1.3 with packages: ellipsis, pastecs, readxl, ggplot2, car and lm.beta.
Data availability
The data of this study are available from the corresponding author upon reasonable request.
Results
OCT and cognitive disability
Patients showed lower mean pRNFL thickness and GCIPL volume than HC, but there was no difference in the INL volume (Table 1).
There were no overall group differences regarding the cognitive tests (Table 1). When looking at the classification of patients, we found the largest proportions of impairment for the SDMT (13/100, 13%), followed by the VLMT (9/97 patients, 9.3%) and BVMT (8/97, 8.2%).
In patients, we observed correlations between pRNFL and GCIPL with the SDMT as well as the BVMT, but not with the VLMT (Supplemental Table 1 and Figure 1).
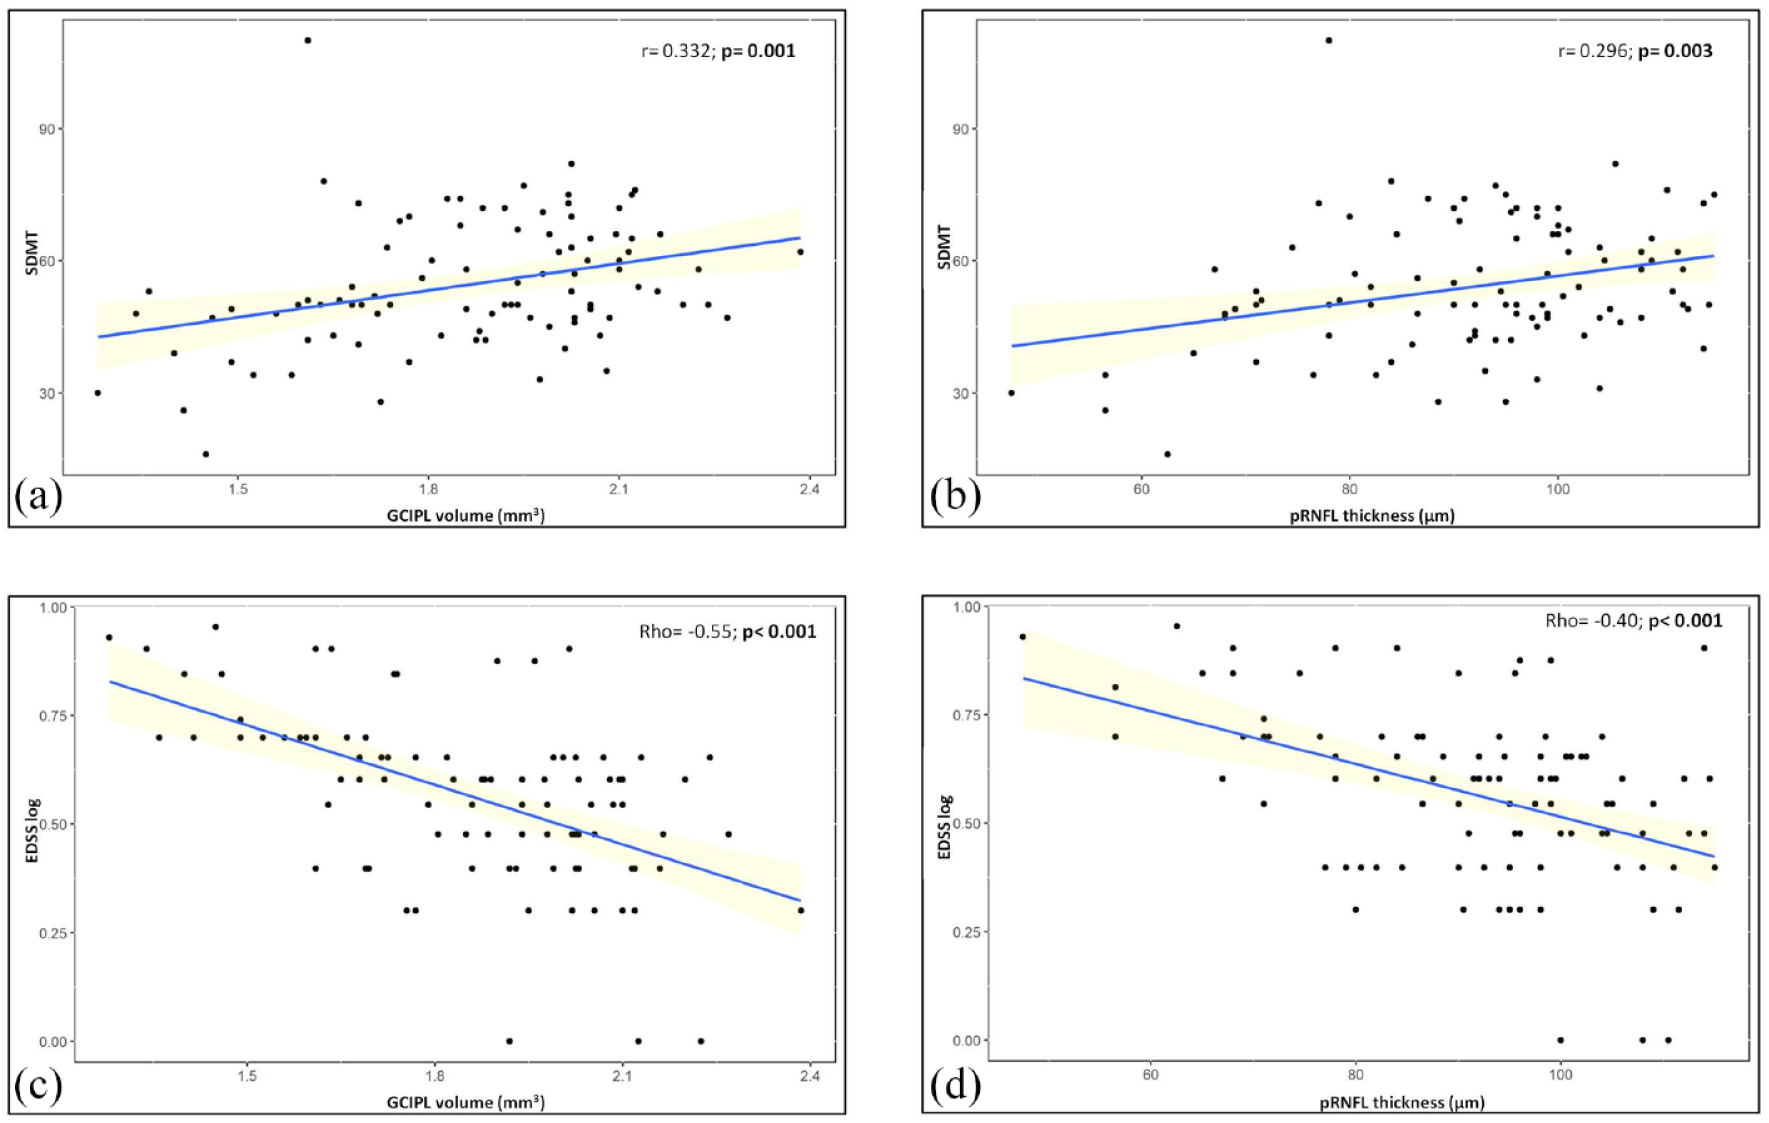
Correlations between OCT measures of neuroaxonal loss and measures of disability.
In the multivariate analyses with adjustment for age, visual function, and education, the association of pRNFL with the SDMT remained (p = 0.030; Supplemental Table 2). In line with this, we found lower mean pRNFL thickness and GCIPL volumes in patients who were impaired in the SDMT (Table 2, Figure 2). Of note, all patients with mean pRNFL thickness of <65 μm were impaired in SDMT (Figure 2).
Associations of OCT measures with impairment in the SDMT and with the EDSS group.
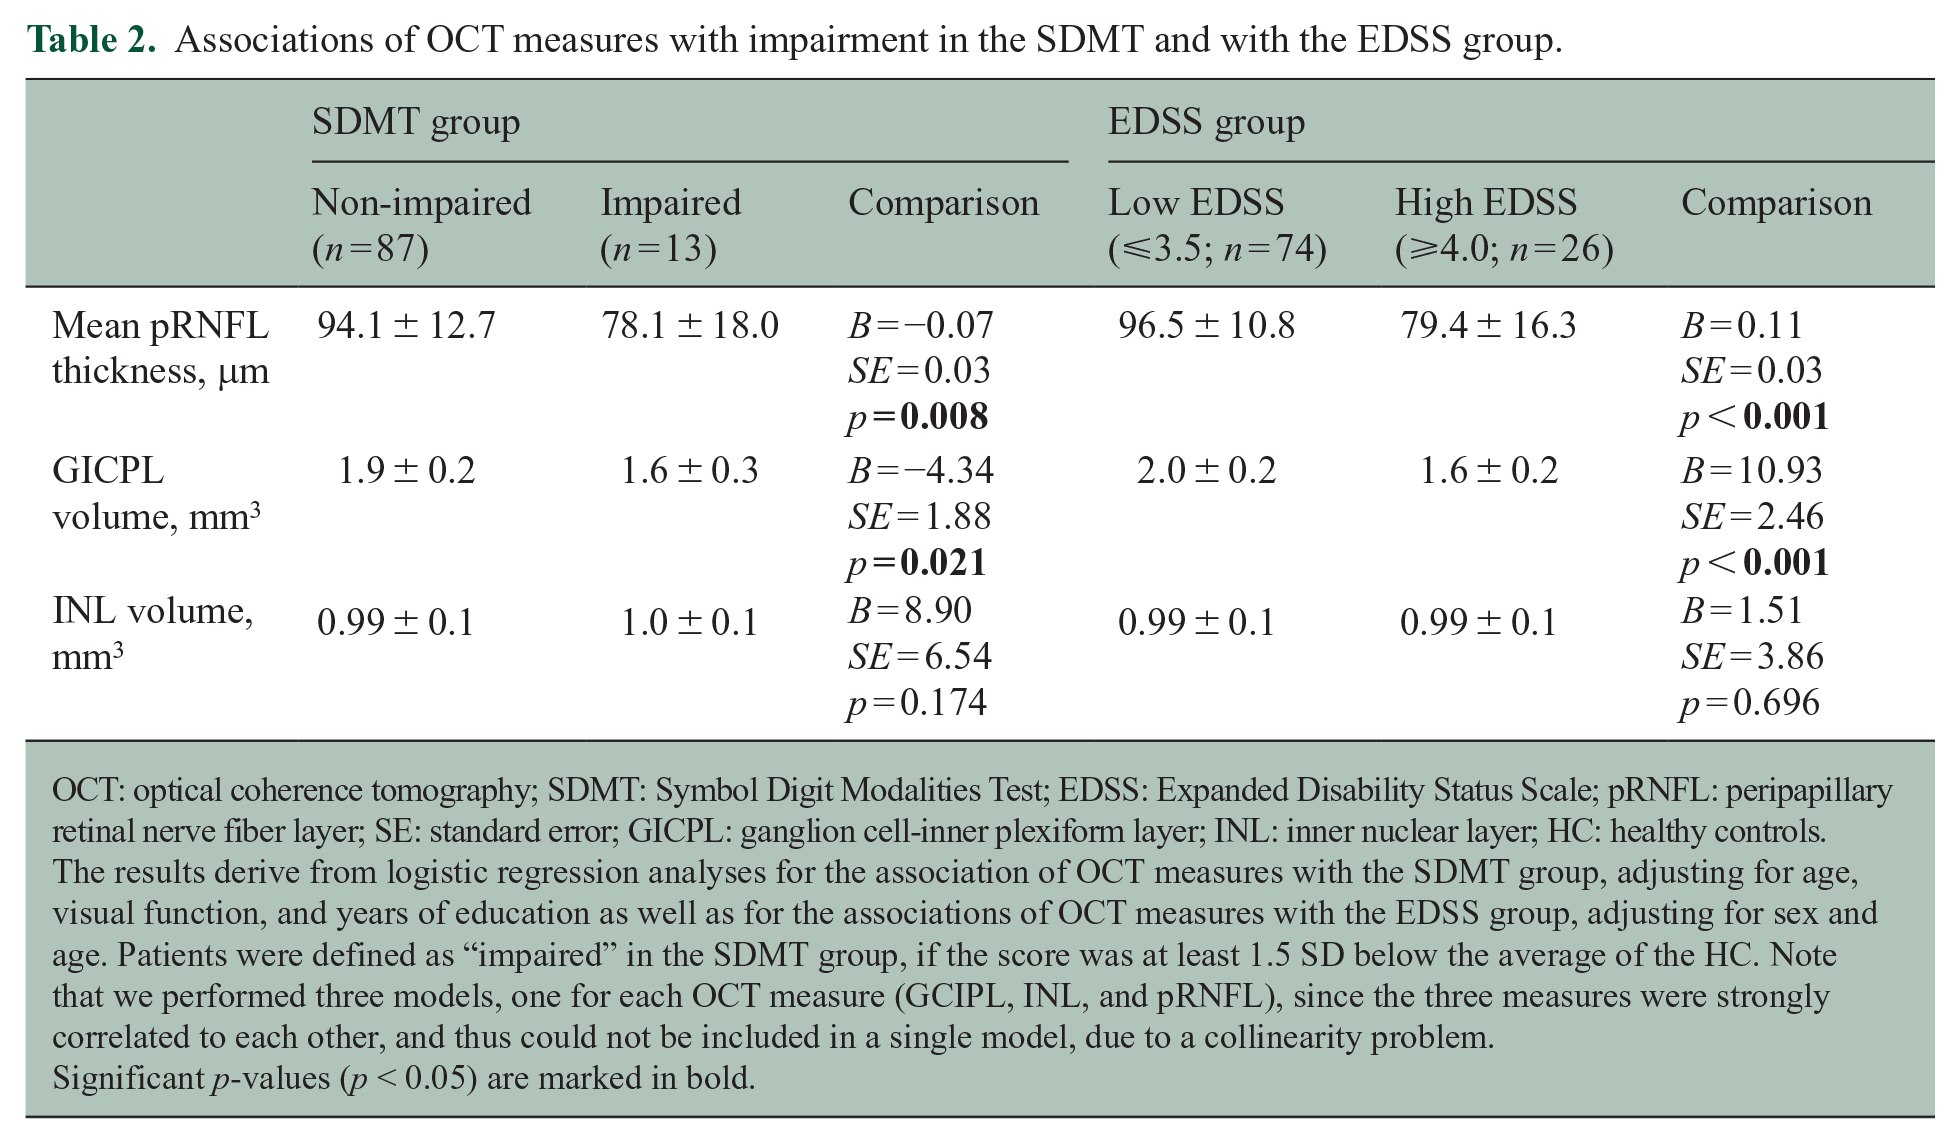
OCT: optical coherence tomography; SDMT: Symbol Digit Modalities Test; EDSS: Expanded Disability Status Scale; pRNFL: peripapillary retinal nerve fiber layer; SE: standard error; GICPL: ganglion cell-inner plexiform layer; INL: inner nuclear layer; HC: healthy controls.
The results derive from logistic regression analyses for the association of OCT measures with the SDMT group, adjusting for age, visual function, and years of education as well as for the associations of OCT measures with the EDSS group, adjusting for sex and age. Patients were defined as “impaired” in the SDMT group, if the score was at least 1.5 SD below the average of the HC. Note that we performed three models, one for each OCT measure (GCIPL, INL, and pRNFL), since the three measures were strongly correlated to each other, and thus could not be included in a single model, due to a collinearity problem.
Significant p-values (p < 0.05) are marked in bold.
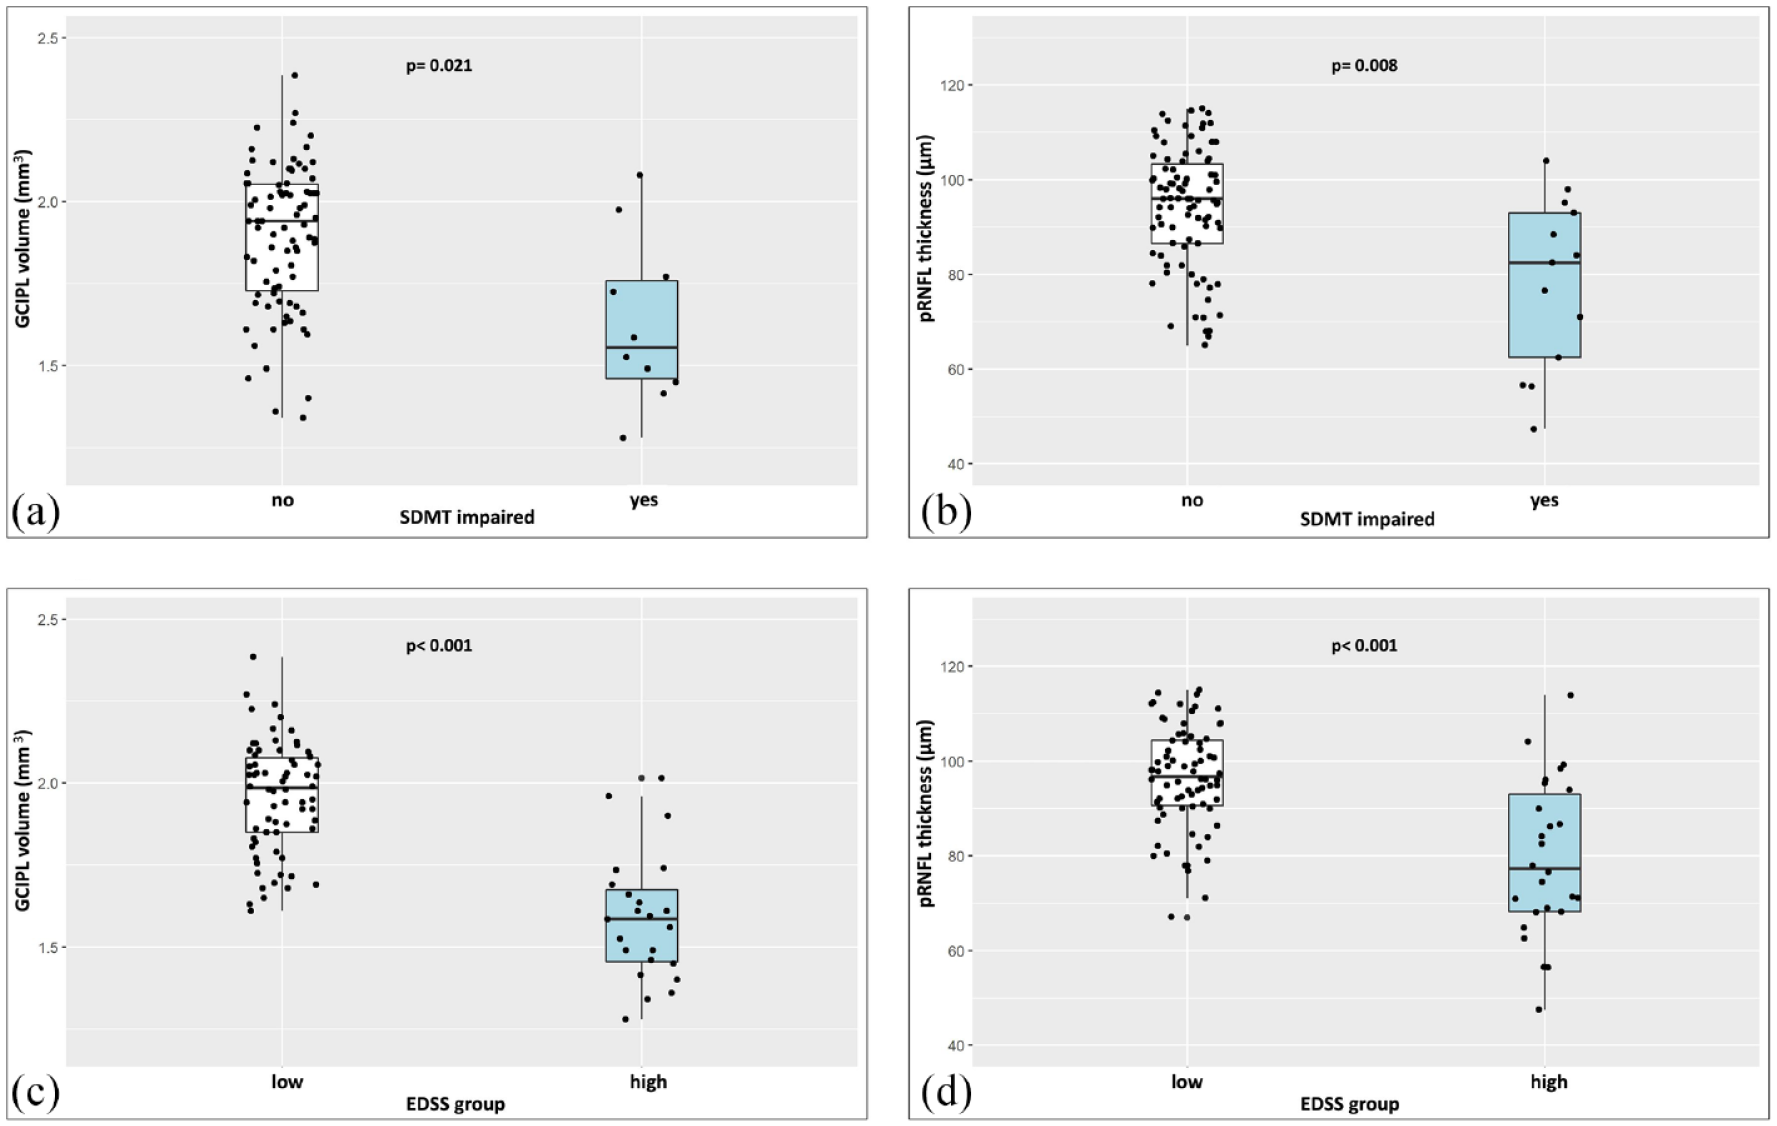
OCT measures of neuroaxonal loss in patients according to the SDMT and EDSS group.
Finally, in HC, we found no associations between the OCT measures and the SDMT (Supplemental Table 3).
OCT and physical disability (EDSS)
Mean pRNFL thickness and GCIPL volume correlated with the logEDSS (p < 0.001, ρ = −0.40 and p < 0.001, ρ = −0.55, respectively, Figure 1). In the multivariate analysis, with adjustment for sex, age, and visual function, the associations remained significant (Supplemental Table 2). INL was not associated with the EDSS (Supplemental Table 2).
Patients with high EDSS (⩾4.0) had lower mean pRNFL thickness and GCIPL volume than patients with low EDSS (Table 2, Figure 2). All patients with a mean pRNFL thickness of <65 μm had high EDSS, as well as all patients with a GCIPL volume of <1.60 mm3 (Figure 2).
OCT is associated with physical and cognitive disability independently of the other markers
The correlations of OCT with the other markers (sNfL, MRI-based) are summarized in Table 3. We found associations of pRNFL and GCIPL both with BPF and TLV, but not with sNfL (Table 3).
Correlations of OCT with sNfL and MRI measures in patients.
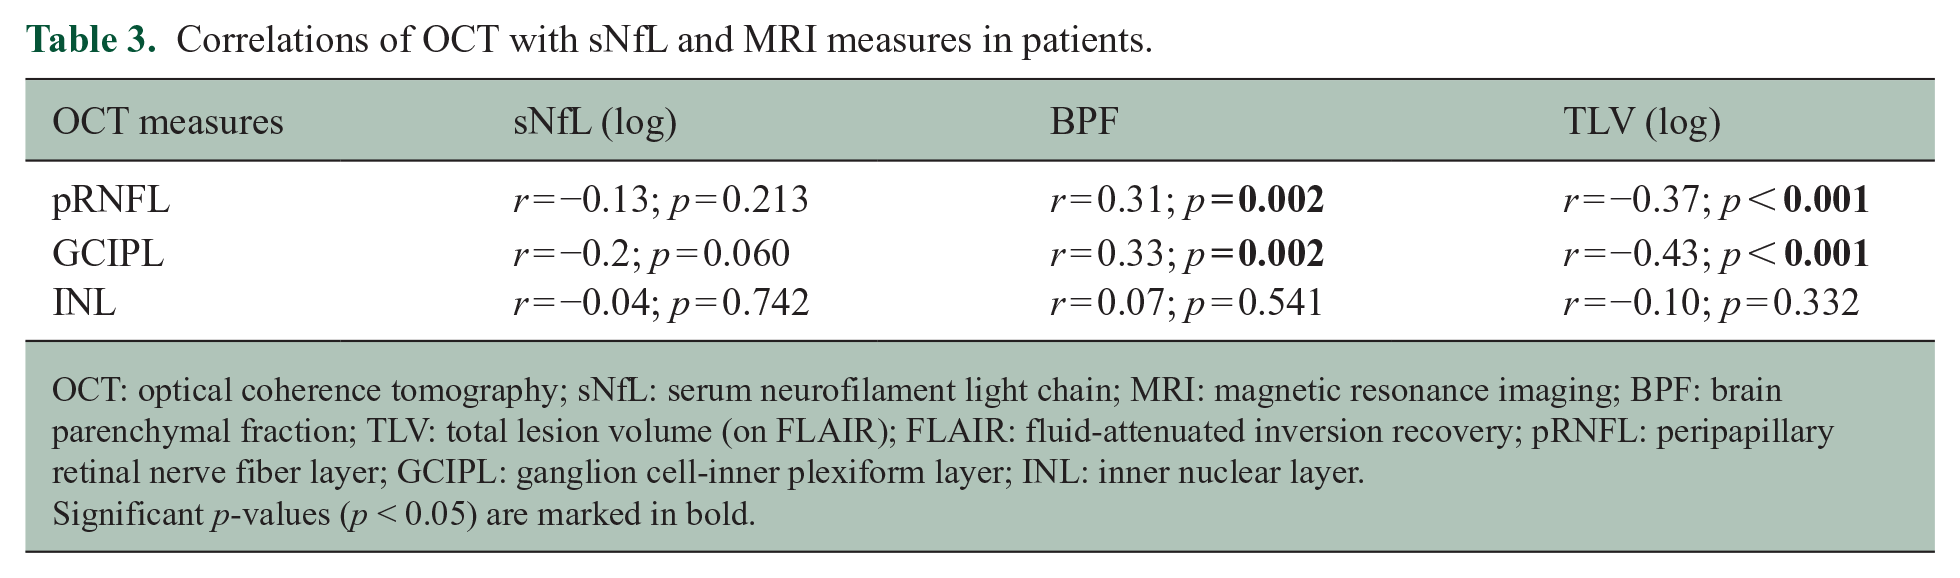
OCT: optical coherence tomography; sNfL: serum neurofilament light chain; MRI: magnetic resonance imaging; BPF: brain parenchymal fraction; TLV: total lesion volume (on FLAIR); FLAIR: fluid-attenuated inversion recovery; pRNFL: peripapillary retinal nerve fiber layer; GCIPL: ganglion cell-inner plexiform layer; INL: inner nuclear layer.
Significant p-values (p < 0.05) are marked in bold.
In the multivariate analysis including serum and MRI markers, pRNFL thickness was associated with the SDMT, independently of sNfL, BPF, and TLV (Table 4). The variables with the strongest association with the SDMT were age (standardized β = −0.40; p < 0.001) and TLV (β = −0.24; p = 0.023), followed by mean pRNFL thickness (β = 0.19; p = 0.044) and visual FSS (β = −0.19; p = 0.039). The latter highlights the importance of adjustment for visual dysfunction, since the SDMT depends on vision. sNfL and BPF were not significantly associated with the SDMT in this model, which explained 40% of the variance in SDMT (Table 4).
Multivariate models to assess the associations of OCT, next to sNfL and MRI markers with the SDMT and the EDSS.
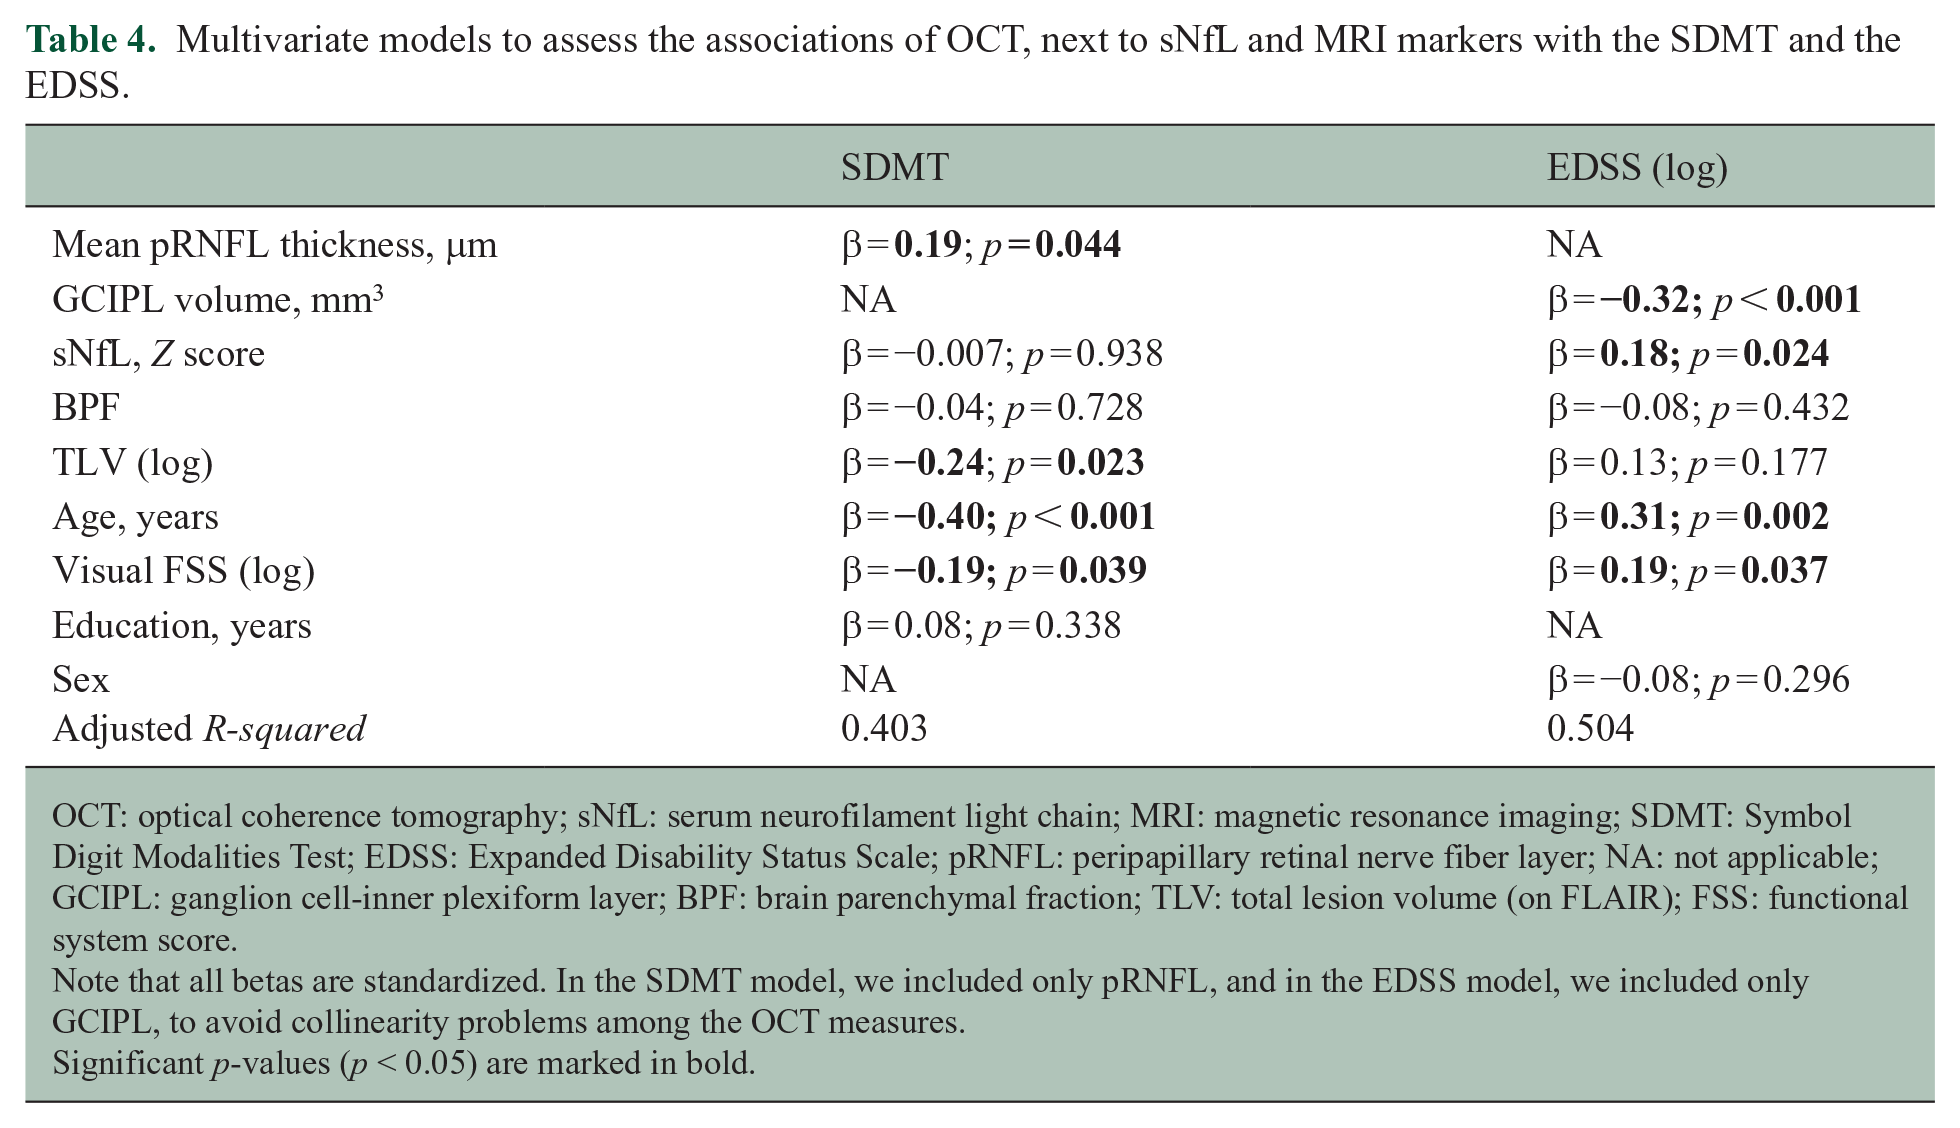
OCT: optical coherence tomography; sNfL: serum neurofilament light chain; MRI: magnetic resonance imaging; SDMT: Symbol Digit Modalities Test; EDSS: Expanded Disability Status Scale; pRNFL: peripapillary retinal nerve fiber layer; NA: not applicable; GCIPL: ganglion cell-inner plexiform layer; BPF: brain parenchymal fraction; TLV: total lesion volume (on FLAIR); FSS: functional system score.
Note that all betas are standardized. In the SDMT model, we included only pRNFL, and in the EDSS model, we included only GCIPL, to avoid collinearity problems among the OCT measures.
Significant p-values (p < 0.05) are marked in bold.
In the multivariate analysis with the EDSS as a dependent variable, GCIPL showed a significant negative association, independently of sNfL, BPF, and TLV (Table 4). GCIPL showed the strongest association with the EDSS (standardized β = −0.32; p < 0.001), followed by age (β = 0.31; p = 0.002), visual FSS (β = 0.19; p = 0.037), and sNfL (β = 0.18; p = 0.024). The model explained 50% of the variance in EDSS (Table 4).
The sensitivity analysis excluding patients with MRI activity (n = 13) showed similar results: mean pRNFL thickness (β = 0.22; p = 0.038), TLV (β = −0.29; p = 0.019), and age (β = −0.34; p = 0.007) remained associated with the SDMT, while GCIPL volume (β = −0.35; p < 0.001), sNfL (β = 0.18; p = 0.049), and age (β = 0.30; p = 0.005) were associated with the EDSS.
Discussion
We investigated associations of OCT measures with cognitive and physical disability in MS, compared to other serum and MRI markers of neuroaxonal loss. We found that pRNFL and GCIPL were associated with impairment in the SDMT and higher EDSS, respectively, independently of confounders like visual dysfunction, education, and age. Moreover, the associations of pRNFL with the SDMT and of GCIPL with the EDSS were independent of sNfL, brain volume, and TLV. Among all used markers (OCT, sNfL, and MRI-based), TLV showed the strongest association with the SDMT, followed by pRNFL, while GCIPL showed the strongest association with the EDSS, followed by sNfL. These findings highlight the independent role of OCT measures as markers of cognitive and physical disability in MS.
To our knowledge, this is the first study including, next to OCT measures, also MRI-based and serum biomarkers to assess their relative associations with disability in MS. There are limited data on the relative (or additive) role of OCT versus other markers in predicting disability in MS, since most studies focused on OCT alone.13–19 One recent study showed that pRNFL thickness and GCIPL volume outperformed MRI measures (BPF, GM and WM fraction, and spinal cord area) in predicting the EDSS, 24 in line with our study, which also included a serum biomarker. Another prior study described that the combination of OCT measures with sNfL in patients with clinically isolated syndrome and early MS was associated with a higher risk of future disease activity than each parameter alone. 25 We also found that sNfL played an additive value next to GCIPL as markers of higher EDSS.
The associations of pRNFL and GCIPL with the SDMT in our study are in line with previous findings.13–16 While one study 19 reported RNFL thickness to be associated with performance in the “Trail Making Test” of attention and executive functions, but not with the SDMT, most studies showed associations between pRNFL and the SDMT cross-sectionally13,14,16 and longitudinally. 15 Coric et al. 14 also reported associations between GCIPL and cognitive impairment in multiple domains. However, these prior studies did not report correction for vision in the analysis.13–17,19,24,26 This is highly relevant, since OCT measures are strongly associated with visual function in MS 12 and the SDMT is a test that also depends on vision. Indeed, in our analysis, we saw a significant association between the visual FSS and the SDMT, but the pRNFL–SDMT association remained after adjustment for vision. Similarly, the visual FSS can also have an impact on the EDSS score, but the associations of the OCT measures with the EDSS remained after adjustment for visual FSS in our study. Thus, our findings underline that the relationship between OCT and cognitive (SDMT) as well as physical disability (EDSS) is independent of visual dysfunction in MS patients.
Our OCT associations with SDMT and EDSS remained also after adjustment for brain MRI measures (BPF and TLV). This may seem surprising, since the OCT measures are associated with disability in MS probably indirectly, due to the close relationship between neuroaxonal loss in the retina and the entire CNS, 12 particularly the GM, as was previously described also in a subgroup of our cohort. 27 In case of the SDMT, both TLV and pRNFL showed significant associations, which underlines the relationship between T2 lesions and SDMT in MS. 28 In case of the EDSS, only GCIPL, but neither TLV nor BPF, was significantly associated in the multivariate analysis. One possible explanation is that GCIPL thinning may reflect neurodegeneration more specifically than volume loss in the entire brain, due to the retinal anatomy, with less “clinically silent” tissue compared to the brain. 29 Of note, severe loss and shrinking of retinal ganglion cells has been described also in a histopathological, post-mortem study across all MS disease stages. 30 The compact structure of the retina (particularly the GCIPL) 31 may be an advantage in capturing neuroaxonal loss, compared to the entire brain, with its larger size as well as more variable structure and shape. However, it might be argued that we only adjusted our analysis for a global brain volume measure and not for regional measures of GM loss, as more specific markers of neurodegeneration and disability in MS. Still, considering the quick, patient-friendly OCT performance and the minimal post-processing needed, compared to volumetric MRI analysis, as well as the high reproducibility of OCT measures, 11 our findings highlight their value as markers of disability in MS.
Few studies investigated the relationship between OCT measures and sNfL in MS. Tavazzi et al. 32 described cross-sectional associations of sNfL with pRNFL and GCIPL. Moreover, in a 3-year longitudinal study in RRMS, increased sNfL levels were associated with the annual reduction of pRNFL. 33 Our study was cross-sectional and did not detect associations between the OCT measures and sNfL. Since pRNFL and GCIPL mostly reflect neurodegeneration in MS, but sNfL elevations also depend on the inflammatory disease activity,7–9 further studies combining OCT with other serum biomarkers (e.g. the glial fibrillary acidic protein, GFAP) are warranted.
INL was not associated with disability in our study, although patients showed a trend for higher INL volumes than HC. INL thickening might reflect inflammatory disease activity.34,35 Our results are in line with a prior cross-sectional study, where INL also did not show an association with physical disability, measured by the EDSS. 24 Saidha et al. 35 showed that a higher baseline INL thickness may predict EDSS progression longitudinally, but our study was only cross-sectional. The exact role of INL in prognostic algorithms in MS (regarding disease activity and disability progression) remains to be defined in larger, longitudinal studies.
The main strength of our study is the use of multiple biomarkers (OCT, sNfL, and MRI-based). However, there are some limitations to mention; the most important is the lack of longitudinal evaluation. Furthermore, we assessed high but not low contrast visual acuity, while we did not include measures of spinal cord or GM volume. Finally, we only included a screening cognitive battery (BICAMS), rather than a comprehensive neuropsychological testing. However, BICAMS is a well-established battery in MS, reflecting the most frequently affected cognitive domains. 20 Of note, we have excluded eyes with history of ON from our analysis, but we can never exclude completely the possibility that our patients had subclinical optic nerve demyelination/axonal loss. However, our data suggest that OCT measures can be global markers of disability, even if such patients are included.
To conclude, our findings underline the important and independent role of OCT measures as markers of cognitive and physical disability in MS compared to serum and brain MRI markers. Longitudinal studies including OCT, serum, and brain imaging measures are warranted to detect their optimal combination for individual risk stratification of MS patients.
Supplemental Material
sj-docx-1-msj-10.1177_13524585231198760 – Supplemental material for Optical coherence tomography versus other biomarkers: Associations with physical and cognitive disability in multiple sclerosis
Supplemental material, sj-docx-1-msj-10.1177_13524585231198760 for Optical coherence tomography versus other biomarkers: Associations with physical and cognitive disability in multiple sclerosis by Nuria Cerdá-Fuertes, Marc Stoessel, Gintaras Mickeliunas, Silvan Pless, Alessandro Cagol, Muhamed Barakovic, Aleksandra Maleska Maceski, Cesar Álvarez González, Marcus D’ Souza, Sabine Schaedlin, Pascal Benkert, Pasquale Calabrese, Konstantin Gugleta, Tobias Derfuss, Till Sprenger, Cristina Granziera, Yvonne Naegelin, Ludwig Kappos, Jens Kuhle and Athina Papadopoulou in Multiple Sclerosis Journal
Supplemental Material
sj-docx-2-msj-10.1177_13524585231198760 – Supplemental material for Optical coherence tomography versus other biomarkers: Associations with physical and cognitive disability in multiple sclerosis
Supplemental material, sj-docx-2-msj-10.1177_13524585231198760 for Optical coherence tomography versus other biomarkers: Associations with physical and cognitive disability in multiple sclerosis by Nuria Cerdá-Fuertes, Marc Stoessel, Gintaras Mickeliunas, Silvan Pless, Alessandro Cagol, Muhamed Barakovic, Aleksandra Maleska Maceski, Cesar Álvarez González, Marcus D’ Souza, Sabine Schaedlin, Pascal Benkert, Pasquale Calabrese, Konstantin Gugleta, Tobias Derfuss, Till Sprenger, Cristina Granziera, Yvonne Naegelin, Ludwig Kappos, Jens Kuhle and Athina Papadopoulou in Multiple Sclerosis Journal
Footnotes
Acknowledgements
The authors thank all patients and controls who participated in the study, Alain Thoeny for the performance of the magnetic resonance imaging (MRI) scans of the controls as well as Marguerite Limberg and Nancy Wochnik for administrative support.
Declaration of Conflicting Interests
The author(s) declared the following potential conflicts of interest with respect to the research, authorship, and/or publication of this article: N. Cerdá-Fuertes, M. Stoessel, S. Pless, M. Barakovic, AM. Maceski, C. Álvarez González, S. Schaedelin, P. Benkert, and K. Gugleta report no disclosures relevant to the manuscript; G. Mickeliunas received research support from the Swiss Academy of Medical Sciences; A. Cagol is supported by EUROSTAR E!113682 HORIZON2020 and received speaker honoraria from Novartis; M. D’Souza received travel support from Bayer AG, Teva, and Genzyme and research support from the University Hospital Basel (USB); P. Calabrese has received honoraria for speaking at scientific meetings, serving at scientific advisory boards and consulting activities from Abbvie, Actelion, Almirall, Bayer-Schering, Biogen, EISAI, Lundbeck, Merck Serono, Novartis, Sanofi-Aventis and Teva. He also receives research Grants from the Swiss Multiple Sclerosis Society (SMSG), and the Swiss National Research Foundation; T. Derfuss received speaker fees, research support, travel support, and/or served on Advisory Boards, data safety monitoring boards, or Steering Committees of Actelion, Alexion, Celgene, Polyneuron, Novartis Pharma, Merck Serono, Biogen, Teva, Bayer-Schering, GeNeuro, Mitsubishi Pharma, MedDay, Roche, and Genzyme; T. Sprenger received research grants from the Swiss MS Society, Novartis Pharmaceuticals Switzerland, EFIC-Grünenthal grant, and Swiss National Science Foundation (SNSF). The current (DKD Helios Klinik Wiesbaden) or previous (USB) institutions of T. Sprenger have received payments for speaking or consultation from Biogen Idec, Eli Lilly, Allergan, Actelion, ATI, Mitsubishi Pharma, Novartis, Genzyme, and Teva; C. Granziera: The USB, as the employer of C. Granziera, has received the following fees which were used exclusively for research support: (1) advisory board and consultancy fees from Actelion, Genzyme-Sanofi, Novartis, GeNeuro, and Roche; (2) speaker fees from Genzyme-Sanofi, Novartis, GeNeuro, and Roche; and (3) research support from Siemens, GeNeuro, and Roche. C. Granziera is supported by the SNSF grant PP00P3_176984, the Stiftung zur Förderung der gastroenterologischen und allgemeinen klinischen Forschung, and the EUROSTAR E!113682 HORIZON2020; Y. Naegelin institution has received financial support for lectures from Teva and Celgene, grant support from Innosuisse (Swiss Innovation Agency), and grant support from Novartis and Roche; L. Kappos: institutional research support: steering committee, advisory board, consultancy fees: Actelion, Bayer HealthCare, Biogen, Bristol Myers Squibb, Genzyme, Janssen, Japan Tobacco, Merck, Novartis, Roche, Sanofi, Santhera, Shionogi, and TG Therapeutics, speaker fees: Bayer HealthCare, Biogen, Merck, Novartis, Roche, and Sanofi; support of educational activities: Allergan, Bayer HealthCare, Biogen, CSL Behring, Desitin, Genzyme, Merck, Novartis, Roche, Pfizer, Sanofi, Shire, and Teva; license fees for Neurostatus products; and grants: Bayer HealthCare, Biogen, European Union, Innosuisse, Merck, Novartis, Roche, Swiss MS Society, and Swiss National Research Foundation; J. Kuhle received speaker fees, research support, travel support, and/or served on advisory boards by Swiss MS Society, Swiss National Research Foundation (320030_189140/1 and 320030_212534/1), University of Basel, Progressive MS Alliance, Bayer, Biogen, Bristol Myers Squibb, Celgene, Merck, Novartis, Octave Bioscience, Roche, and Sanofi; A. Papadopoulou has consulted for Teva, received speaker fees from Sanofi-Genzyme and travel support from Bayer AG, Teva, UCB-Pharma AG, and Hoffmann La Roche. Her research was/is being supported by the University of Basel, the University Hospital of Basel, the Swiss MS Society, the Swiss National Science Foundation, and the “Stiftung zur Förderung der gastroenterologischen und allgemeinen klinischen Forschung sowie der medizinischen Bildauswertung.”
Funding
The author(s) disclosed receipt of the following financial support for the research, authorship, and/or publication of this article: This project was supported by Swiss Multiple Sclerosis Society and “Stiftung zur Förderung der gastroenterologischen und allgemeinen klinischen Forschung sowie der medizinischen Bildauswertung.”
ORCID iDs
Supplemental Material
Supplemental material for this article is available online.
References
Supplementary Material
Please find the following supplemental material available below.
For Open Access articles published under a Creative Commons License, all supplemental material carries the same license as the article it is associated with.
For non-Open Access articles published, all supplemental material carries a non-exclusive license, and permission requests for re-use of supplemental material or any part of supplemental material shall be sent directly to the copyright owner as specified in the copyright notice associated with the article.