
Abstract
Background:
Multiple sclerosis (MS) is a chronic autoimmune disease of the central nervous system characterized by two major and interconnected hallmarks: inflammation and progressive neurodegeneration.
Objective:
The aim of this work was to compare neurodegenerative processes, in the form of global and regional brain volume loss rates, in healthy controls (HCs) and in patients with relapsing MS (RMS) treated with ocrelizumab, which suppresses acute inflammation.
Methods:
Whole brain, white matter, cortical gray matter, thalamic, and cerebellar volume loss rates were assessed in 44 HCs that were part of a substudy in the OPERA II randomized controlled trial (NCT01412333) and 59 patients with RMS enrolled in the same substudy as well as age- and sex-matched patients in OPERA I (NCT01247324) and II. Volume loss rates were computed using random coefficients models over a period of 2 years.
Results:
Ocrelizumab-treated patients showed global and regional brain volume loss rates that were approaching that of HCs.
Conclusion:
These findings are consistent with an important role of inflammation on overall tissue loss and the role of ocrelizumab in reducing this phenomenon.
Introduction
Multiple sclerosis (MS) is a chronic autoimmune disease of the central nervous system (CNS) characterized by two major and interconnected hallmarks: inflammation and progressive neurodegeneration. Classically, disease-modifying therapies (DMTs) have targeted the former, with a focus on the reduction of accumulation of T1 gadolinium-enhancing and T2 hyperintense lesions in the white matter (WM). However, DMTs can slow the rate of brain volume loss, a result of neurodegeneration, pathologically associated with demyelination, decreased axonal count, and neuronal cell death. 1
Ocrelizumab is a humanized monoclonal antibody that selectively targets CD20+ B cells, while preserving the capacity for B-cell reconstitution and pre-existing humoral immunity.2,3 In phase 3 randomized, double-blind, double-dummy trials with identical designs [OPERA I (NCT01247324) and OPERA II (NCT01412333)] in relapsing multiple sclerosis (RMS), ocrelizumab demonstrated superior efficacy in preventing relapses and disability worsening compared with subcutaneous interferon β-1a (hereafter referred as interferon). 4 Significant benefits of ocrelizumab on magnetic resonance imaging (MRI) outcomes, including the almost complete suppression of T1 gadolinium-enhancing lesions and new/enlarging T2 lesions, and a significant reduction of brain volume loss were also reported. 4 In this specific situation, in which acute focal WM inflammation is essentially shut down, it is interesting to investigate whether global and regional brain volume loss is similar to the healthy aging rate, especially in an RMS population, where the portion of tissue loss due to focal WM inflammation and demyelination is unclear. 5 Previous work has been done to characterize healthy aging brain volume loss rates, with the aim of establishing pathologic cut-offs;6,7 however, a direct comparison across studies is unattainable since some factors that are used to measure atrophy and that heavily influence the evaluation of brain volume changes, such as MRI acquisition protocol and processing, are different across studies. There remains a fundamental gap in understanding brain volume loss rates under anti-CD20 therapies, where acute inflammation is nearly absent.
In this context, this study aimed to compare the global and regional volume loss rates between healthy controls (HCs) and age- and sex-matched ocrelizumab-treated patients with RMS enrolled in the same trial, acquired with the same protocol and followed-up for 2 years.
Materials and methods
Subjects
Forty-four HCs together with 59 patients with RMS were recruited at the University of British Columbia (UBC) as part of a substudy of OPERA II (NCT01412333). 4 Briefly, key eligibility criteria included an age of 18–55 years, MS diagnosis according to 2010 revised McDonald criteria, 8 screening Expanded Disability Status Scale score of 0.0–5.5, and at least two relapses within the 2 years prior to screening or one relapse in the year prior to screening. 4 Following completion of the 96-week double-blind period, patients entered the open-label extension (OLE) period, maintaining or switching to ocrelizumab. HCs with no previous history of neurologic disease were recruited at the same site, age- and sex-matched at the population level, and scanned using the same MRI acquisition protocol as the patients with RMS. The UBC Clinical Research Ethics Board approved the trial and the substudy protocol (H11-02278), and all patients provided written informed consent.
MRI protocol and assessments
All MRI scans were performed on a Philips 3T Achieva scanner (Best, the Netherlands) using an eight-channel head radio frequency array coil and the protocol included: a 3D-T1–weighted gradient echo scan [repetition time (TR) = 28 ms, time to echo (TE) = 4 ms, 60 axial slices acquired at 3 mm slice thickness, in-plane voxel size = 1 × 1 mm2, flip angle = 27°, field of view (FOV) = 250 × 188 × 180 mm3]; a proton density weighted [TR = 2000 ms, TE = 10 ms, 60 axial slices acquired at 3 mm slice thickness, in-plane voxel size = 1 × 1 mm2, FOV = 250 × 200 × 180 mm3, echo train length (ETL) = 3]; a T2-weighted (TR = 6100 ms, TE = 80 ms, 60 axial slices acquired at 3 mm slice thickness, in-plane voxel size = 1 × 1 mm2, FOV = 250 × 188 × 180 mm3, ETL = 8); and a fluid-attenuated inversion recovery (FLAIR) (TR = 9000 ms, TE = 80 ms, inversion time = 2500 ms, 60 axial slices acquired at 3 mm slice thickness, in-plane voxel size = 1 × 1 mm2, FOV = 250 × 188 × 180 mm3, ETL = 12).
For patients with RMS, MRI assessments were conducted at baseline, Week 24, Week 48, Week 96, and OLE Week 46. For HCs, MRI scans were acquired at baseline, Week 48, Week 96, and OLE Week 46.
Whole brain (WB), WM, cortical gray matter (CGM), thalamus (THAL), and cerebellum (CBL) volume, all normalized by the head size, were assessed using baseline T1-weighted images. WM T2 lesions were masked out during the CGM and WM classification step, and added back as WM. The relative percentage change from baseline was obtained for each subsequent visit using SIENA 9 for WB and paired Jacobian integration 10 for the other regions.
Statistical analysis
For each MRI assessment, volume loss rates were compared between HCs and patients with RMS. Two main comparisons with HCs were carried out over a 2-year period, that is, using Week 48, Week 96, and OLE Week 46. The first included ocrelizumab-treated patients who participated in the original substudy. The second included all ocrelizumab-treated patients from OPERA after an exact match to HCs using age (years in integers) and sex. To counterbalance unequal numbers of matches/HCs between thus formed strata, specific weights were used in the subsequent modeling. 11 Week 48 was used as the initial timepoint for the analysis to avoid potential pseudoatrophy affecting ocrelizumab-treated patients, as well as to allow ocrelizumab to reach its full efficacy. A third comparison was performed to verify that the analysis chosen would have been able to capture differences where they were expected: volume loss rates in HCs were compared with age- and sex-matched interferon-treated patients enrolled in OPERA I/II. In this case, baseline, Week 48, and Week 96 were used, where clear differences (due to pseudoatrophy, lower efficacy, etc.) with HCs were expected. In this comparison, the timepoint OLE Week 46 could not be used because patients at Week 96 switched to ocrelizumab.
Volume loss rates were computed and compared between groups (i.e. HCs vs patients with RMS) using linear mixed-effects models (random intercepts, random slopes) with time-by-group interaction, age and sex as fixed effects, with subjects and time as random intercept and slope, respectively. Annualized percentage changes were derived using each subject’s individual volume loss rate with the initial timepoint volume (Week 48 volume for the comparison with ocrelizumab-treated patients and baseline volume for interferon-treated patients as a reference). When the matched OPERA I/II patients were compared with HCs, only patients with complete MRI assessments at all considered visits were used, and bootstrapping was applied to derive confidence intervals.
Analyses were performed in R version 4.1.0. 12 Mixed-effects models were analyzed on the latter environment using package lme4 version 1.1-27. 13
Data availability
For eligible studies, qualified researchers may request access to individual patient-level clinical data through a data request platform. At the time of writing, this request platform is Vivli (https://vivli.org/ourmember/roche/). For up-to-date details on Roche’s Global Policy on the Sharing of Clinical Information and how to request access to related clinical study documents, see here: (https://go.roche.com/data_sharing). Individual subject-level MRI data for regional brain atrophy rates in healthy individuals and patients with RMS included in the OPERA I/OPERA II randomized controlled trials are made available to qualified researchers at https://clinicalstudydatarequest.com. The request requires a detailed, hypothesis-driven statistical analysis plan that is collaboratively developed by the requestor and company subject matter experts. Anonymized records for individual patients across more than one data source external to Roche cannot, and should not, be linked due to a potential increase in risk of patient re-identification.
Results
The number of patients that contributed to all analyses is reported in Table 1. Patient demographics as well as clinical characteristics are reported in Table 2. The same site comparison between HCs and ocrelizumab-treated patients enrolled at the same site did not show significant differences in slopes for WB, WM, CGM, THAL, and CBL volume loss rates (Table 3). This was largely confirmed when using age- and sex-matched ocrelizumab-treated patients from OPERA I/II (Table 3): a small but significant difference was detected in WB volume loss. When instead interferon-treated patients were compared with HCs in the double-blind study phase, clear, significant differences were detected across all the global and regional volume loss rates (Table 3), validating the fact that the method is sensitive enough to detect existing differences in these samples.
Number of subjects included in all analyses.
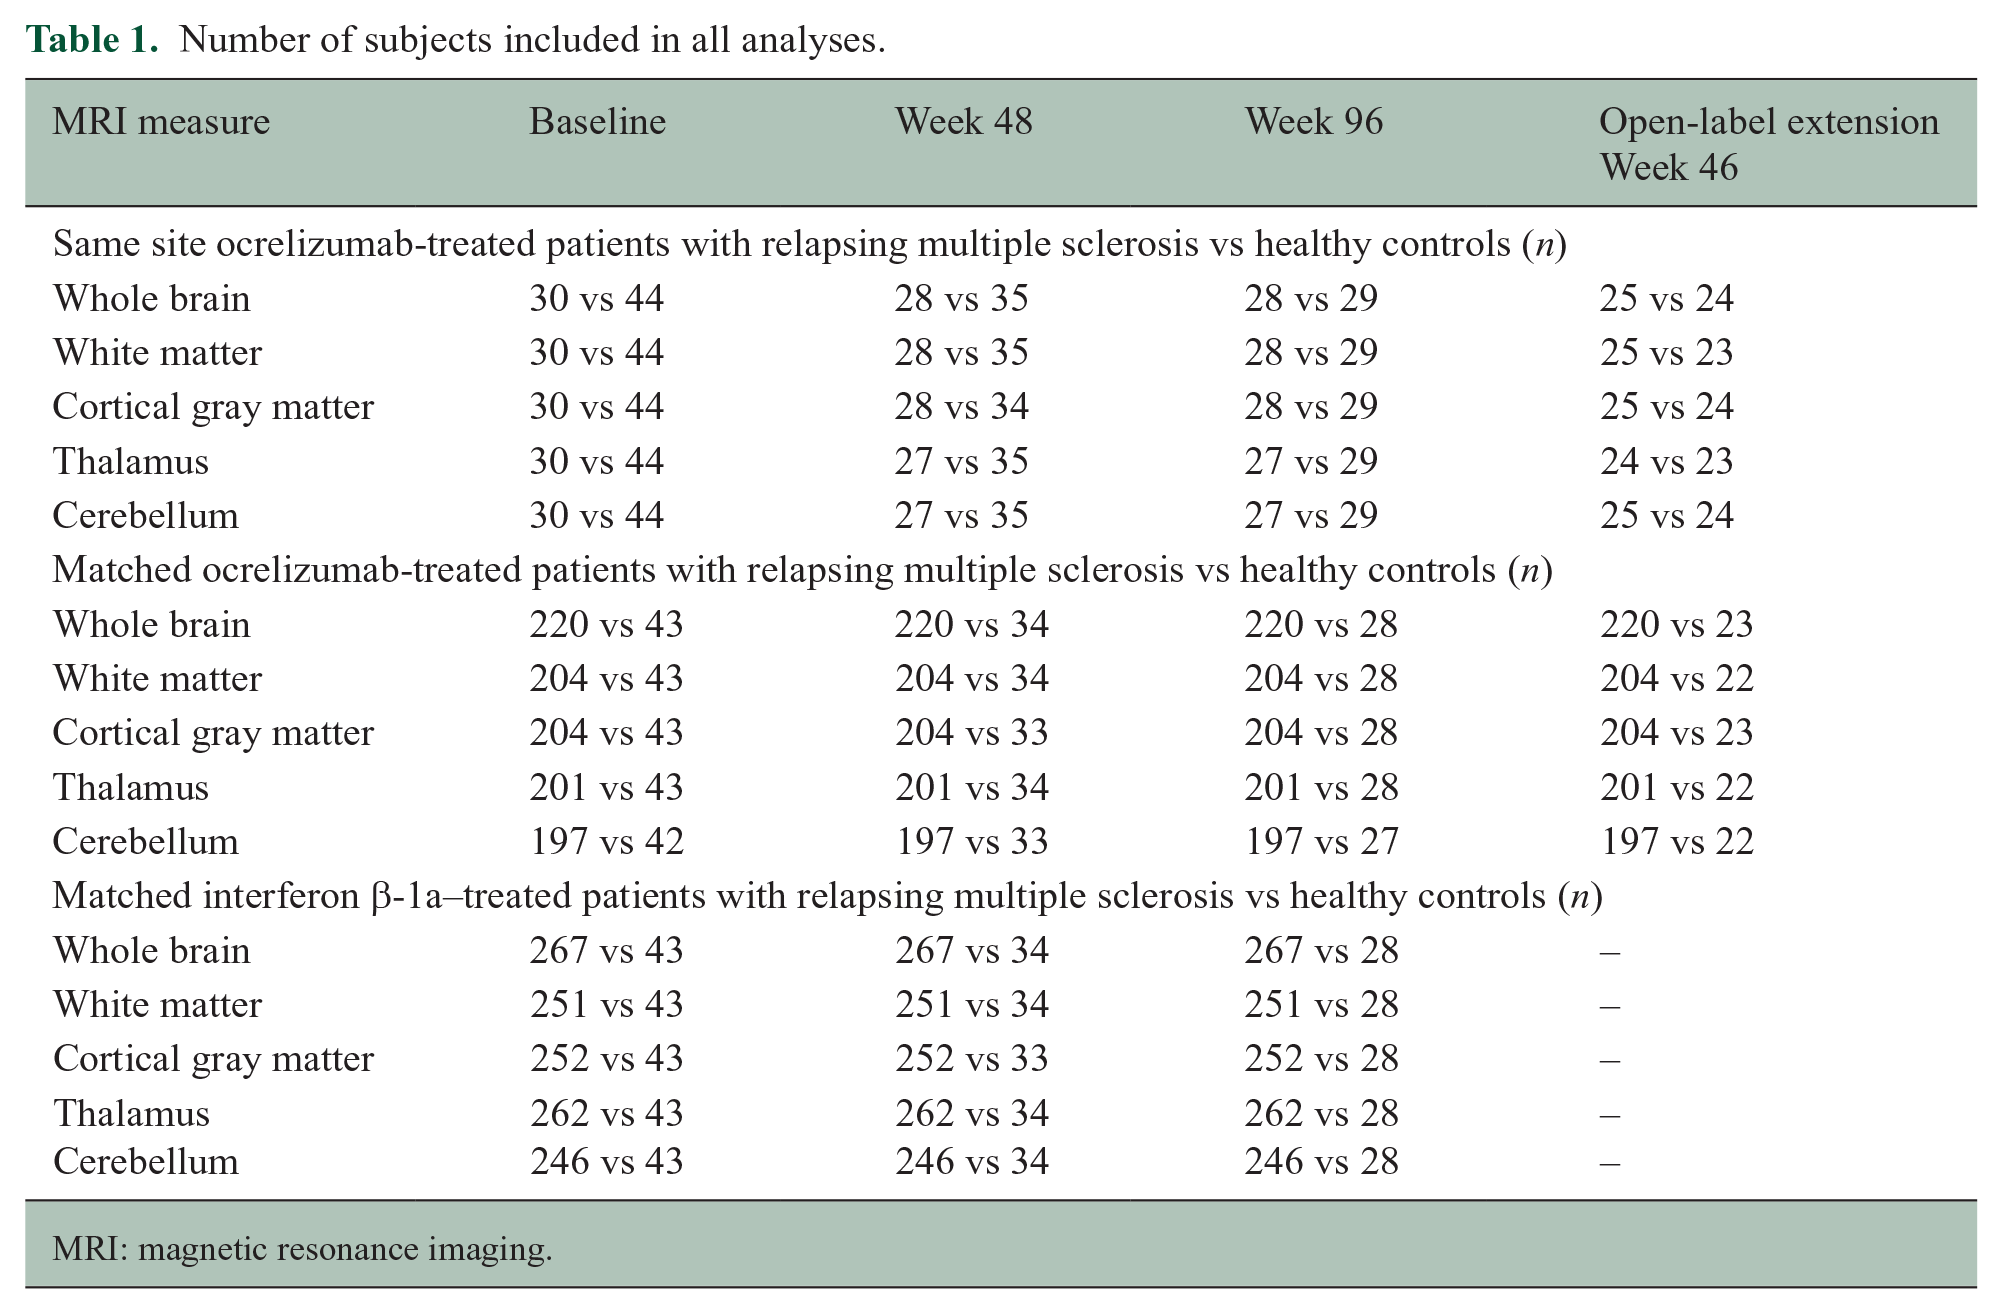
MRI: magnetic resonance imaging.
Baseline characteristics of the groups considered in all analyses.
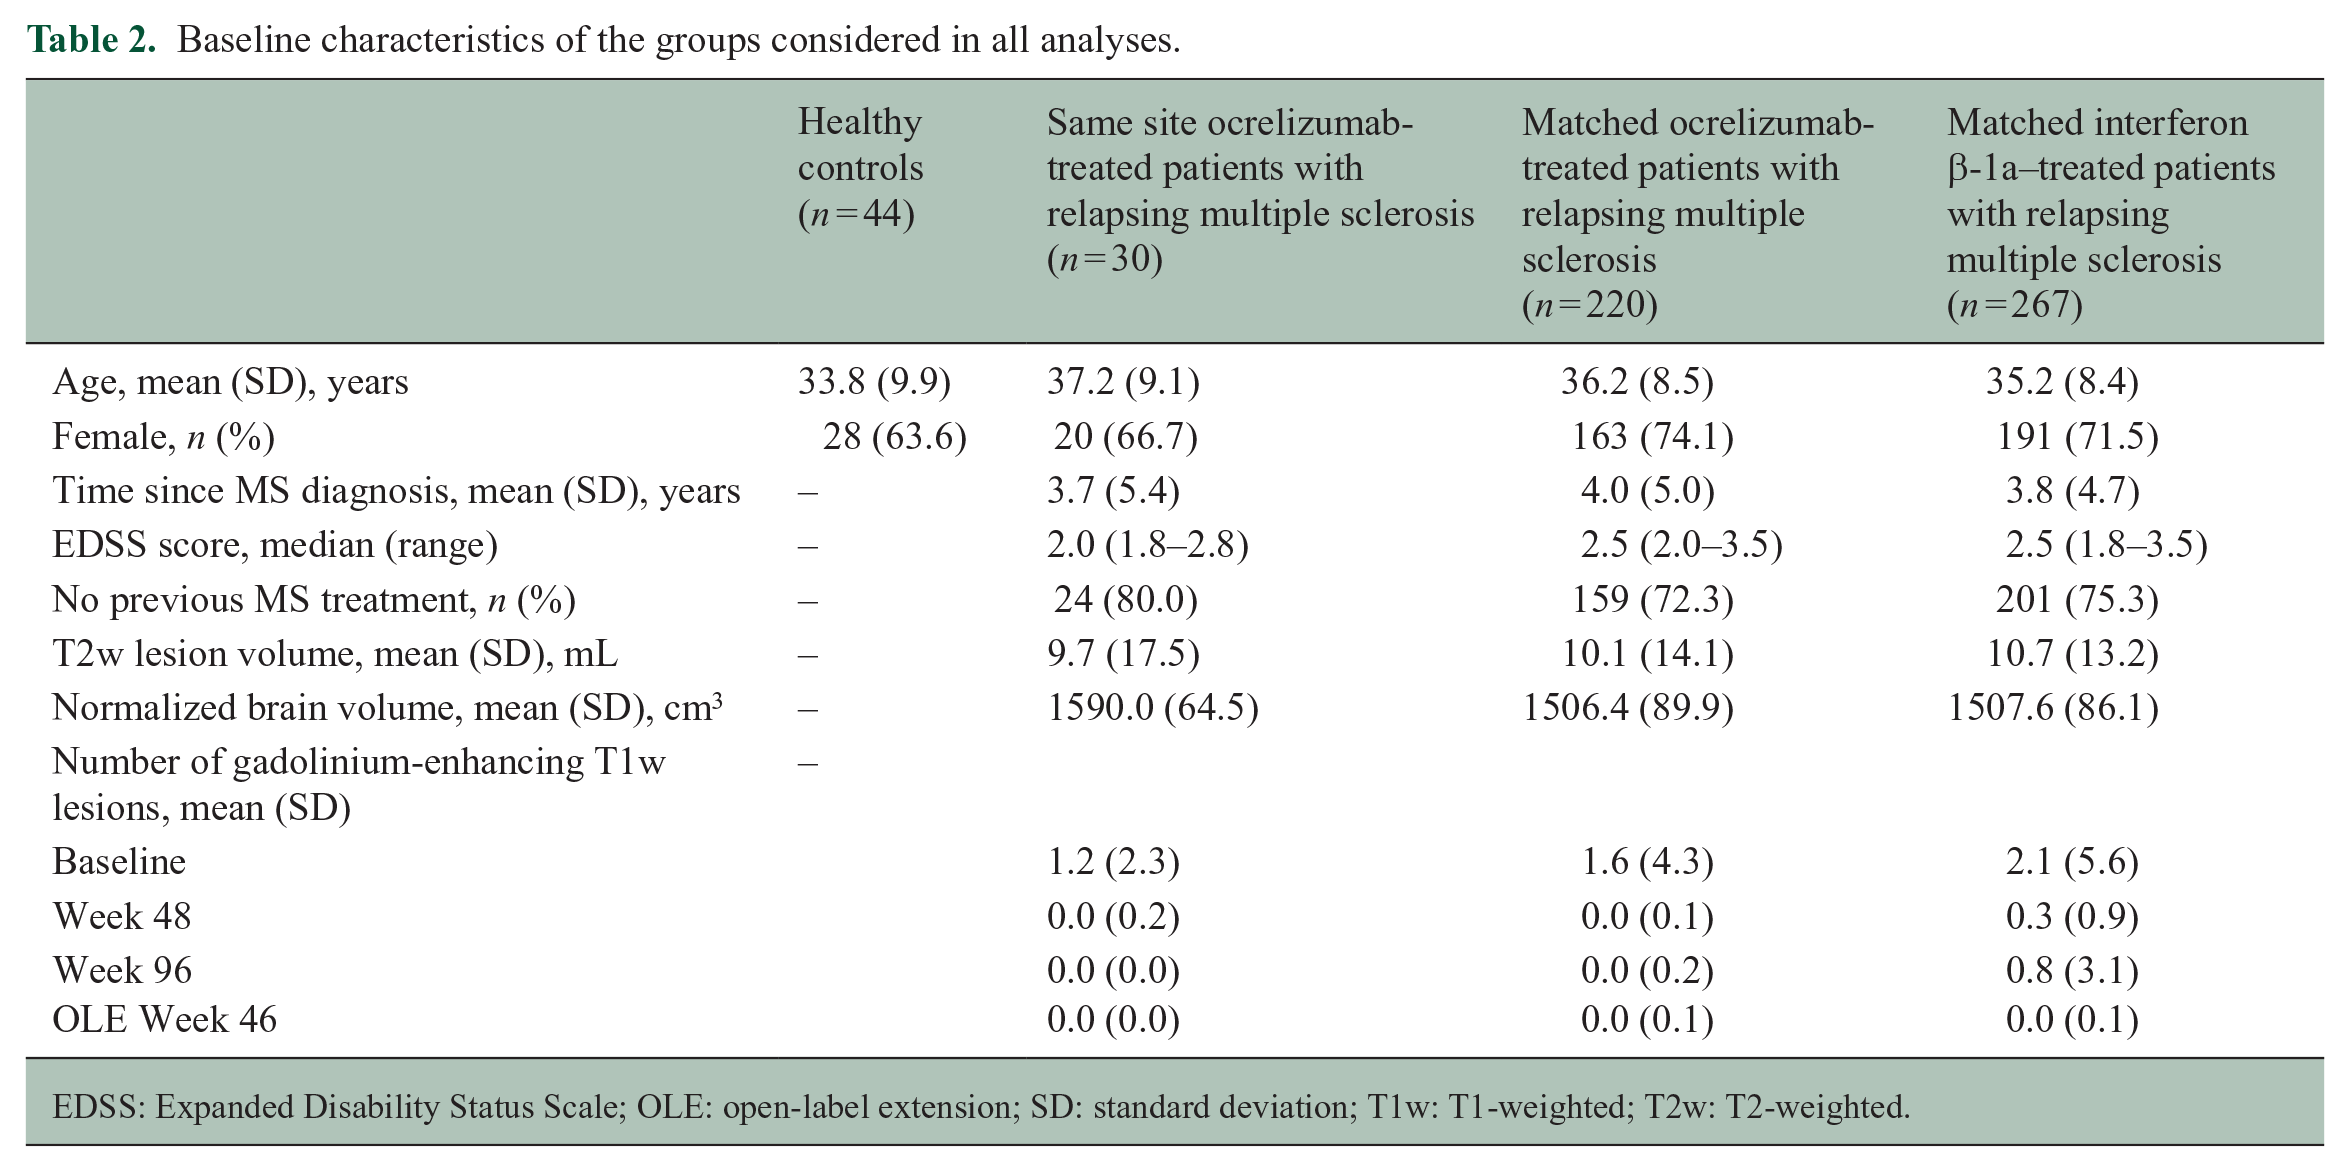
EDSS: Expanded Disability Status Scale; OLE: open-label extension; SD: standard deviation; T1w: T1-weighted; T2w: T2-weighted.
Differences in slopes (reported as cm3 per year) in patients with relapsing multiple sclerosis vs healthy controls estimated by the random coefficients model.
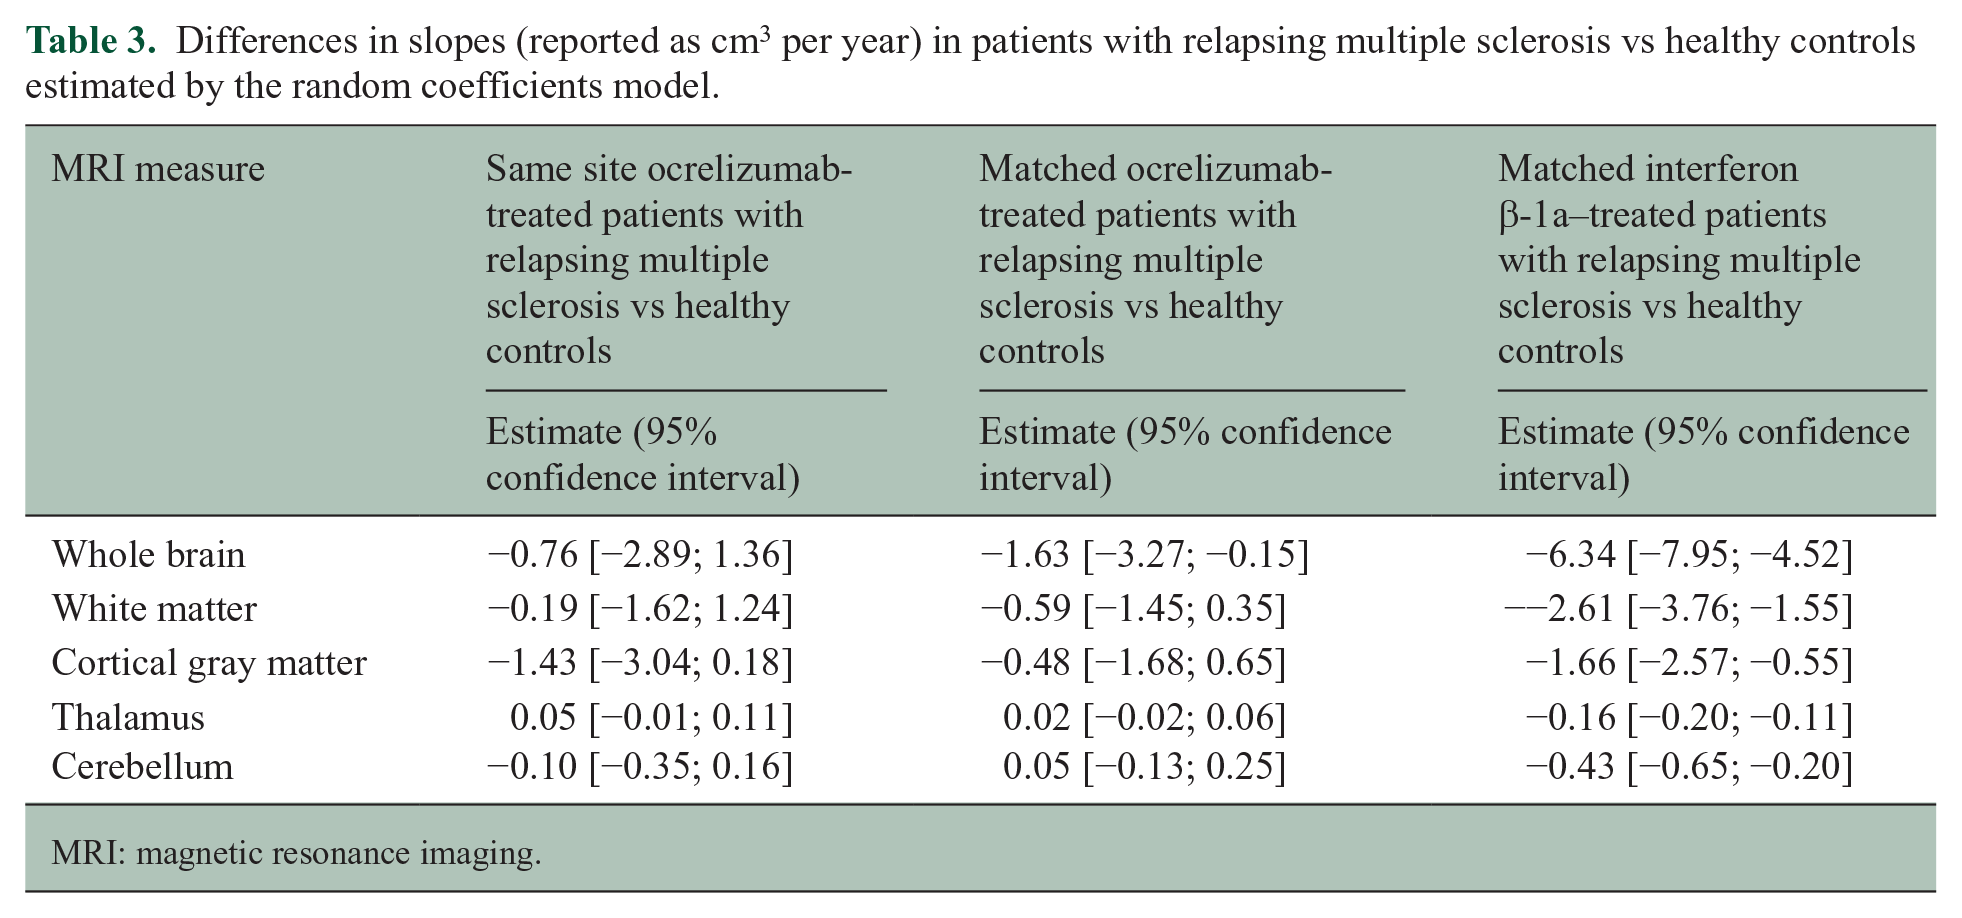
MRI: magnetic resonance imaging.
Similar annualized percentage changes in volumes were observed between HCs and ocrelizumab-treated patients (Figure 1). Consistently across HCs and ocrelizumab-treated patients, higher annualized percentage changes over time were observed in the gray matter regions, with the highest rate in the THAL (in the matched population), while smaller changes were found in the WM and CBL.
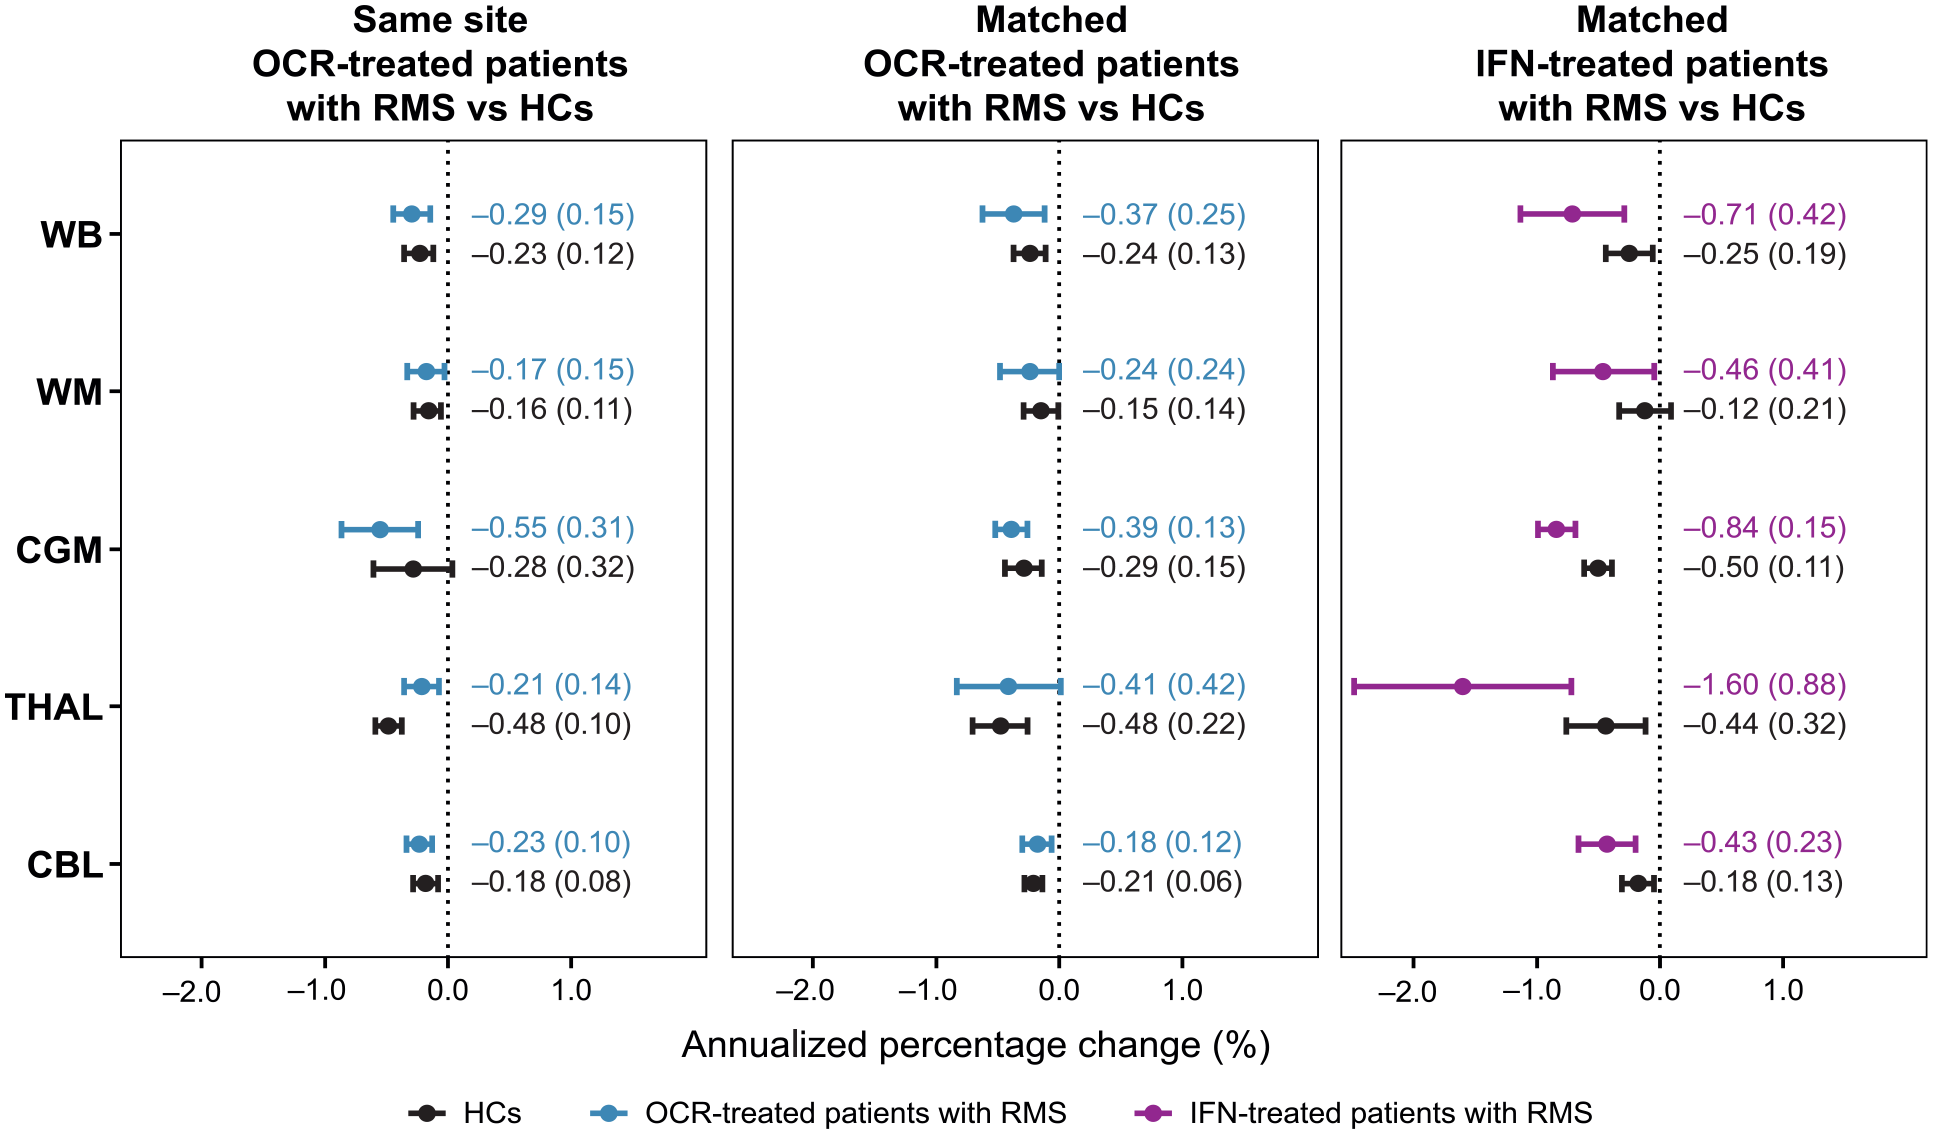
Annualized percentage changes [mean (SD)] in WB, WM, CGM, THAL, and CBL volume in ocrelizumab-treated patients with RMS, interferon-treated patients with RMS, and healthy controls.
Discussion
In this study, we compared global and regional volume loss rates of ocrelizumab-treated patients with RMS and HCs over a timeframe of 2 years. Our findings suggested that, after ocrelizumab reached its full efficacy, patients with RMS showed volume loss rates approaching that of healthy aging controls across the WB in general, and specifically in the CGM, WM, THAL, and CBL.
Many interdependent factors contribute to volume loss, which results primarily from inflammatory demyelination and associated axonal degeneration. The inflammatory demyelination is not restricted to the peripherally driven focal WM lesions, but also may result from activation of innate inflammatory processes, including glial (particularly microglial) activation within focal WM lesions and normal-appearing brain tissues. Thus, the almost complete suppression of the formation of new focal WM lesions does not necessarily indicate the suppression of all CNS inflammation. Chronic inflammatory activity may continue within pre-existing lesions14–16 and probably also in non-lesional brain tissues, since, in the absence of treatment, the latter also show evidence of progressive pathology over time, including neuronal dysfunction 17 and myelin loss. 18
In this study, the formation of new lesions was completely stopped by ocrelizumab, 4 eliminating, in so doing, what Wang et al. 19 found to explain approximately 40% of WB volume loss over time. Ocrelizumab also suppresses chronic activity in pre-existing lesions, although relatively modestly, 14 and may suppress ongoing demyelination in normal-appearing tissues, as well. There was no clear evidence of ongoing myelin loss within this cohort either (Figure 1), although the expected decreases over time in MRI markers of myelin in normal-appearing tissues are small and may require large sample sizes to be detected.
The fact a highly effective therapy could reduce volume loss to normal or near normal rates with respect to HCs was also demonstrated by Alvarez et al. 20 for patients stable (without new lesions) on natalizumab for at least 2 years, questioning the effect of natalizumab on non-inflammatory neurodegenerative processes. The importance of making this assessment after degenerative changes present at the onset of therapy have had time to run their course has been demonstrated in patients treated with immunoablation and autologous stem cell transplantation.20,21
Our work has expanded observations on the effects of treatment on brain volume loss to specific regions of interest in MS, including WM, CGM, THAL, and CBL. When a broader population of patients with RMS was considered, the annualized percentage changes derived from our analysis ranged from −0.48% (THAL) to −0.15% (WM) for the HCs and from −0.41% (THAL) to −0.18% (CBL) for the age- and sex-matched patients with RMS (Figure 1).
It is difficult to draw analogies with previously reported volume loss rates in both groups, despite the rates derived here being within the ranges. Differences in MRI protocol, preprocessing steps, and methodologies used to derive the rates heavily influence the final results, 22 making it difficult to compare the exact values with pathologic cut-offs previously derived.6,7 However, in the literature, despite different cohorts, MRI protocols and pipelines, the THAL seems to be characterized by higher volume loss rates than other regions, and this is in line with our results. For example, Uher et al. 7 reported higher volume loss rates in the THAL compared with WB and CGM in HCs and patients with MS. Those results were then confirmed later in the work of Azevedo et al. 23 where the authors showed that volume loss was increased in the THAL compared with WB and the contribution of healthy aging as well as MS is higher in the THAL than in WB. Moreover, Opfer et al. 24 provided evidence that THAL volume loss is higher in HCs, leading to higher pathologic cut-offs across different age ranges. The reason why the THAL is the structure that seems to be affected by higher volume loss not only in MS but also in healthy aging is not yet clearly understood, but, most likely, there is a component related to its neuroanatomy and afferent/efferent connections with other brain areas.
The principal limitations of this study lay with the low number of HCs and the duration of the longitudinal follow-up. A higher number of healthy subjects together with a longer follow-up would likely improve the volume loss rates allowing for a more accurate estimation.
In conclusion, this study showed that patients with RMS receiving ocrelizumab had global and regional volume loss rates that were approaching that of HCs, highlighting the impact of inflammation on overall tissue loss and the role of ocrelizumab in reducing this phenomenon.
Footnotes
Acknowledgements
The authors acknowledge that writing and editorial support was provided by Articulate Science, UK.
Declaration of Conflicting Interests
The author(s) declared the following potential conflicts of interest with respect to the research, authorship, and/or publication of this article: S.K. reports grants and consulting fees from Roche; grants and consulting fees from Sanofi-Genzyme; consulting fees from Novartis; and grants from Biogen. L.G. was an employee of and shareholder in F. Hoffmann-La Roche Ltd. at the time of the project. She is now an employee of Novartis AG. H-E.A. is an employee of NeuroRx Research. C.B. is a contractor for F. Hoffmann-La Roche Ltd. U.B. is an employee of and shareholder in F. Hoffmann-La Roche Ltd. C.E. is an employee of NeuroRx Research and has received speaker honoraria from EMD Serono. N.H. is an employee of and shareholder in F. Hoffmann-La Roche Ltd. S.M. is an employee of and shareholder in F. Hoffmann-La Roche Ltd. D.L.A. reports consulting fees from Albert Charitable Trust, Alexion Pharma, Biogen, Celgene, Frequency Therapeutics, Genentech, Med-Ex Learning, Merck, Novartis, Population Council, Receptos, Roche, and Sanofi-Aventis; grants from Biogen, Immunotec, and Novartis; and an equity interest in NeuroRx ‘Research’?. A.T. reports grants and personal fees from Roche; grants and personal fees from Sanofi-Genzyme; personal fees from Novartis; and personal fees from EMD Serono outside the submitted work.
Funding
The author(s) disclosed receipt of the following financial support for the research, authorship, and/or publication of this article: This research was funded by F. Hoffmann-La Roche Ltd., Basel, Switzerland.