
Abstract
Background:
The presence of subclinical optic nerve (ON) injury in youth living with pediatric-onset MS has not been fully elucidated. Magnetization transfer saturation (MTsat) is an advanced magnetic resonance imaging (MRI) parameter sensitive to myelin density and microstructural integrity, which can be applied to the study of the ON.
Objective:
The objective of this study was to investigate the presence of subclinical ON abnormalities in pediatric-onset MS by means of magnetization transfer saturation and evaluate their association with other structural and functional parameters of visual pathway integrity.
Methods:
Eleven youth living with pediatric-onset MS (ylPOMS) and no previous history of optic neuritis and 18 controls underwent standardized brain MRI, optical coherence tomography (OCT), Magnetoencephalography (MEG)-Visual Evoked Potentials (VEPs), and visual battery. Data were analyzed with mixed effect models.
Results:
While ON volume, OCT parameters, occipital MEG-VEPs outcomes, and visual function did not differ significantly between ylPOMS and controls, ylPOMS had lower MTsat in the supratentorial normal appearing white matter (−0.26 nU, p = 0.0023), and in both in the ON (−0.62 nU, p < 0.001) and in the normal appearing white matter of the optic radiation (−0.56 nU, p = 0.00071), with these being positively correlated (+0.57 nU, p = 0.00037).
Conclusions:
Subclinical microstructural injury affects the ON of ylPOMS. This may appear as MTsat changes before being detectable by other currently available testing.
Keywords
Introduction
The optic nerve (ON) is often subclinically affected in MS. Subclinical optic nerve changes can be detected functionally, 1 and optical coherence tomography (OCT) has allowed precise and non-invasive quantification of subclinical retinal injury in patients with MS.2–4 While conventional (clinically acquired) magnetic resonance imaging (MRI) has achieved fairly good sensitivity in detecting optic nerve signal changes during the acute phases of optic neuritis,5–7 it is limited in its ability to detect more subtle changes in the asymptomatic patient. Quantitative MRI assessment of ON volume has consistently shown long-term tissue loss in the chronic phases after optic neuritis in adult patients with MS, with volume preservation in the non-affected eye.8,9 Other quantitative MRI techniques like diffusion tensor imaging (DTI) of the optic nerve have also failed to demonstrate abnormalities in the non-affected MS eyes. 10 Magnetization transfer (MT) imaging is an MRI technique sensitive to myelin density and microstructural tissue integrity.11,12 Others have used MT ratio (MTR) to investigate the degree and time course of optic nerve demyelination and microstructural alterations in patients with MS during and after optic neuritis, showing associations between the degree of ON microstructural injury and the severity of visual outcomes.2,13–17
Recent years have seen the development of knowledge about the inter-relationships between subclinical, progressive retinal changes and brain microstructural alterations and atrophy, both reflecting aspects of common underlying mechanisms of disease progression.18–20 However, studies assessing the clinically unaffected nerves of patients with MS with MTR have provided inconsistent results. Compared with healthy controls, some studies 2 showed lower MTR suggestive of subclinical ON abnormalities in asymptomatic people with MS, while others15,16 showed no significant differences. These discrepancies could be due to the subtle nature of the changes but could also be due to inadequate sensitivity of the imaging technique. Due to the lengthy and technically complex image processing required to study the optic nerve with quantitative MRI, the analysis of in vivo ON microstructural changes, and whether these precede, follow, or mirror those seen in the retina and the retro-orbital brain, has lagged.2,14,17 This has left a gap in knowledge regarding an important component in the characterization of structural changes that occur in MS at the level of the visual pathway. MT saturation (MTsat), a recently developed MT estimation method, may address this gap. MTsat compensates for T1 relaxation and flip angle inhomogeneities, thus overcoming important limitations of MTR imaging. MTsat is optimized to improve the contrast between white and gray matter and cerebrospinal fluid. Moreover, by improving the correlation with macromolecular content (e.g. myelin density), MTsat provides increased sensitivity to microstructural tissue changes and demyelination compared with MTR. 21
We therefore sought to evaluate the ability of MTsat to show subclinical ON injury in a unique cohort of pediatric-onset MS patients with no previous known clinical optic neuritis event, and to explore the associations between these changes and those seen on structural and functional visual testing. Conceptually, a change in ON MTsat in such a cohort could derive from a combination of trans-synaptic degeneration from focal lesions within the optic radiations (OR) and/or chronic diffuse central nervous system demyelination and neurodegeneration involving the optic nerves as well as the whole brain. Therefore, with the hypothesis that an association between ON and retro-chiasmatic visual pathway integrity exists, we also studied the relationship between ON MTsat values and those in either the normal appearing white matter (NAWM) of the OR (ORNAWM MTsat), or within focal lesions along the OR (ORlesions MTsat).
Methods
Participants
Eleven youth living with pediatric-onset MS (ylPOMS) patients without a clinical history of optic neuritis were recruited at variable intervals from their initial presentation in the context of a prospective study of pediatric demyelination conducted in the Pediatric Neuroinflammatory Disorders Program at the Hospital for Sick Children (SickKids) between April 2017 and November 2018. Inclusion criteria were (1) a diagnosis of MS; 22 (2) age < 18 years at the time of enrollment; and (3) completion of standardized brain MRI, OCT, and visual battery that passed quality control. 23 Participants with a history of optic neuritis, MRI ON abnormalities on conventional imaging, or an interocular difference in retinal nerve fiber layer (RNFL) thickness greater than 5 μm 24 were excluded from the study. Participants with history of recent relapse (within 1 month of enrollment), MRI contraindications, comorbid psychiatric or neurological disorder, and Myelin oligodendrocyte glycoprotein (MOG) antibodies 25 were also excluded. Within 30 days of MRI acquisition, we also obtained demographic (sex, age) and basic neurologic data including disease history and neurological exam, as well as an extensive standardized functional visual assessment including OCT, MEG-visual evoked fields studies, perimetry, high-contrast visual acuity, color vision, and Low-contrast Visual Acuity (LCVA). Among the functional metrics collected, LCVA was chosen for our current analysis due to its excellent test–retest reliability and high sensitivity for visual dysfunction in MS. 26 In addition, we recruited 19 healthy pediatric participants as a control population.
MRI data acquisition and processing
All participants received standardized 3T MRI (MAGNETOM Prisma fit, Siemens Healthineers AG, Erlangen, Germany) including an axial T1-weighted MPRAGE (0.9 × 0.9 × 1.0 mm, TR: 1910 ms, TE: 3.51 ms, TI: 1100 ms, flip: 9°), sagittal fluid attenuated inversion recovery (FLAIR, 0.9 × 0.9 ×1 .0 mm, TR: 6000 ms, TE: 356 ms, TI: 2200 ms), and a set of three scans comprising an MTsat acquisition (3D, 1.0 × 1.0 × 1.0 mm, TE: 3.82 ms; MToff: TR 33 ms, flip 10°; MTon: TR 33 ms, flip 10°, stock magnetization transfer preparation pulse; MTT1: TR 11 ms, flip 20°). B1 field mapping was also performed (2.0 × 2.0 × 5.0 mm, TR 4000 ms, TE 18 ms, flip 60° and 120°). Brain tissue segmentation and supratentorial white matter (WM) lesion masks were obtained using a standardized pipeline as previously described.27,28 The intraorbital ON segmentation for volume analysis was performed on T1-weighted MPRAGE images on multiplanar reformats by a single rater (KY) blinded to subjects’ identity (www.itksnap.org). MTsat images were reconstructed as described in Helms, 2008, 21 and corrected for B1 inhomogeneity. Co-registered MTon and MToff images and MTsat maps were carefully quality checked for the potential of movement artifact or misregistration between MTon, MToff, and MTsat images, and used to manually segment the left and right ON on MTsat maps by a single rater (GL) blinded to the subject’s identity. Two healthy controls and one MS participant were excluded due to missing MTT1 sequence or failed quality control. To minimize movement and susceptibility artifacts, we included only voxels (1) contiguous to the geometrical center of the nerve; (2) that appeared to be part of the nerve on all three MT contrasts; and (3) within the posterior one-third of the intraorbital ON (Figure 1) (www.itksnap.org). To test intraobserver reproducibility of the intraorbital MPRAGE and MTsat segmentations, the scans of 10 randomly selected participants were evaluated twice at least 2 weeks apart; the intraclass correlation coefficient was 0.87 and 0.85, respectively. The John Hopkins University (JHU) DTI-based white matter atlas (ICGM-DTI-81) 29 was non-linearly registered to each participant’s MTsat space to extract the bilateral OR using Advanced Normalization Tools (ANTS). 30 Supratentorial white matter (WM) lesion masks for each patient were subtracted from their supratentorial WM mask or their OR masks, and (1) average MTsat in the supratentorial NAWM (NAWM MTsat), (2) average MTsat along the ORs NAWM (ORNAWM MTsat), and (3) average MTsat within OR WM lesions (ORlesions MTsat) were calculated and expressed in normalized MTsat Units (nU).
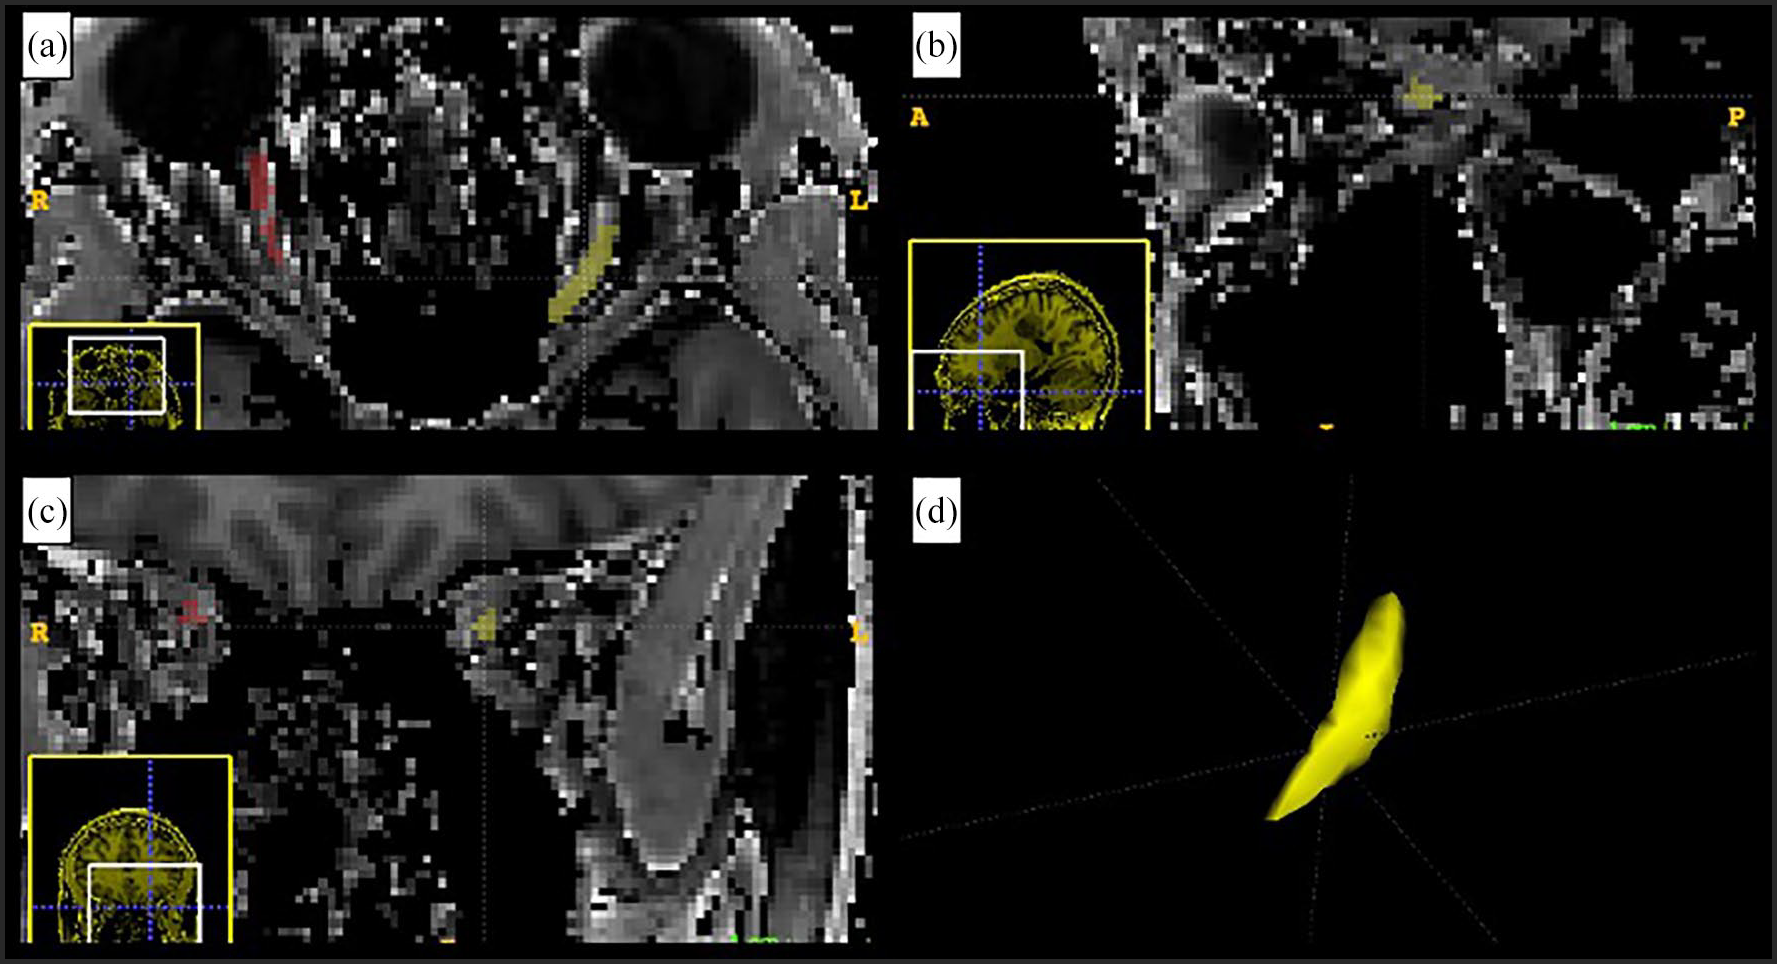
Example of segmentation. Axial (a), sagittal (b), and coronal (c) views from the manual segmentation of the optic nerves of a ylPOMS. The left optic nerve, shown in yellow, and the right optic nerve, in red, are visualized on the MTsat map of the subject. The panel in (d) shows, in yellow, the three-dimensional rendering of the segmented left intraorbital optic nerve (www.itksnap.org).
OCT data acquisition and processing
All scans were performed by trained personnel using a spectral domain OCT (SD-OCT) Cirrus scanner (Carl Zeiss Meditec 4000;7.0.3.19). Scanning was performed using the Optic Disc Cube 200 × 200 scan protocol for evaluation of the peripapillary RNFL, and the Macular Cube 512 × 128 scan protocol for that of ganglion cell-inner plexiform layer (GCIPL). Signal strength equal to or above 7 (out of 10) was considered adequate for analysis. RNFL and GCIPL were derived from data generated by the manufacturer’s fully automated segmentation software. Peripapillary RNFL was assessed by quadrants, and the average of all quadrants was reported as the mean RNFL thickness in micrometers (µm). GCIPL was measured in sextants and averaged to provide a mean GCIPL thickness (µm). Segmentation results were reviewed to ensure accuracy, with manual correction by trained OCT technicians where necessary.
VEPs data acquisition and processing
MEG data collection was conducted with a CTF whole-based 151 channel magnetoencephalography (MEG) system (VSM MedTech, Vancouver, Canada). The occipital MEG sensor peak response was used for the early visual evoked response according to the visual stimulus onset.
LCVA testing
All visual tests were administered monocularly. LCVA was assessed using a wall-mounted Pelli-Robson chart (Precision Vision, Woodstock, IL, USA) presented at 1 meter at eye level under standardized illumination conditions. LCVA was recorded as the lowest contrast sensitivity for which the participant correctly identified at least two of three triplet optotypes and reported as log units.
Statistical analysis
Statistical analysis was performed in Python 3.8.10 (python.org) using the NewModel module (https://github.com/robb-brown/NewModel, ShadowLab Research); model fitting was provided by lme4 1.1-27.1 in R-4.1.2 (r-project.org). Multivariable linear mixed effects models with unstructured matrix models were used to model ON MTsat, supratentorial NAWM MTsat, ORNAWM MTsat, or ON volume in each group (ylPOMS, HC), accounting for sex, age, and a subject-specific random intercept accounting for correlations between left and right eye measurements of each participant. Except for group and sex, which were used as categorical variables, all the factors in the model were continuous variables. The association between ON MTsat and NAWM MTsat, ORNAWM MTsat, ORlesions MTsat, ON volume, OCT parameters (RNFL thickness (RNFLT), temporal RNFLT (RNFLtT), GCIPL thickness (GCIPLT)), MEG-VEPs outcomes (average occipital amplitude and latency) or LCVA was assessed within MS participants only with separate models including the same covariates. Chi-square tests comparing the log-likelihoods of the models with null models tested whether the model had significant explanatory power. Two R2 values are provided for each model: the marginal R2 is the proportion of the variance explained by the fixed effects only, and the conditional R2 is the variance explained by the full mixed model, including the random effects. 31 Normality of model residuals were checked to confirm goodness of fit and residuals were plotted to ensure homoscedasticity prior to using results. Results were not adjusted for multiple comparisons given the exploratory nature of this study.
Standard protocol approvals, registrations, and patient consents
Institutional Research Ethics Board approval (1000005356) and written informed consent (or assent and consent from a parent for younger children) from each participant and/or their guardian was obtained prior to study initiation.
Data availability
Qualified researchers may obtain access to all de-identified raw DICOM data and pre-processed images used for this study subject to appropriate ethical and legal considerations and in compliance with the appropriate Data Transfer/Sharing Agreement.
Results
The clinical and demographic characteristics of the two groups are reported in Table 1. Below, we report the results of the age- and sex-adjusted generalized mixed effect models. The full model fits are reported in the Appendix.
Demographics and clinical information of the study sample.
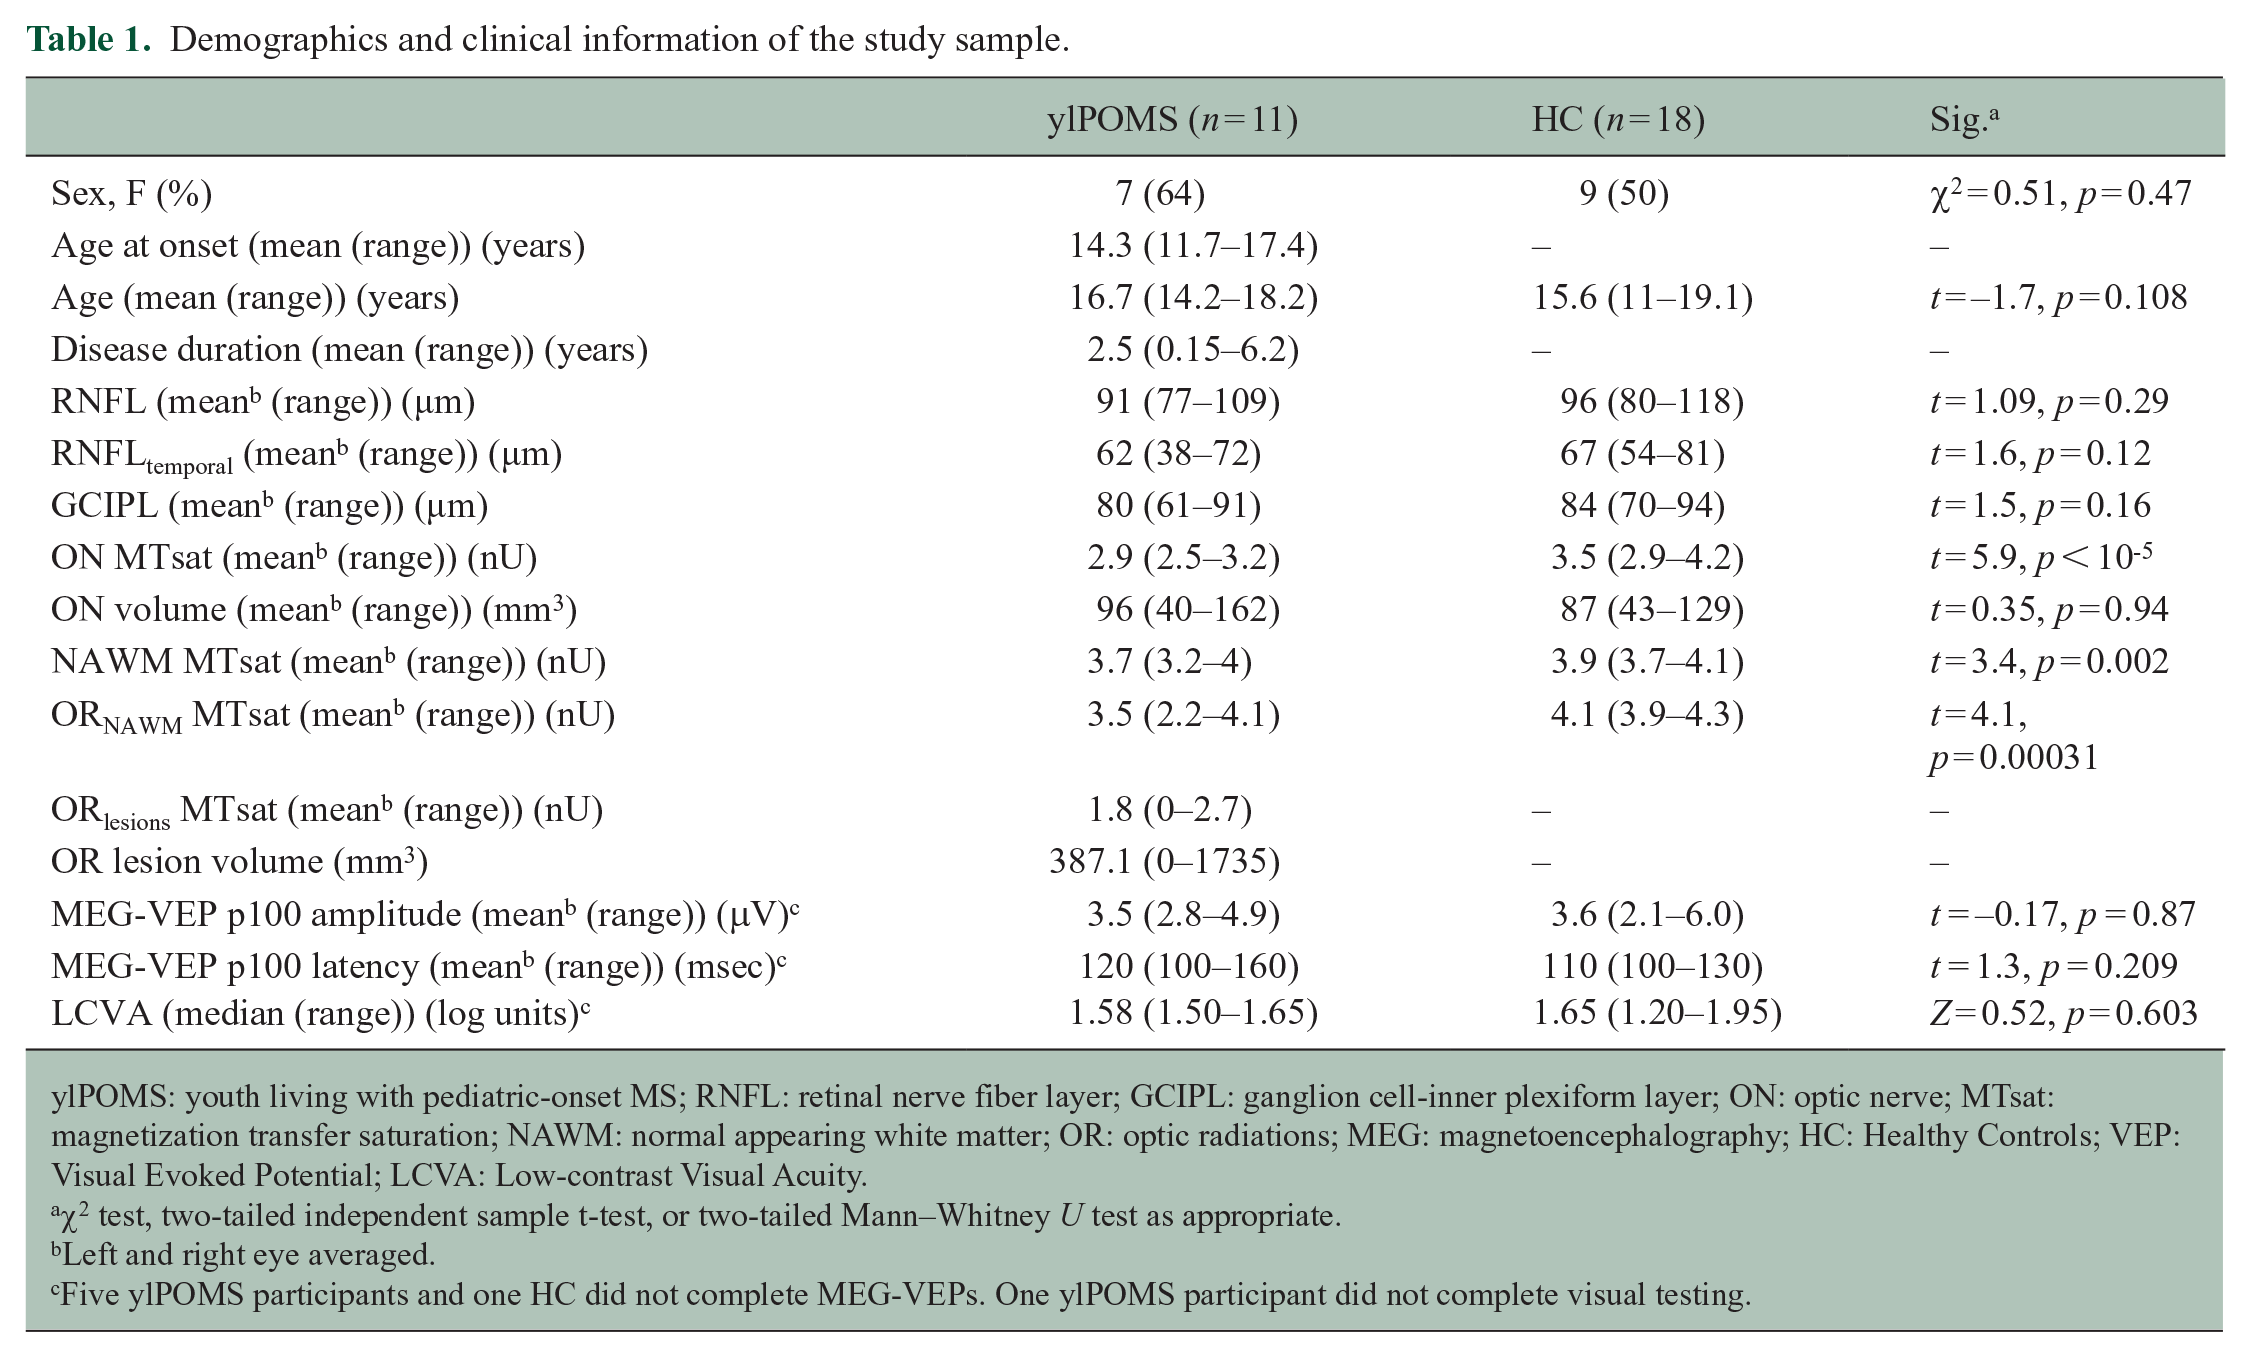
ylPOMS: youth living with pediatric-onset MS; RNFL: retinal nerve fiber layer; GCIPL: ganglion cell-inner plexiform layer; ON: optic nerve; MTsat: magnetization transfer saturation; NAWM: normal appearing white matter; OR: optic radiations; MEG: magnetoencephalography; HC: Healthy Controls; VEP: Visual Evoked Potential; LCVA: Low-contrast Visual Acuity.
χ2 test, two-tailed independent sample t-test, or two-tailed Mann–Whitney U test as appropriate.
Left and right eye averaged.
Five ylPOMS participants and one HC did not complete MEG-VEPs. One ylPOMS participant did not complete visual testing.
Differences between ylPOMS and HC
The predicted ON MTsat averaged 3.1 nU in HC (standard error (SE) = 0.47). ylPOMS showed lower ON MTsat than healthy participants (−0.62 nU, SE = 0.11; p < 0.001). Neither sex (males: −0.12 nU vs. females, SE = 0.11, p = 0.26) nor age (0.026 nU/year, SE = 0.0303, p = 0.40) affected mean ON MTsat (Figure 2). Average MTsat in the supratentorial NAWM and in the ORNAWM were lower in ylPOMS compared with HC (−0.26 nU, SE = 0.075, p = 0.0023; and −0.56 nU, SE = 0.15, p = 0.00071, respectively). The predicted average ON volume was 68 mm3 (SE = 47). The model comparing ON volume between ylPOMS and HC was not significant (marginal R2 = 0.12, conditional R2 = 0.89, p = 0.26). None of the regression models assessing differences in RNFL (marginal R2 = 0.068, conditional R2 = 0.92, p = 0.51), temporal RNFL (RNFLt) (marginal R2 = 0.072, conditional R2 = 0.59, p = 0.40), or GCIPL (marginal R2 = 0.16, conditional R2 = 0.97, p = 0.14) thickness, or MEG-VEPs outcomes (amplitude: marginal R2 = 0.15, conditional R2 = 0.701, p = 0.15; latency: marginal R2 = 0.081, conditional R2 = 0.91, p = 0.49) between ylPOMS and HC were significant.
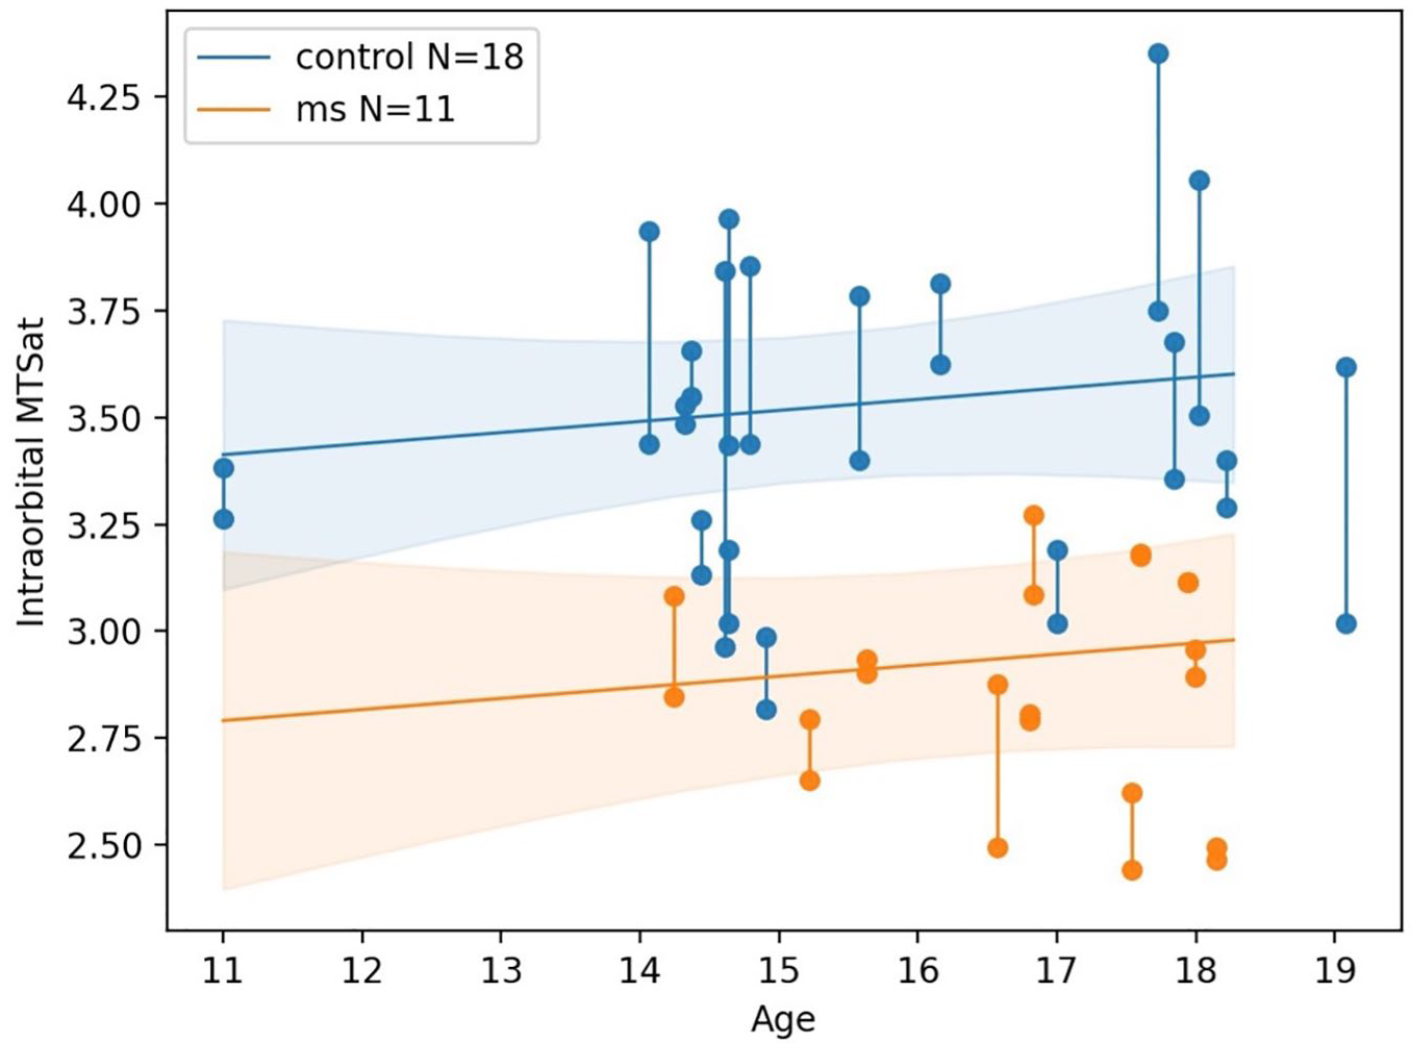
MTsat of the ON in ylPOMS and HC according to age.
Relationship between ON MTsat and other structural visual pathway parameters (NAWM MTsat, ORNAWM MTsat, ORlesions MTsat), ON volume, OCT measures, MEG-VEPs outcomes, and LCVA in ylPOMS
In MS participants, lower ON MTsat was associated with lower ORNAWM MTsat (−0.57 nU for each one-unit decrease in ON MTsat, SE = 0.14, p = 0.00037). Lower ON MTsat was also associated with lower ORlesions MTsat (−0.048 nU for each one-unit decrease in ON MTsat, SE = 0.23), although this was not statistically significant (p = 0.84). ON MTsat was not significantly associated with supratentorial NAWM MTsat (−0.47 nU for each one-unit decrease in ON MTsat, SE = 0.26, p = 0.11). The regression models evaluating the association between ON volume, RNFLT, RNFLtT or GCIPLT and ON MTsat were not significant (marginal R2 = 0.13, conditional R2 = 0.91, p = 0.25; marginal R2 = 0.041, conditional R2 = 0.92, p = 0.71; marginal R2 = 0.12, conditional R2 = 0.97, p = 0.25; and marginal R2 = 0.14, conditional R2 = 0.79, p = 0.46, respectively). Likewise, the three models assessing the relationship between average occipital MEG-VEP amplitude, latency, or LCVA, and ON MTsat did not reach statistical significance (amplitude: marginal R2 = 0.16, conditional R2 = 0.82, p = 0.48; latency: marginal R2 = 0.18, conditional R2 = 0.77, p = 0.47; LCVA: marginal R2 = 0.21, conditional R2 = 0.87, p = 0.29). However, we found an inverse relationship between ON volume and occipital MEG-VEP latency (+0.18 msec for each mm3 decrease in ON volume, SE = 0.59 msec, p = 0.045) in ylPOMS.
Discussion
In this study, we found lower ON MTsat and lower supratentorial NAWM and ORNAWM MTsat in ylPOMS compared with HC, and that higher MTsat in the ON correlated with higher MTsat in the ORNAWM in ylPOMS. Our results support the presence of early and diffuse microstructural changes affecting the anterior and posterior visual pathway in this population and suggest that ON subclinical injury may appear before being detectable by currently available structural and functional testing such as OCT and LCVA.32,33
The global decrease in MTsat parameters independent of previous episodes of optic neuritis, both in the supratentorial NAWM and in the visual pathway specifically, suggests that microstructural injury and demyelination might proceed in close conjunction in the ON and in the supratentorial WM, both being related to the diffuse and focal neurodegenerative aspects of MS pathobiology.
We did not find statistically significant differences in retinal imaging parameters between our ylPOMS patients and the HC population. These results are generally in line with previous studies regarding OCT changes in non-affected eyes of ylPOMS patients34,35 and confirm the relative preservation of retinal layer thicknesses in ylPOMS in the absence of previous ON episodes early in the MS disease course. Our results also suggest that MTsat may be more sensitive than OCT in detecting very early neurodegenerative processes in the visual pathway.
While others have found associations between ON MTR and OCT metrics in patients with MS and previous clinical evidence of optic neuritis,2,14,17 our regression models investigating these associations with MTsat did not provide confident results and data fit. This is likely because of the small variation in the OCT parameters in our cohort of very early MS without previous episodes of optic neuritis, which did not differ significantly from those of HC.
As for the OCT parameters, the lack of a demonstrable relationship between ON MTsat and LCVA or MEG-VEPs outcomes was due to the lack of variation in the visual and electrophysiological parameters, with absence of significant functional visual deficit in our study sample (all our MS participants had clinically normal vision). 36 A previous serial analysis of the ON following optic neuritis in adults with MS showed progressive decline of its cross-sectional area consistent with neuroaxonal loss over the span of 1 year, with no significant changes in the non-affected (fellow eye) compared with HC eyes. 8 Consistently, we did not find significant differences in ON volume between ylPOMS and HC. However, we found that lower ON volumes were associated with increased occipital MEG-VEP latencies in ylPOMS only. This may hint at a reduced structural and functional reserve in ylPOMS without previous episodes of optic neuritis, whereby even mild ON neuroaxonal loss can lead to loss of function reflected as increased evoked potential latencies.8,35 Future studies involving MS participants with different degrees of impairment might contribute to a better understanding of the association between ON MTsat, ON volume, and visual functions.
Limitations of our technique involve possible misregistration of MTon-MToff during motion correction, as well as the costs and the time associated with the image acquisition (approximately 30 minutes) and processing phase, and the ON manual segmentation (approximately 20–30 minutes per nerve). ON manual segmentation also makes the procedure intrinsically prone to bias due to the subjective nature of manual segmentation of anatomical structures. Limitations of our study include its small sample size and the cross-sectional nature of our data. Whether the detected changes in ON MTsat precede overt OCT and MEG-VEP abnormalities in ylPOMS is currently unknown. Future plans include the acquisition of prospective longitudinal data to follow the evolution of MTsat and visual pathway changes in early MS, as well as to determine the effect of optic neuritis on structural, functional, and electrophysiological visual outcomes in this population.
In conclusion, using MTsat we detected microstructural visual pathway and supratentorial NAWM alterations in pediatric-onset MS, even in the absence of abnormalities in visual function or structure using sensitive and well-established metrics. The changes we demonstrate might reflect subtle alteration of structure and maturation of neuroaxonal structure in the context of diffuse inflammation and demyelination, mirroring the results of other studies that have analyzed normal appearing brain tissues and volumes in pediatric onset MS.27,37,38 Given the changes in MTsat we observed in the absence of abnormalities in OCT or LCVA, ON MTsat may be not only a research tool, but also potentially be translated clinically and of utility as an imaging metric for clinical trials focused on visual pathway outcomes in MS. Refinement of this technique with ON-dedicated sequences and automated processing would be required for use in clinical trials. Since the relative contributions of demyelination and axonal loss to reduction in MTsat cannot be established using this technique alone, future studies coupling other MRI techniques sensitive to injury to the axonal compartment, such as newer diffusion imaging techniques with computation of the axonal volume fraction, are needed.
Supplemental Material
sj-txt-1-msj-10.1177_13524585221137500 – Supplemental material for Magnetization transfer saturation reveals subclinical optic nerve injury in pediatric-onset multiple sclerosis
Supplemental material, sj-txt-1-msj-10.1177_13524585221137500 for Magnetization transfer saturation reveals subclinical optic nerve injury in pediatric-onset multiple sclerosis by Giulia Longoni, Edgar Martinez Chavez, Kimberly Young, Robert A Brown, Sonya Bells, Dumitru Fetco, Laura Kim, Stephanie A Grover, Fiona Costello, Arun Reginald, Amit Bar-Or, Ruth Ann Marrie, Douglas L Arnold, Sridar Narayanan, Helen M Branson, Brenda L. Banwell, John G Sled, Donald J. Mabbott and E Ann Yeh in Multiple Sclerosis Journal
Footnotes
Declaration of Conflicting Interests
The author(s) declared the following potential conflicts of interest with respect to the research, authorship, and/or publication of this article: Giulia Longoni, Edgar Martinez Chavez, Kimberly Young, Robert A. Brown, Sonya Bells, Dumitru Fetco, Laura Kim, Stephanie A. Grover, Helen M. Branson, Arun Reginald, John G. Sled, and Donald J. Mabbott have nothing to disclose. Fiona Costello has received speaker honoraria for Accure Therapeutics, Novartis, Alexion; and consultant honoraria for Frequency Therapeutics and Alexion. Amit Bar-Or participated as a speaker in meetings sponsored by and received consulting fees and/or grant support from Janssen/Actelion; Atara Biotherapeutics, Biogen Idec, Celgene/Receptos, Roche/Genentech, MAPI, Medimmune, Merck/EMD Serono, Novartis, Sanofi-Genzyme. Ruth Ann Marrie receives research funding from CIHR, Research Manitoba, Multiple Sclerosis Society of Canada, Multiple Sclerosis Scientific Foundation, Crohn’s and Colitis Canada, National Multiple Sclerosis Society, CMSC, US Department of Defense and the Arthritis Society. She is supported by the Waugh Family Chair in Multiple Sclerosis. She is a co-investigator on a study funded in part by Biogen Idec and Roche (no funds to her/her institution). Douglas L. Arnold has received personal compensation for serving as a Consultant for Alexion, Biogen, Celgene, Eli Lilly, EMD Serono, Frequency Therapeutics, Genentech, Merck, Novartis, Roche, Sanofi, and Shionogi, and holds an equity interest in NeuroRx. Sridar Narayanan has received speaker’s honoraria from Novartis Canada and Roche and is a part-time employee of NeuroRx Research. Brenda L. Banwell serves as a consultant to Novartis, Roche, UCB, Sanofi-Genzyme, Biogen, and UTSW regarding design and safe conduce of clinical trials and as a central reviewer for Novartis and Roche. E. Ann Yeh has received research funding from NMSS, CMSC, CIHR, NIH, OIRM, SCN, CBMH Chase an Idea, SickKids Foundation, Rare Diseases Foundation, MS Scientific Foundation (Canada), McLaughlin Center, Mario Battaglia Foundation. Investigator initiated research funding from Biogen. Scientific advisory: Biogen, Hoffman-LaRoche, Vielabio. Speaker honoraria: Saudi Epilepsy Society, NYU, MS-ATL; ACRS, PRIME.
Funding
The author(s) disclosed receipt of the following financial support for the research, authorship, and/or publication of this article: This work was supported by the Ontario Institute for Regenerative Medicine (OIRM), the Stem Cell Network, the National Multiple Sclerosis Society (NMSS), and The Multiple Sclerosis Scientific Research Foundation (MSSRF). The Sponsors did not have a role in study design; in the collection, analysis, or interpretation of data; in the writing of the report; or in the decision to submit the article for publication.
Supplemental material
Supplemental material for this article is available online.
References
Supplementary Material
Please find the following supplemental material available below.
For Open Access articles published under a Creative Commons License, all supplemental material carries the same license as the article it is associated with.
For non-Open Access articles published, all supplemental material carries a non-exclusive license, and permission requests for re-use of supplemental material or any part of supplemental material shall be sent directly to the copyright owner as specified in the copyright notice associated with the article.