
Abstract
Background:
The current standard endpoint to assess disability accumulation in multiple sclerosis (MS) clinical trials is the time to the first confirmed disability progression, which excludes subsequent progression events. Including recurrent progression events may permit a more comprehensive assessment of treatment effects on disability progression.
Objective:
To propose a definition of recurrent disability progression events and to compare time-to-first and recurrent event analysis.
Methods:
Recurrent disability progression events were defined by expanding the recommended first event definition. Marginal recurrent event methods (negative binomial model, Lin–Wei–Yang–Ying model) were compared with Cox regression in data from three randomized controlled trials in relapsing multiple sclerosis (RMS) and primary progressive multiple sclerosis (PPMS), and in simulated randomized controlled trial data.
Results:
The recurrent event analyses included a substantially larger number of progression events compared with the time-to-first-event analyses (+7.5% and +9.9% in the RMS trials and +22.7% in the PPMS trial). The increase in the number of events resulted in more precise treatment effect estimates and a corresponding gain in statistical power.
Conclusion:
Our results support the use of recurrent event data analysis, especially in progressive MS trials, to improve estimates of treatment effects, increase statistical power, and better capture the clinically meaningful long-term disability progression experience.
Keywords
Introduction
Multiple sclerosis (MS) is a chronic, inflammatory, and demyelinating disease of the central nervous system that affects approximately 2.8 million people worldwide. 1 Management of MS is complex and lifelong, and focuses on relapse reduction, symptom management, and prevention of long-term disability. 2 The most widely recognized assessment tool to quantify worsening of neurological functions and monitor changes in the level of disability over time in MS is the Expanded Disability Status Scale (EDSS), which is measured on an ordinal scale ranging from 0 to 10 in 0.5 unit increments. 3 Treatment effect on disability worsening or progression is typically determined by the time to the first disability progression event, defined as a 0.5- or 1.0-point change from baseline in EDSS score, and that needs to be confirmed by at least one additional scheduled EDSS (confirmed disability progression (CDP)).4,5 CDP has been used as primary or secondary endpoint in randomized clinical trials (RCTs), supporting approval of disease-modifying treatments for MS.6,7
However, patients will continue to progress after reaching the first CDP event, especially those with progressive MS. The disease course after a first CDP event is meaningful. For example, experiencing several CDP events in a given observation time would typically have a higher negative impact on quality of life than experiencing only one CDP event. Accounting for recurrent CDP events in estimating treatment effects promises to better capture the long-term patient experience, as well as increase statistical power.
We propose the analysis of recurrent CDP events as a comprehensive measure of disability accumulation that uses the whole within-patient trajectory of events. Recurrent events are well-established endpoints in indications with low mortality rates, including the analysis of relapses in MS. 8 To our knowledge, analyses of recurrent CDP events have not been included as primary or secondary endpoints in MS trials to date, but they have recently been applied to observational primary progressive multiple sclerosis (PPMS) and secondary progressive MS cohorts.9–12
Here, we evaluate the definition of repeated CDP events and the validity of marginal methods in measuring the benefit of an intervention on a recurrent event endpoint in an RCT setting, using data from three different RCTs in relapsing multiple sclerosis (RMS) and PPMS, as well as simulated RCT data.
Materials and methods
Definition of recurrent CDP events
We will use one of the standard definitions of EDSS-based CDP: an initial disability progression (IDP) is defined as an increase in EDSS by ⩾1.0 point from the baseline EDSS if the baseline EDSS is ⩽5.5 or an increase of ⩾0.5 points if the baseline EDSS is >5.5.7,13,14
The time to the first 12-week CDP (CDP12) is defined as the time from baseline to the onset of the first IDP that is confirmed at the next regularly scheduled visit ⩾12 weeks thereafter. Similarly, 24-week CDP (CDP24) is defined with longer confirmation periods. Confirmation of an IDP is the gold standard methodology used to enhance specificity of the endpoint by mitigating the impact of the variability in EDSS assessments and reducing the probability of capturing progression events that may subsequently revert.
We propose to expand the definition of a first CDP event to recurrent CDP events as follows: suppose that a patient can experience up to j = 1, 2,. . ., J progression events during follow-up, and let k = 1, 2,. . ., K ⩾ J index the kth IDP since randomization, defined as an increase in EDSS of ⩾1.0 or ⩾0.5 points from its reference EDSS (defined below) for reference scores ⩽5.5 or >5.5, respectively. Note that K ⩾ J, since an IDP does not necessarily become a CDP. As for the first event, the kth IDP only counts as a CDP12 (or CDP24) event if it is confirmed at the next regularly scheduled visit ⩾12 (or ⩾24) weeks thereafter, respectively. The reference score for the kth IDP is the EDSS value associated with the IDP of the previous CDP event, and consequently must be readjusted following each identified CDP. The baseline EDSS serves as the reference score for the first event (j = 1), in which case the newly proposed definition of recurrent CDP events coincides with the traditional first event definition. Three examples of typical EDSS trajectories with two or three recurrent CDP12 events are shown in Figure 1. If all IDPs result in CDPs, then K = J (see Figure 1(a) and (b)). Otherwise, there are fewer CDPs than IDPs (i.e. K > J), as in Figure 1(c).
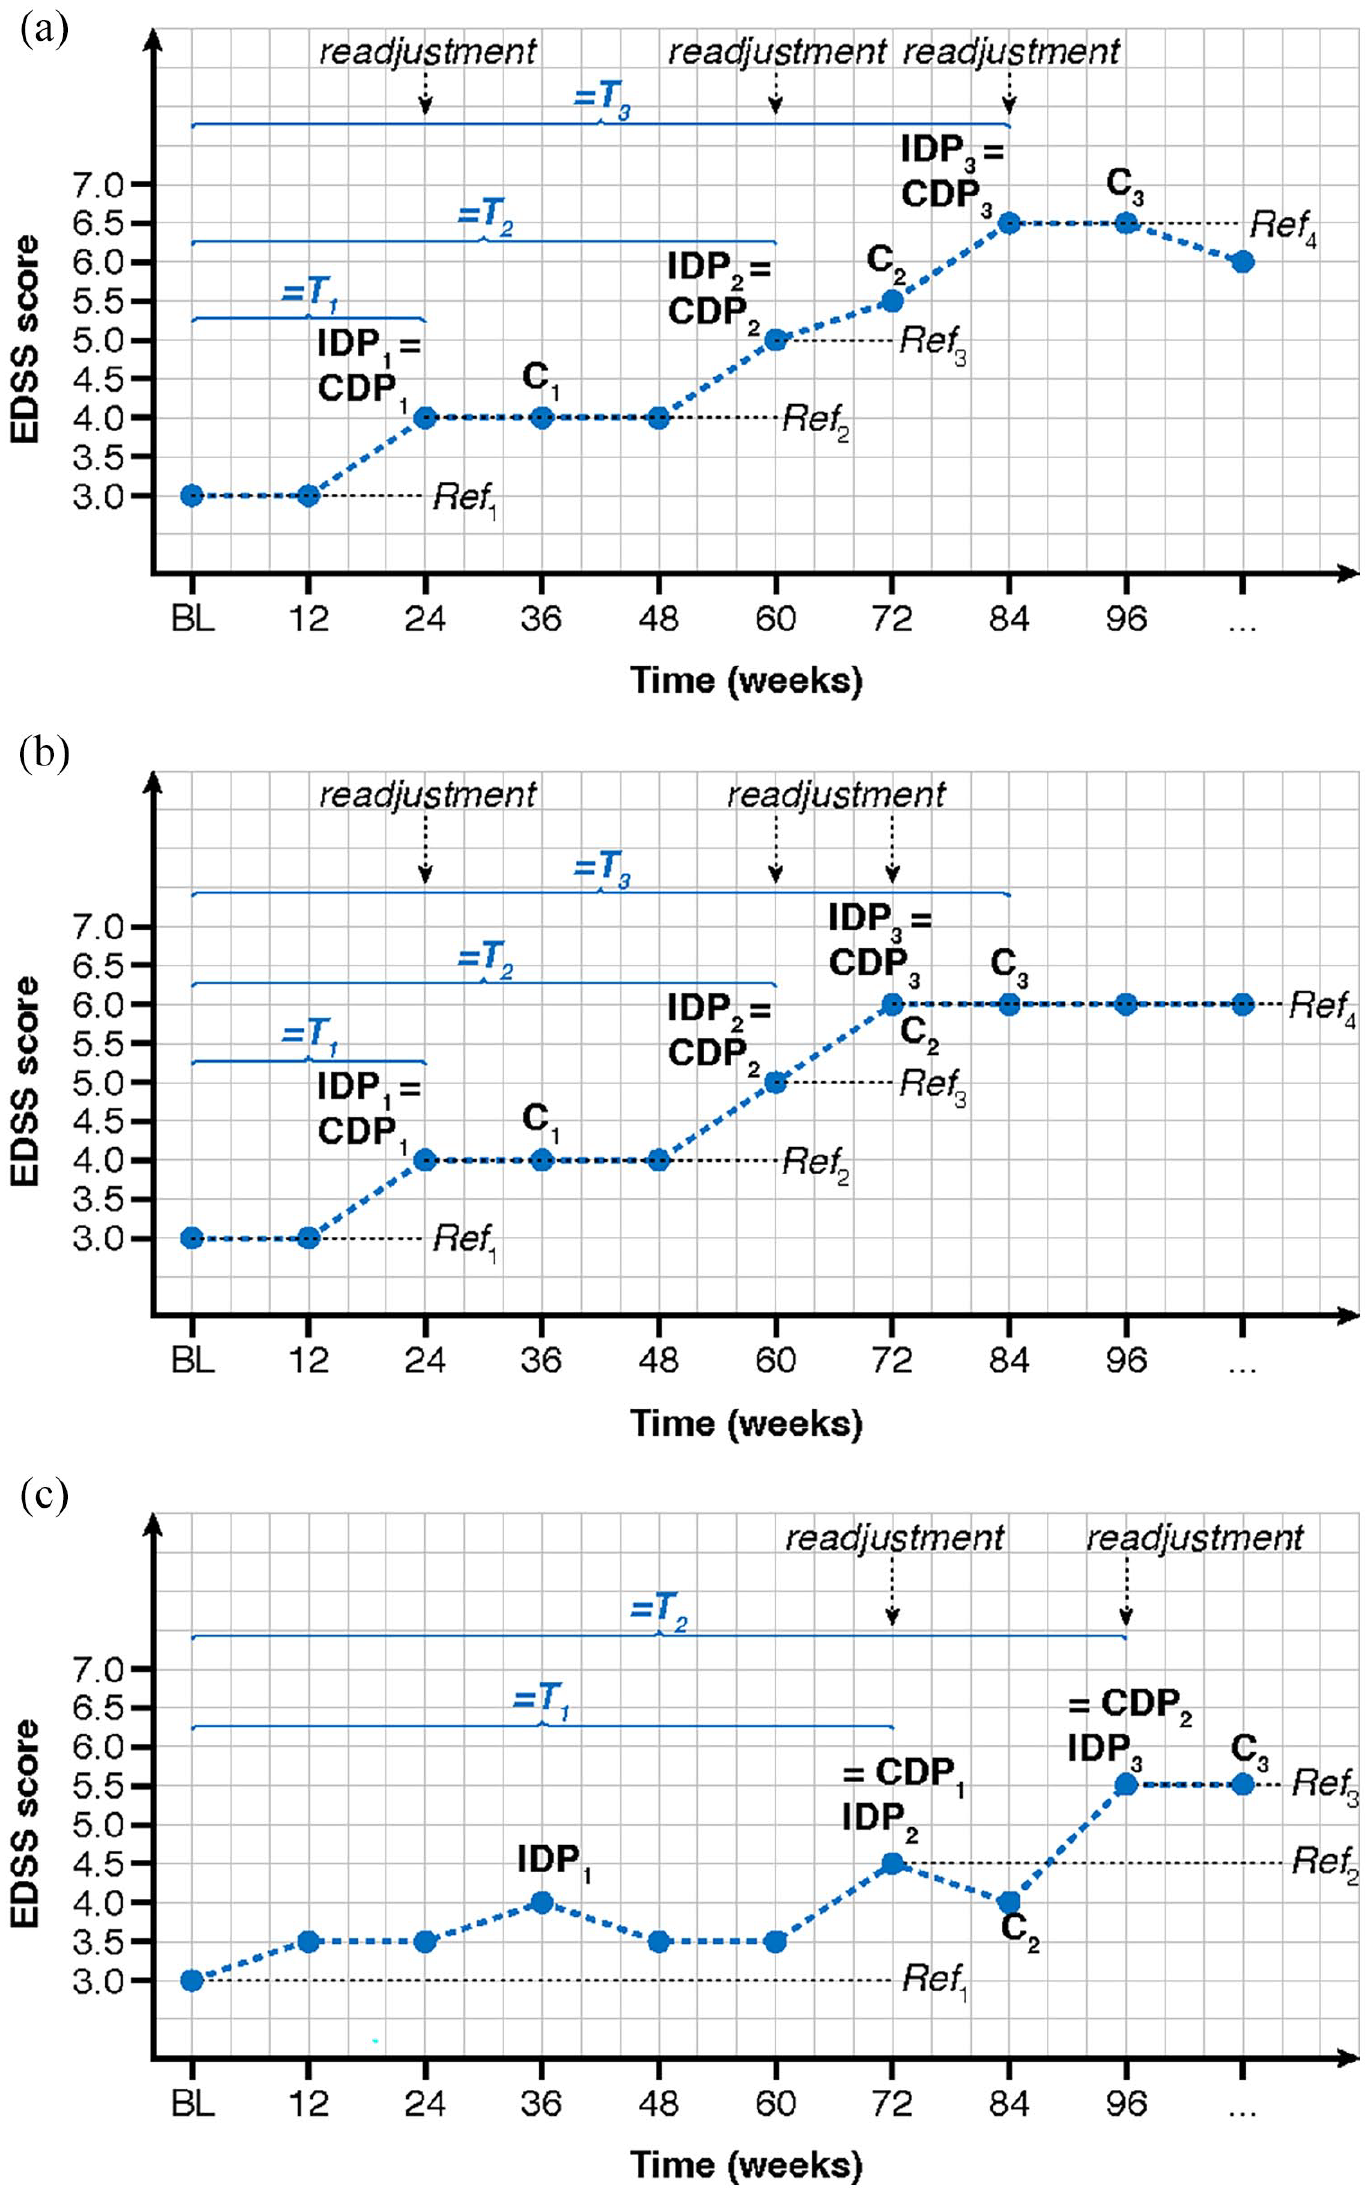
The definitions of first and recurrent 12-week confirmed disability progression (CDP12) events. (a) Example of three non-overlapping CDP12 events with K = J = 3. (b) Example where confirmation of one CDP12 event (IDP2 is confirmed at C2) is based on the same assessment as the onset of the next CDP12 event (IDP3 marks onset of CDP3), with K = J = 3. (c) Example where the first IDP1 at week 36 cannot be confirmed and consequently does not become a CDP12 event, with K = 3 and J = 2.
Data sets—ORATORIO and OPERA I/II trials
Data from the two identically designed phase 3, multicenter, randomized, double-blind, double-dummy, parallel-group OPERA I and OPERA II trials (OPERA I/NCT01247324 and OPERA II/NCT01412333) in patients with RMS were used for the analyses. Study details have been reported previously. 13 Patients (N = 821 and N = 835 in the OPERA I and II trials, respectively) were randomized (1:1) to receive either ocrelizumab (OCR) 600 mg by intravenous infusion every 24 weeks or subcutaneous interferon (IFN) β-1a three times per week at a dose of 44 μg throughout the 96-week treatment period. The relevant institutional review boards/ethics committees approved the trial protocols, and all patients provided written informed consent.
Data from the phase 3, multicenter, randomized, double-blind, placebo (PBO)-controlled, parallel-group ORATORIO trial (NCT01194570) in patients with PPMS were also used for the analyses. Study details have been reported previously. 14 Patients (N = 732) were randomized in a 2:1 ratio to receive OCR 600 mg (N = 488) or PBO (N = 244) every 24 weeks for at least 120 weeks until a pre-specified number of CDP12 events occurred.
Statistical analysis
A Cox regression model was used for the analysis of time to the first CDP event, with the hazard ratio (HR) as target parameter. Two marginal rate–based methods were investigated for the primary analysis of recurrent CDP events: negative binomial (NB) and Lin–Wei–Yang–Ying (LWYY) models. NB and LWYY both target the marginal rate function, that is, the unconditional instantaneous probability of an event at time t. 15 As compared to conditional recurrent event models (e.g. Andersen–Gill, Prentice–Williams–Peterson), they retain the beneficial aspects of randomization, provide treatment effect estimates with a causal interpretation, and are therefore recommended for the primary analysis of an RCT with recurrent CDP events.16,17
The NB method models a subject’s number of CDP events and includes their (log-transformed) follow-up duration as an offset. It assumes that the rate function is constant over time and, if this is fulfilled, then the resulting treatment effect estimate is a simple multiplicative factor and can be interpreted as a rate ratio (RR). Unobserved heterogeneity between subjects is modeled via gamma-distributed random effects, often referred to as frailities. 18 Sample size formulas for fixed and group-sequential designs with NB outcomes have been published. 19
The LWYY method is one of the most commonly used models for recurrent event analysis in RCTs with negligible mortality. 15 It allows for a varying rate function over time and assumes that the treatment acts multiplicatively on the rate function. No assumptions regarding the baseline rate function or the dependence structure between the recurrent events are required, but it typically assumes recurrent event process and time to censoring to be independent (given covariates). The target parameter is a ratio of rate functions across the treatment groups (i.e. RR), and inference is based on a robust sandwich variance estimator. For a comprehensive discussion of these methods, we refer to the Supplement, Cook and Lawless, and Bühler.16,17
Design of the simulation study
A simulation study was set up to compare the power and type I error rate of the time-to-first and recurrent event methods in a controlled environment. The choice of simulation parameters (including event generating process) was based on the ORATORIO trial in which all patients were followed until a predetermined number of first CDP12 events had occurred, resulting in a median follow-up of 29.8 months. We simulated hypothetical 1:1 randomized trials, which enrolled 1,000 subjects with PPMS uniformly over 12 months and followed them until 246 first CDP events were observed. This number of events guarantees a power of 80% for the time-to-first-event Cox analysis assuming a marginal HR of 0.7. CDP events were simulated according to a (mixed) non-homogeneous Poisson process, where the baseline function was of Weibull shape and slightly decreasing over time. A subject’s frailty term was generated from a gamma distribution whose variance was varied between 0 (no heterogeneity), 0.15 (mild heterogeneity corresponding to the impact of baseline prognostic factors observed in ORATORIO), and 1 (large heterogeneity). The subject’s treatment effect was chosen as either 1 (no effect) or 0.7 (beneficial effect) on the conditional HR scale (see also the Supplemental Material).
Patient drop-out was modeled using an exponential distribution with an annual drop-out probability of 8.7%. For each of the simulation scenarios, the proportion of rejected null hypotheses among 10,000 simulation runs was summarized for all analysis methods. This proportion corresponds to the type I error for a treatment effect of 1 and to the power for the treatment effect of 0.7.
Full details of the simulation study are reported in Bühler. 17 All simulations and other analyses were conducted with the statistical software R, version 3.5.2.
Results
OPERA I/II and ORATORIO trials
We have applied the above definition for recurrent CDP events to the OPERA and ORATORIO trials. In the OPERA I trial, 50 and 31 patients in the IFN and OCR treatment arms, respectively, experienced at least one CDP12 event, and a total of 56 and 33 CDP12 events, corresponding to an increase in events of 12.0% and 6.5%, respectively (Table 1). In the OPERA II trial, 63 and 44 patients in the IFN and OCR treatment arms, respectively, experienced at least one CDP12 event, and a total of 69 (+9.5%) and 46 (+4.5%) CDP12 events. In the ORATORIO trial, 96 and 160 patients in the PBO and OCR treatment arms, respectively, experienced at least one CDP12 event, and a total of 124 (+29.2%) and 190 (+18.8%) CDP12 events (Table 1). Similarly increased yield of events was observed for CDP24 (Table 1).
Distribution of first and recurrent 12- and 24-week confirmed disability progression events in the OPERA and ORATORIO trials.
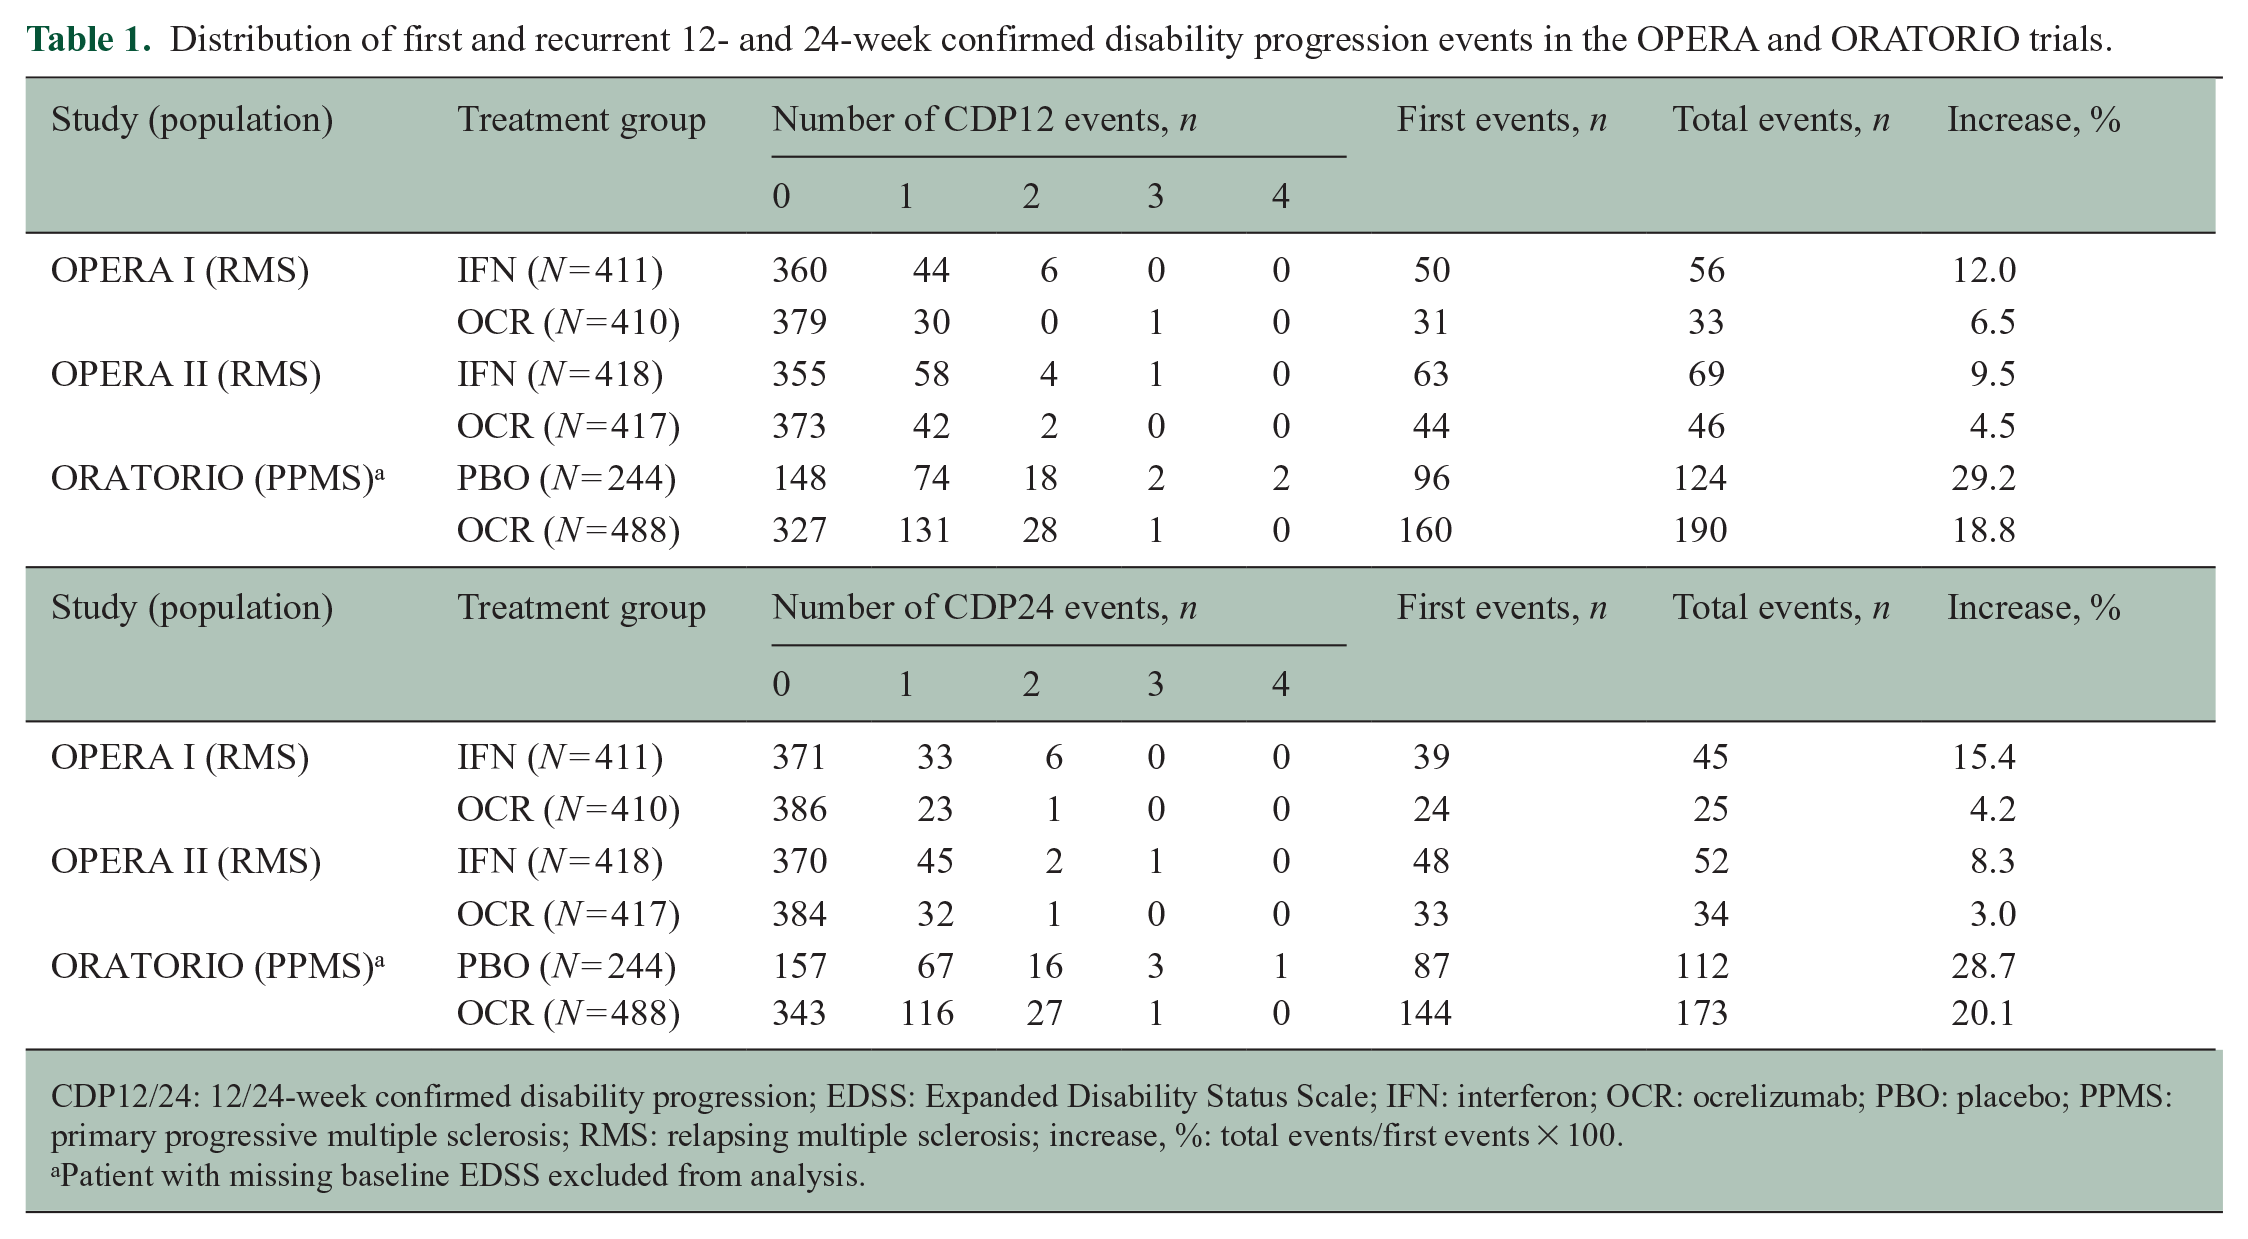
CDP12/24: 12/24-week confirmed disability progression; EDSS: Expanded Disability Status Scale; IFN: interferon; OCR: ocrelizumab; PBO: placebo; PPMS: primary progressive multiple sclerosis; RMS: relapsing multiple sclerosis; increase, %: total events/first events × 100.
Patient with missing baseline EDSS excluded from analysis.
For time-to-first-event analyses, the accrual of events over time is typically visualized using the Kaplan–Meier methods, where the y-axis shows the estimated proportion of patients with a first event out of the overall study population (Figure 2(a), (c), and (e)). For recurrent event analyses, the accrual of events over time is typically shown as cumulative mean function, where the y-axis shows the estimated average number of events per patient in the overall study population (Figure 2(b), (d), and (f)). By Week 96 of the OPERA I study, 13.0% and 8.3% of patients in the IFN and OCR arm, respectively, had experienced at least one CDP12 event, and the average number of CDP12 events per patient was 0.14 and 0.09, respectively. By Week 96 of the OPERA II study, 17.5% and 11.1% of patients in the IFN and OCR arm, respectively, had experienced at least one CDP12 event, and the average number of CDP12 events per patient was 0.20 and 0.12, respectively. By Week 120 of the ORATORIO study, 34.0% and 30.2% of patients in the PBO and OCR arm, respectively, had experienced at least one observed CDP12 event, and the average number of observed CDP12 events per patient was 0.46 and 0.37, respectively. Event rates in all three trials have been found to be approximately constant, justifying the use of the NB model.
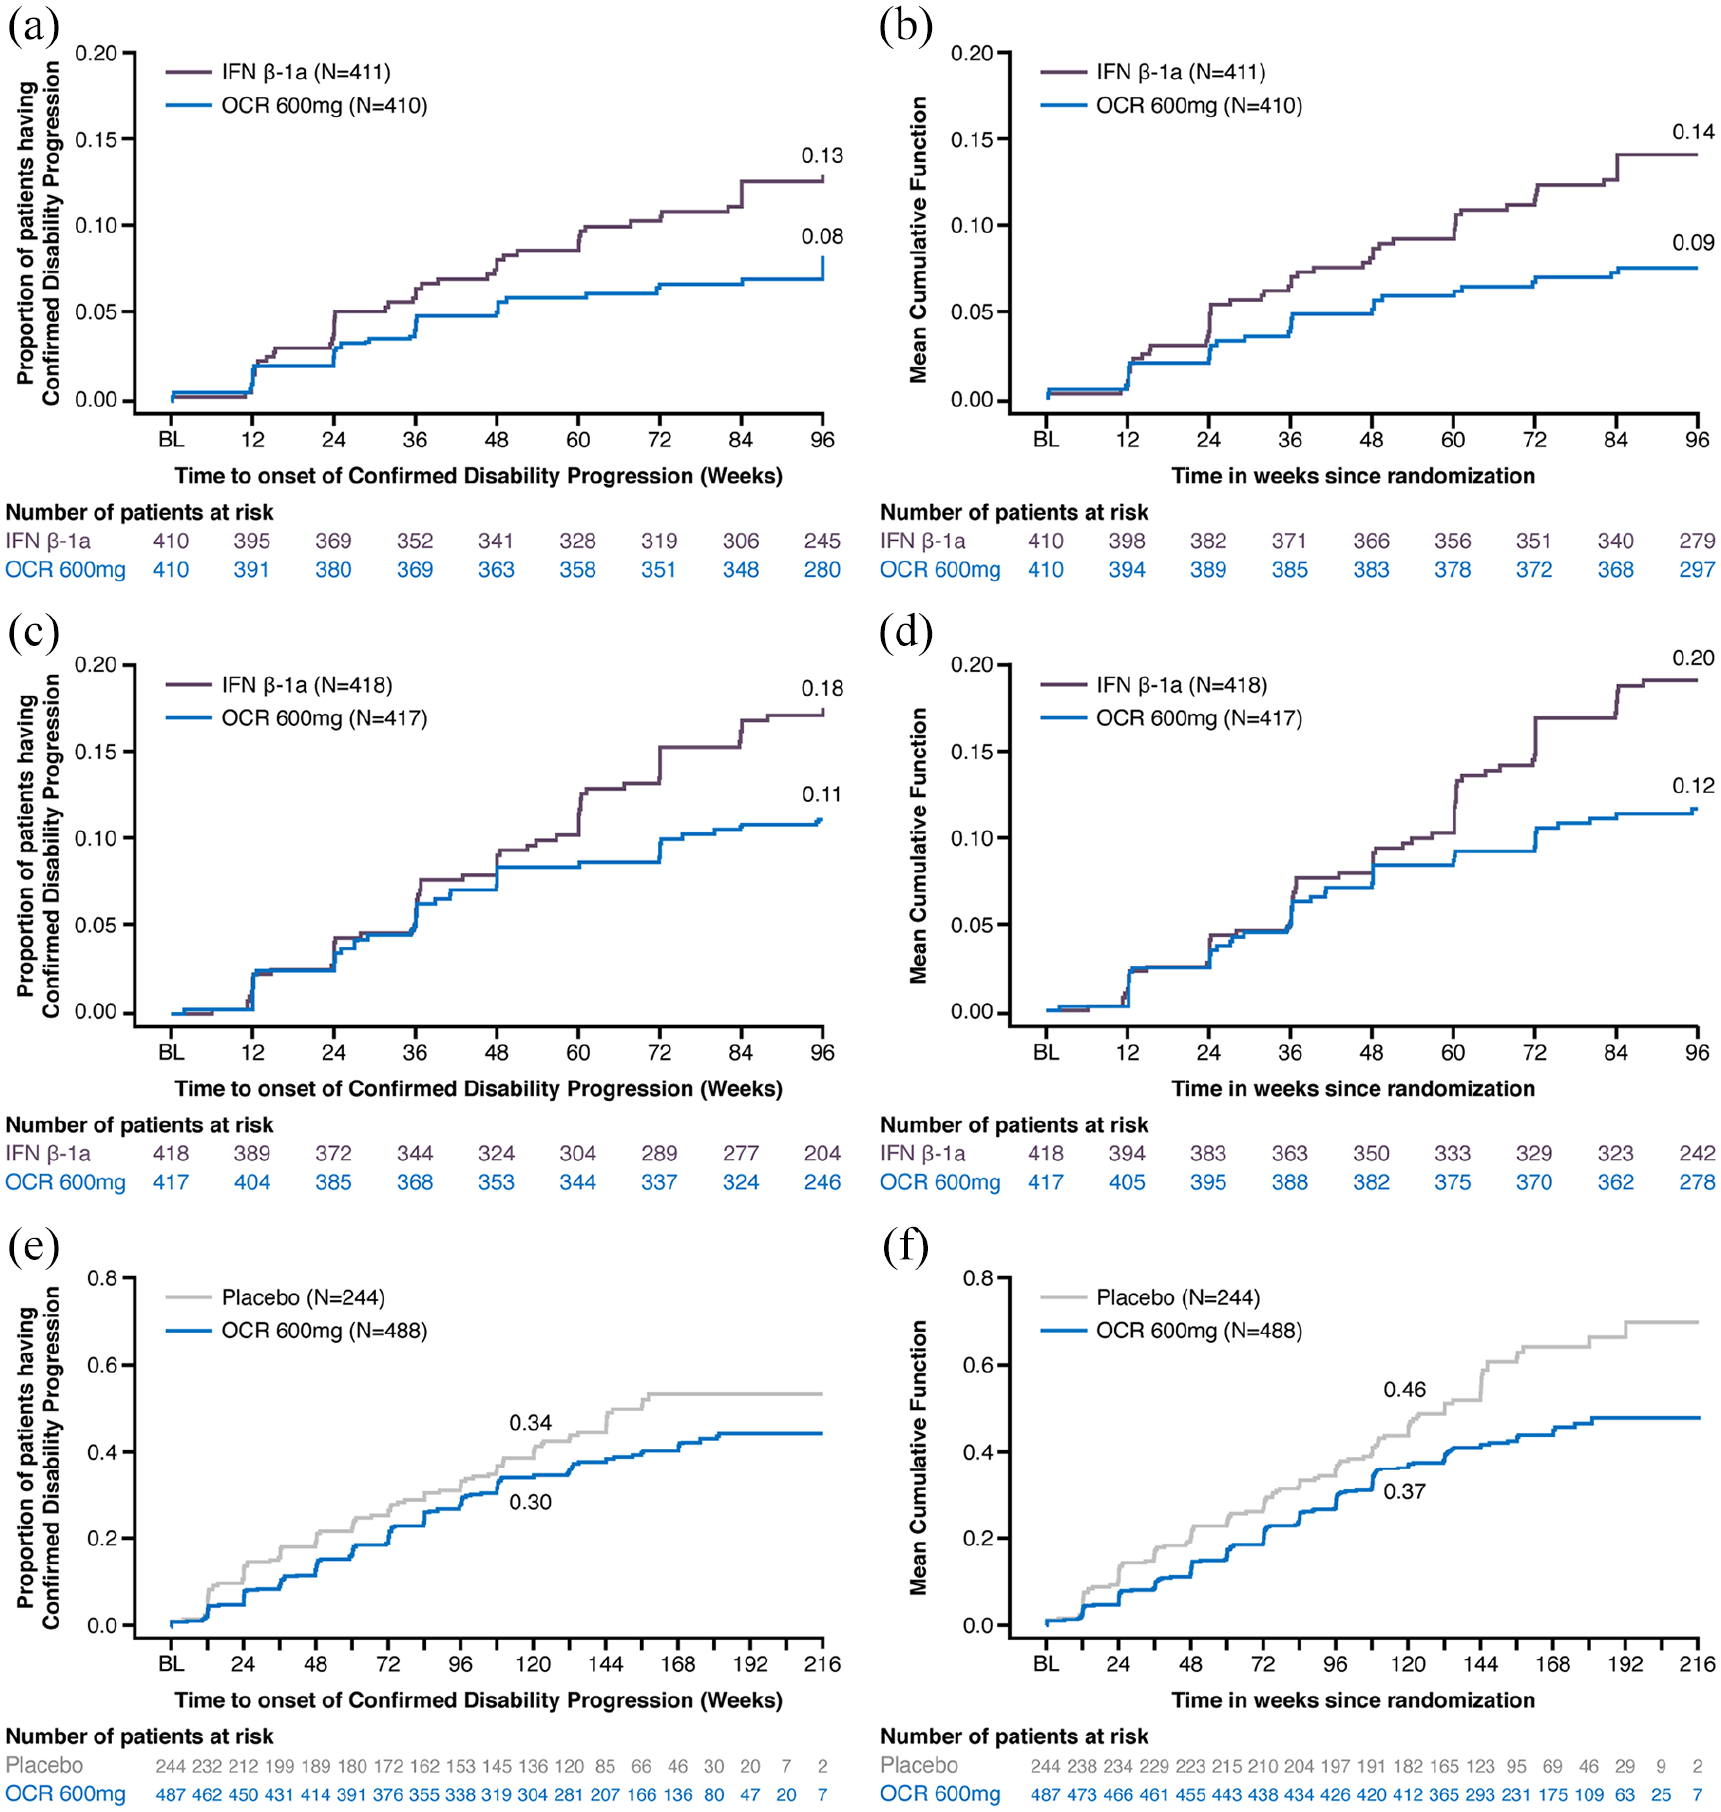
Cumulative risk of a first 12-week confirmed disability progression (1 − Kaplan–Meier estimate; left panels) and mean cumulative number of 12-week confirmed recurrent disability progressions (Nelson–Aalen type estimate; right panels) over time in the (a, b) OPERA I; (c, d) OPERA II; and (e, f) ORATORIO trials.
The results using the different models are summarized for all three trials in Table 2. For all trials and confirmation period durations (12 and 24 weeks), the treatment effect on the recurrent events was comparable to the time-to-first-event analysis, the recurrent event analyses being associated with narrower confidence intervals (CIs).
Treatment effect estimates of different first and recurrent event models for 12- and 24-week confirmed disability progression events in the OPERA and ORATORIO trials.
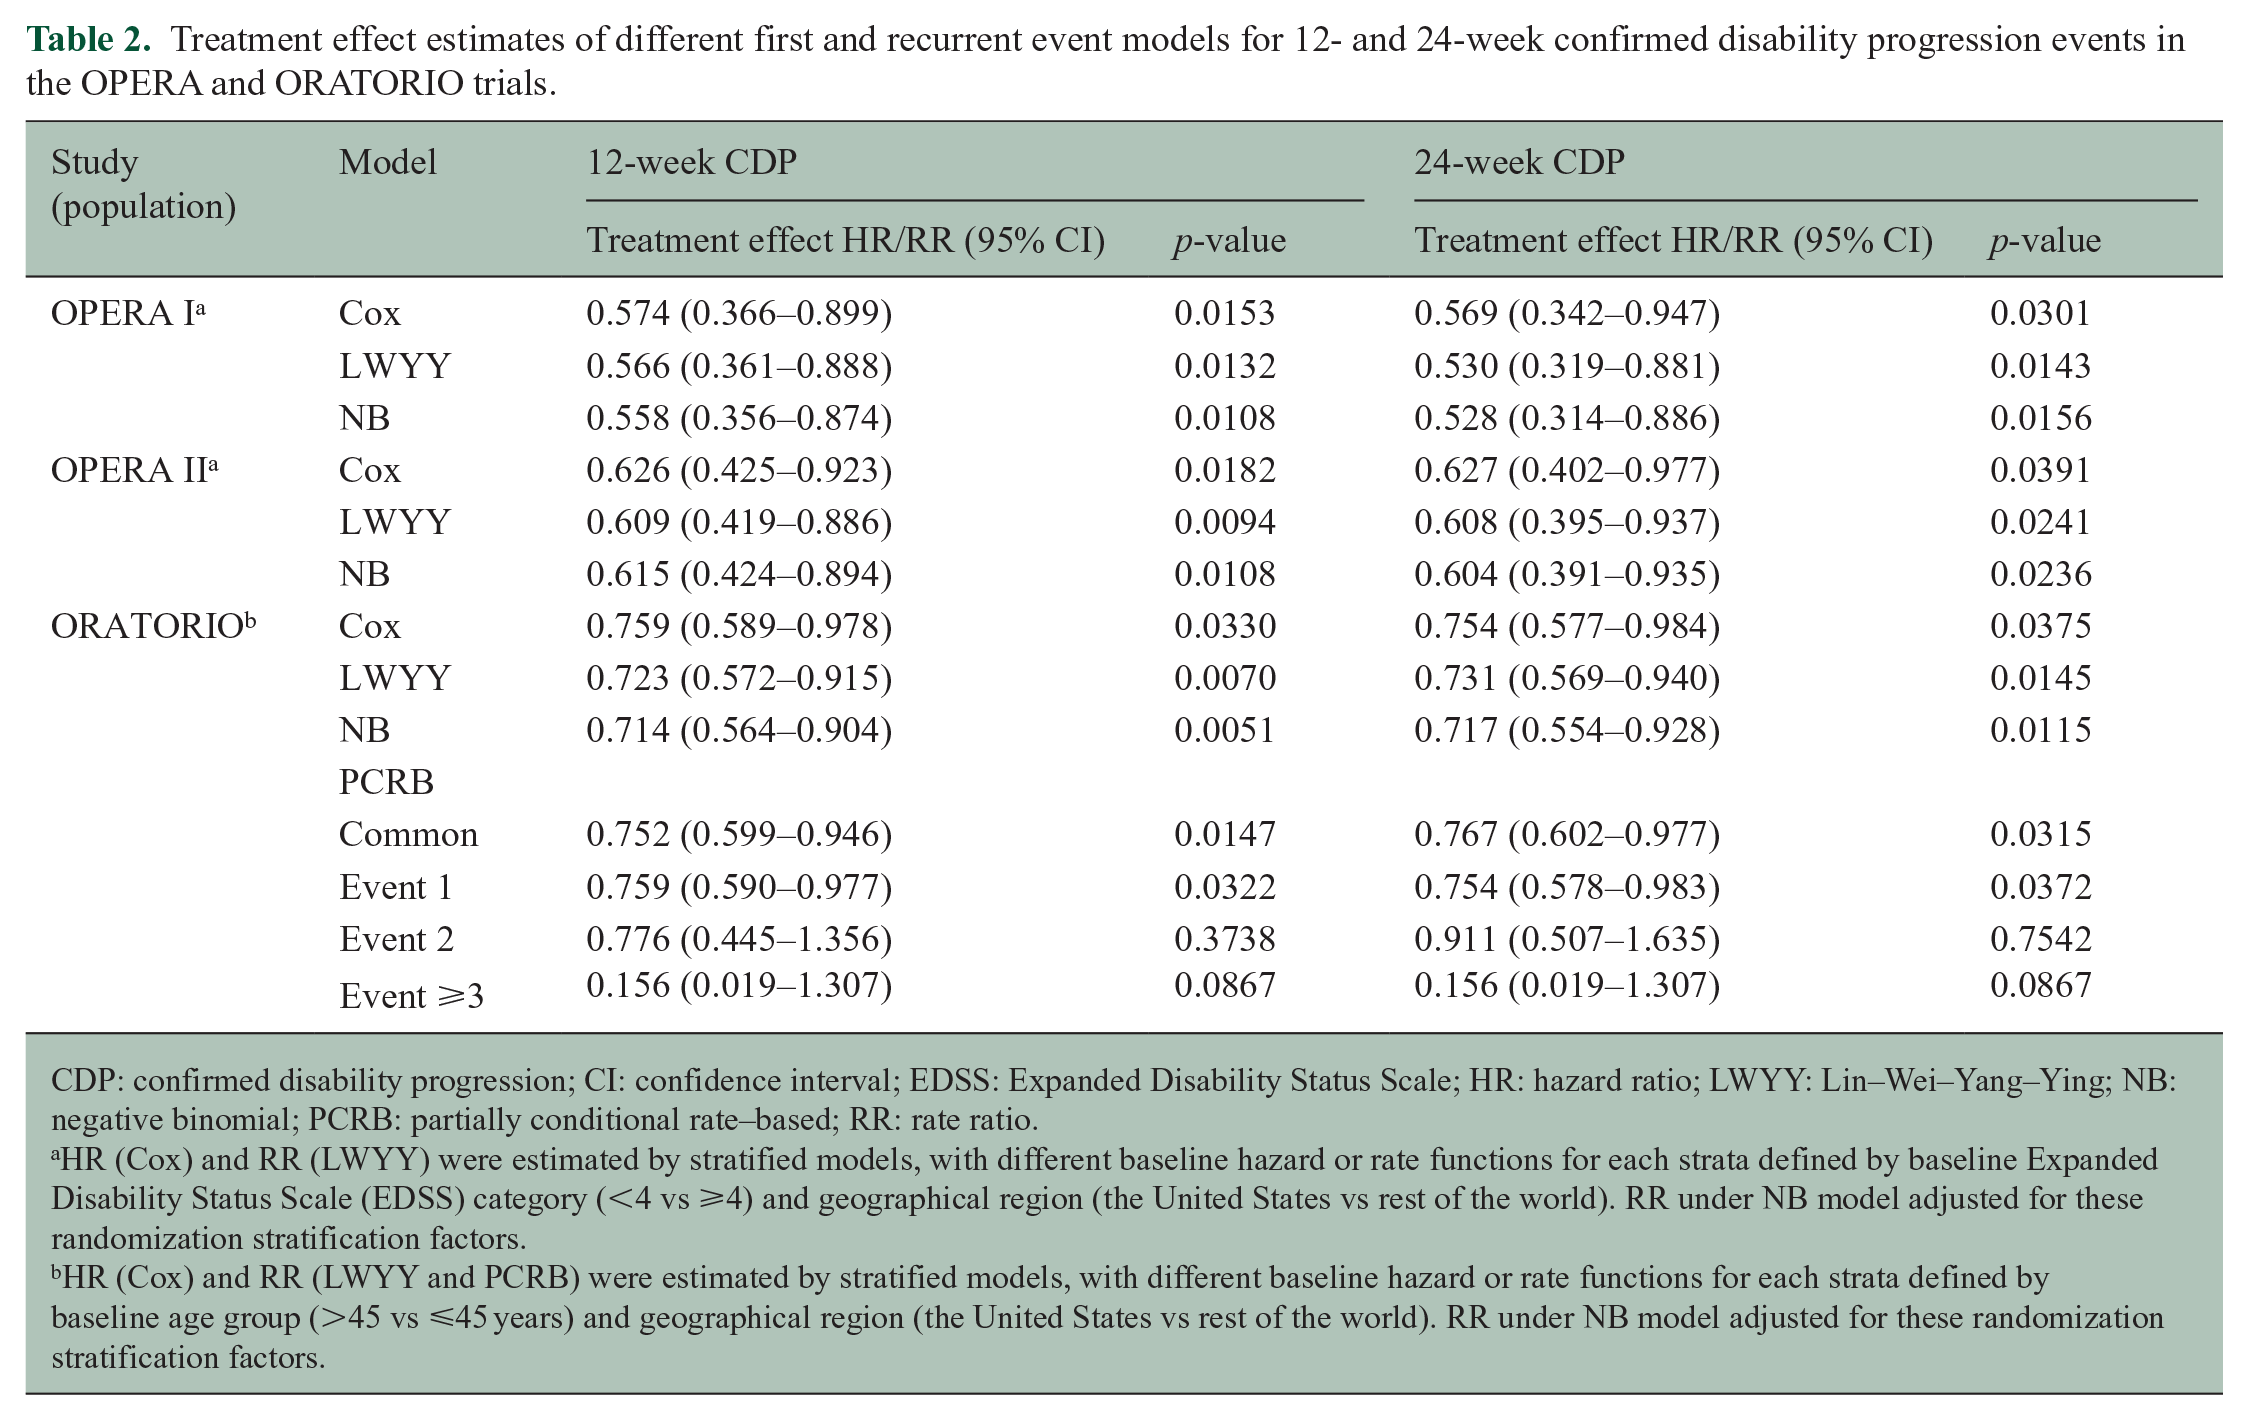
CDP: confirmed disability progression; CI: confidence interval; EDSS: Expanded Disability Status Scale; HR: hazard ratio; LWYY: Lin–Wei–Yang–Ying; NB: negative binomial; PCRB: partially conditional rate–based; RR: rate ratio.
HR (Cox) and RR (LWYY) were estimated by stratified models, with different baseline hazard or rate functions for each strata defined by baseline Expanded Disability Status Scale (EDSS) category (<4 vs ⩾4) and geographical region (the United States vs rest of the world). RR under NB model adjusted for these randomization stratification factors.
HR (Cox) and RR (LWYY and PCRB) were estimated by stratified models, with different baseline hazard or rate functions for each strata defined by baseline age group (>45 vs ⩽45 years) and geographical region (the United States vs rest of the world). RR under NB model adjusted for these randomization stratification factors.
For the ORATORIO trial, we additionally explored the impact of treatment on a subject’s first, second, or third CDP event using partially conditional rate–based (PCRB) models.16,17 The PCRB model with a common treatment effect is similar to the LWYY model, but additionally adjusts for event-specific baseline rate functions. The event-specific PCRB analysis for the first, second, or third CDP event, respectively, gives an estimate of the treatment effect among all subjects (for the first event) or among those subjects who have already experienced one or two earlier CDP events. For both confirmation period durations (12 and 24 weeks), the observed treatment effects for secondary and later events are in close agreement with the time-to-first-event results (Table 2), and so the treatment effect was found to be consistent across the first, second, and later CDP events. However, by conditioning on the occurrence of previous CDP events, the PCRB model no longer compares randomized treatment groups, and hence, the resulting treatment effect estimates lack a formal causal interpretation. Such an exploratory analysis is nevertheless meaningful in providing a supplementary characterization of the treatment effect.
Simulation study
For the simulation scenarios with a treatment effect of 0.7, the median study duration, that is, the time until the targeted 246 first CDP events had been observed, was 27, 28, and 32 months, respectively, assuming no, mild, or large heterogeneity. The corresponding median number of all CDP events (compared with the number of first events) was 286 (+16%), 293 (+19%), and 335 (+36%), respectively.
The average treatment effect for the time-to-first CDP was 0.700, 0.704, and 0.730 for no, mild, or large heterogeneity, respectively. In contrast, all recurrent event methods gave an average treatment effect of 0.70, that is, they were approximately unbiased for the “real” RR = 0.7. If there was no heterogeneity, LWYY, NB, and Cox analyses result in estimates that are consistent for the same parameter (i.e. RR = HR = 0.7). However, if there is between-subject heterogeneity, parameters from these analyses differ, and treatment effects for the time-to-first-event Cox analysis are increasingly attenuated with increasing heterogeneity. This can be explained by a selection effect: as the follow-up time increases, an increasing number of subjects prone to worsening are withdrawn from the risk set, and only the subjects less prone to worsening remain. This selection does not occur for recurrent event analyses, as follow-up of subjects after their first event is also included in the analysis. For the simulation scenarios with no treatment effect, all methods were approximately unbiased for HR = 1.0 or RR = 1.0, assuming no, mild, or large heterogeneity.
The estimated power and type I error rate for all simulation scenarios considered are shown in Figure 3(a) and (b). The power of the Cox model is 80% assuming no heterogeneity but deteriorates to 68% for large heterogeneity. The power of the NB and LWYY models is similar and ranges from 85% (no heterogeneity) to 80% (large heterogeneity). All models maintain the type I error rate at approximately 5%.
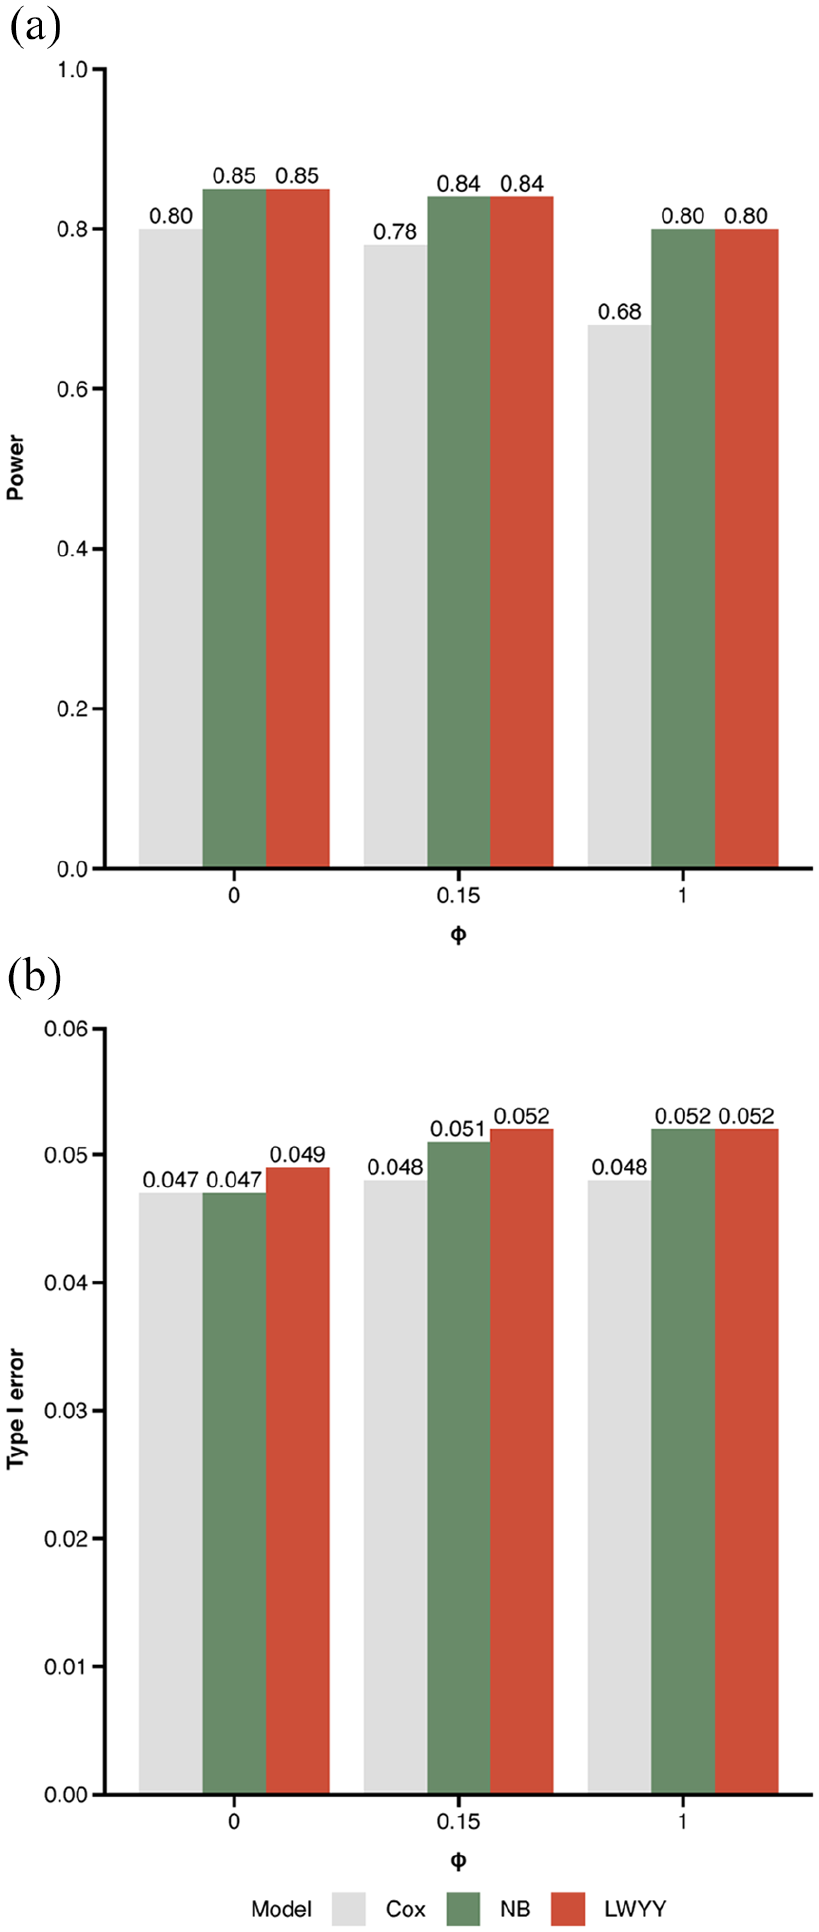
(a) Power and (b) type I error for all simulation scenarios depending on the between-subject heterogeneity parameter ϕ. The intermediate value of ϕ = 0.15 corresponds to the heterogeneity observed in the ORATORIO trial. Results are based on 10,000 simulations per scenario implying an approximate precision (standard error) of ±0.004 for the simulated power and of ±0.002 for the simulated type I error, respectively.
In simulations without heterogeneity, the power of the recurrent event analysis compared with the time-to-first-event analysis increased from 80% to 85%. A recurrent event analysis with 80% power would require approximately 13% less recurrent events, and thus 13% less subjects than a time-to-first-event analysis for the same power and study duration. For scenarios with a higher heterogeneity, the power gains associated with a recurrent event analysis were larger. As a consequence, 13% is a conservative estimate of the sample size savings associated with recurrent event analysis in our scenarios.
Discussion
Clinical trials in MS entail large sample sizes and long follow-up periods in order to generate reliable results with regards to the effect of an intervention. 4 Disability progression measured by the EDSS is a key efficacy outcome used in phase 3 MS clinical trials. 5 Given that disability will continue to worsen after the occurrence of the first CDP event, 20 especially in progressive forms of MS, we demonstrated that the analysis of recurrent CDP events after the first event increases the statistical power of a study, and captures clinically meaningful events more comprehensively.
In the recurrent event analyses, the number of CDP12 events in the two RMS studies increased by 7.5%–9.9% compared with the respective time-to-first-event analyses; the corresponding relative increase in the PPMS study was 22.7%. The simulation study, that mimicked a PPMS trial, confirmed that the recurrent event analysis confers gains in statistical power. We conservatively estimated that a trial powered to a recurrent event endpoint would require at least 13% less subjects compared with a trial powered for the time-to-first-event analysis. In contrast, the benefits of recurrent event analyses would be less apparent in RMS trials with fewer recurrent events observed. Nevertheless, the recurrent event methodology might have meaningful advantages in RMS trials with longer follow-up.
It is important that appropriate statistical methods are used to compare recurrent events in randomized trials. Existing recurrent event analysis methods differ in that they either model the conditional hazard function (also known as the intensity function), that is, a subject’s instantaneous probability of a new event at any time conditional on the entire process history, or the marginal rate function. The popular, intensity-based Andersen–Gill and Prentice–Williams–Peterson models are powerful frameworks for the descriptive analysis of complex recurrent event processes, but do not support causal inferences in randomized trials.16,17 For the primary analysis of an RCT, marginal rate–based models (NB and LWYY) are recommended because they retain the randomized treatment group analysis and hence allow for causal effect interpretation.
In our simulation study, we showed that both methods (NB and LWYY) controlled the type I error rate and had comparable power. Currently, the NB model is the recommended method for the analysis of annualized relapse rates in MS trials. 18 An advantage of the LWYY model is that it is valid regardless of the shape of the baseline rate function, unlike the NB model, which assumes a constant rate function. In practice, since event rates in MS patients were found to be approximately constant over time at least in the studies analyzed here, both models can be chosen for the primary analysis, with the other as a sensitivity analysis.
The use of the proposed recurrent event methodology requires that all patients stay on randomized treatment for the full duration of the trial. In situations where effective rescue treatments for progressing patients are available, it might be ethically questionable for patients to stay on a potentially ineffective therapy after the first CDP. Hence, an inherent limitation of the proposed recurrent event method is that it will be more affected by premature treatment discontinuations and study withdrawals than a time-to-first-event analysis. One possible approach to mitigate this disadvantage is to ignore later rescue medication and analyze patients according to the intention-to-treat intention-to-treat principle. Another approach would be to analyze premature treatment discontinuations and study withdrawals as a competing risk using recurrent event methodology accounting for competing risks.21,22
We extended the standard definitions of EDSS-based CDP to recurrent events. For individual subjects, EDSS trajectories over time may be quite variable and show alternation of improvement and worsening events complicating their interpretation. Other MS disability endpoints including objective performance outcome measures, for example, the time to the first confirmed progression in functional impairment of ambulation and manual dexterity, as defined by changes in the Timed 25-Foot Walk (T25FW) or the 9-Hole Peg Test (9HPT),23,24 respectively, or in cognitive tests like the Symbol Digit Modalities Test (SDMT), are also frequently reported in clinical studies, and may be characterized by less random variation and measurement error in particular in progressive MS. Future extension of the recurrent event analysis methodology to include additional and ideally more objective MS performance outcome measures should be considered.
Recurrent event methods enable the use of patient outcome data after the occurrence of first CDP for statistical inference and have wide applications. Beyond RCTs, recurrent event methods are also promising for both long-term extension studies and observational cohort analyses with long follow-up periods, where after a few years of follow-up, most patients will have experienced a first CDP. In these studies, the long-term quantification of the cumulative mean or the annual rate of progression using recurrent event analysis might enable more comprehensive capture of disability experience in patients’ disease trajectories.
Supplemental Material
sj-docx-1-msj-10.1177_13524585221125382 – Supplemental material for Recurrent disability progression endpoints in multiple sclerosis clinical trials
Supplemental material, sj-docx-1-msj-10.1177_13524585221125382 for Recurrent disability progression endpoints in multiple sclerosis clinical trials by Alexandra Bühler, Marcel Wolbers, Fabian Model, Qing Wang, Shibeshih Belachew, Marianna Manfrini, Johannes Lorscheider, Ludwig Kappos and Jan Beyersmann in Multiple Sclerosis Journal
Footnotes
Acknowledgements
The authors thank all patients, their families, and the investigators who participated in the trials contained within these analyses. Writing and editorial assistance was provided by Martha Hoque of Articulate Science, UK, and funded by F. Hoffmann-La Roche Ltd.
Declaration of Conflicting Interests
The author(s) declared the following potential conflicts of interest with respect to the research, authorship, and/or publication of this article: A.B. completed an internship at F. Hoffmann-La Roche Ltd. while researching the submitted work. During completion of the work related to this manuscript, A.B. was an MSc student at the Ulm University, 89081 Ulm, Germany. M.W. is an employee and shareholder of F. Hoffmann-La Roche Ltd. F.M. is an employee and shareholder of Denali Therapeutics. During completion of the work related to this manuscript, F.M. was an employee of F. Hoffmann-La Roche Ltd. Q.W. is an employee of F. Hoffmann-La Roche Ltd. S.B. is an employee and shareholder of Biogen Inc. During completion of the work related to this manuscript, S.B. was an employee of F. Hoffmann-La Roche Ltd. M.M. is an employee and shareholder of F. Hoffmann-La Roche Ltd. J.L. has received research support from Innosuisse—Swiss Innovation Agency, Biogen, and Novartis; and speaking honoraria and/or fees for serving on advisory boards from Novartis, Roche, and Teva. L.K.s’ institution (University Hospital Basel) has received the following exclusively for research support: steering committee, advisory board, and consultancy fees from: Actelion, Bayer HealthCare, Biogen, BMS, Genzyme, GlaxoSmithKline, Janssen, Japan Tobacco, Merck, Novartis, Roche, Sanofi, Santhera, Shionogi, TG Therapeutics; speaker fees from: Bayer HealthCare, Biogen, Merck, Novartis, Roche, and Sanofi; support of educational activities from: Allergan, Bayer HealthCare, Biogen, CSL Behring, Desitin, Genzyme, Merck, Novartis, Roche, Pfizer, Sanofi, Shire, and Teva; license fees for Neurostatus products and grants from: Bayer HealthCare, Biogen, European Union, InnoSwiss, Merck, Novartis, Roche, Swiss MS Society, and Swiss National Research Foundation. J.B.’s institution has received a research collaboration grant from F. Hoffmann-La Roche Ltd. not related to the current research.
Funding
The author(s) disclosed receipt of the following financial support for the research, authorship, and/or publication of this article: This research was funded by F. Hoffmann-La Roche Ltd., Basel, Switzerland.
Data Sharing Statement
For eligible studies, qualified researchers may request access to individual patient-level clinical data through a data request platform. At the time of writing this, request platform is Vivli (https://vivli.org/ourmember/roche/). For up to date details on Roche’s Global Policy on the Sharing of Clinical Information and how to request access to related clinical study documents, see here ![]() . Anonymised records for individual patients across more than one data source external to Roche cannot, and should not, be linked due to a potential increase in risk of patient re-identification.
. Anonymised records for individual patients across more than one data source external to Roche cannot, and should not, be linked due to a potential increase in risk of patient re-identification.
Supplemental Material
Supplemental material for this article is available online.
References
Supplementary Material
Please find the following supplemental material available below.
For Open Access articles published under a Creative Commons License, all supplemental material carries the same license as the article it is associated with.
For non-Open Access articles published, all supplemental material carries a non-exclusive license, and permission requests for re-use of supplemental material or any part of supplemental material shall be sent directly to the copyright owner as specified in the copyright notice associated with the article.