
Abstract
Background:
Overall Disability Response Score (ODRS) is a composite endpoint including Expanded Disability Status Scale, Timed 25-foot Walk, and 9-Hole Peg Test, designed to quantify both disability improvement and worsening in multiple sclerosis (MS).
Objective:
To assess the sensitivity and clinical meaningfulness of ODRS using natalizumab Phase 3 data sets (AFFIRM in relapsing-remitting MS and ASCEND in secondary progressive MS).
Methods:
Differences in ODRS over 96 weeks, ODRS at Week 96, and slope of ODRS change per year between natalizumab and placebo groups were analyzed. Correlation between ODRS and changes in patient-reported outcomes was also analyzed.
Results:
The difference (95% confidence interval (CI)) in the ODRS over 96 weeks between natalizumab and placebo groups was 0.34 (0.21–0.46) in AFFIRM (p < 0.001), and 0.18 (0.03–0.34) in ASCEND (p = 0.021). Significant differences between treatment arms were also observed in ODRS at Week 96 and in the slope of change per year in both studies. There was a significant linear correlation between ODRS at Week 96 and the change from baseline in both the physical and mental components of the 36-item Short Form Survey (SF-36) in both studies.
Conclusion:
This analysis supports ODRS as a sensitive and potentially clinically meaningful disability outcome measure in MS.
Keywords
Introduction
Multiple sclerosis (MS) is a chronic inflammatory and degenerative demyelinating disorder of the central nervous system (CNS) with substantial impact on health-related quality of life.1,2 Current disease-modifying therapies (DMTs) effectively reduce disease activity and the associated worsening of disability.3 –5 Avoiding disability progression and improving acquired disability are critical unmet needs for MS treatments. Accurate capturing of changes including improvements in disability trajectories in MS clinical trials can be challenging due to the heterogeneity of neurological deficits and the limitations of current outcome measures.5 –10 In particular, proof-of-concept phase 2 MS trials that focus on disability changes need to determine whether there is potential treatment response based on a relatively smaller sample size and a shorter treatment duration than pivotal trials. Unlike outcome measures for disease activity, sensitive imaging biomarkers for these phase 2 trials remain to be established.
Although the Expanded Disability Status Scale (EDSS) 11 is a widely used disability measurement in MS trials, it does not adequately measure walking speed, upper limb, or cognitive function, which are frequently compromised in patients.8,12 EDSS scores of 4.5–7.5 (on a range of 0–10) are mainly determined by maximal walking distance and do not sufficiently reflect other neurological impairments. In addition, despite improvements in its standardization,13,14 the EDSS has a high intra- and inter-rater variability, especially in the lower range, and has poor responsiveness to change in the higher range of the scale.15,16
The Multiple Sclerosis Functional Composite (MSFC) 10 includes the Timed 25-Foot Walk (T25FW), 17 9-Hole Peg Test (9HPT), 18 and 3-second Paced Auditory Serial Addition Test (PASAT-3) 19 to quantitatively measure the performance in ambulation, upper-extremity function, and cognitive function. 20 Although each of the component performance tests in the MSFC is valid, reliable, and sensitive to change, the clinical meaningfulness of the overall MSFC score (ZMSFC) is difficult to interpret. An alternative approach, evaluating the proportion of participants with confirmed worsening from baseline by 15%–20% in at least one or more of MSFC components, showed correlations with EDSS, relapse rate, and patient-reported outcomes (PROs). 10 A more recent study supported the use of four performance measures, including T25FW, 9HPT, Symbol Digit Modalities Test (SDMT), 21 and low-contrast letter acuity (LCLA), 22 either individually or in a multidimensional test battery, as disability outcome measures. 23
Recognizing the value and limitations of the EDSS, a multicomponent endpoint―the EDSS-Plus 24 ―was evaluated to identify disability progression in participants with secondary progressive MS (SPMS). The addition of confirmed progression on the T25FW and 9HPT in this endpoint was shown to enhance sensitivity as compared with progression on EDSS alone. The EDSS-Plus was used as the primary endpoint in the natalizumab Phase 3 trial in SPMS (ASCEND). 25 Similar to confirmed disability progression and confirmed disability improvement endpoints based on EDSS, the EDSS-Plus classifies study participants into binary categories and evaluates disability progression and improvement separately. In addition, because disability progression and improvement endpoints are generally assessed in a time-to-first-event configuration and participants are censored after reaching the definition of the event of interest, the subsequent longitudinal information on disability changes is not accounted for.8,26
The Overall Disability Response Score (ODRS) was a prospectively defined outcome in the opicinumab SYNERGY study (NCT01864148). 27 ODRS is a composite endpoint that quantifies longitudinally both clinically relevant disability improvement and worsening from baseline in EDSS, T25FW, 9HPT-dominant hand (9HPT-D), and 9HPT-non-dominant hand (9HPT-ND). 27 The objective of these analyses was to evaluate the sensitivity and clinical meaningfulness of ODRS and to assess its potential utility as an enhanced disability endpoint for future proof-of-concept phase 2 MS clinical trials, using historical data from completed natalizumab trials in relapsing-remitting MS (RRMS) 28 and SPMS. 25
Methods
Participants
In this retrospective analysis, the ODRS was assessed in two randomized, placebo-controlled Phase 3 study data sets of natalizumab―AFFIRM 28 and ASCEND. 25 AFFIRM (N = 942) enrolled participants with RRMS, ages 18–50 years, EDSS score of 0–5.0, and at least one medically documented relapse within 12 months before study initiation. 28 ASCEND (N = 889) enrolled participants who had onset of SPMS ⩾ 2 years pre-enrollment, ages 18–58 years, EDSS score of 3.0–6.5, relapse-independent disability progression during the year before enrollment, and no clinical relapse within 3 months prior to randomization. 25 The conduct of these studies complied with the requirements of the Declaration of Helsinki and the International Conference on Harmonization Good Clinical Practice guidelines. All participants provided written informed consent.
Study design
The AFFIRM 28 and ASCEND 25 study designs have been previously described. In both studies, participants received intravenous infusions of placebo or 300 mg of natalizumab every 4 weeks. EDSS, T25FW, and 9HPT were assessed every 12 weeks for approximately 2 years (120 weeks in AFFIRM and 96 weeks in the placebo-controlled period (Part 1) of ASCEND).25,28
To calculate the ODRS at each assessment time point, the change from study baseline in each component (EDSS, T25FW, 9HPT-D, and 9HPT-ND) was evaluated to determine whether the thresholds of improvement or worsening were met. The threshold of improvement on EDSS was a ⩾1-point decrease from baseline and the threshold of worsening on EDSS was a ⩾1-point increase from a baseline score of ⩽5.5, or a ⩾0.5-point increase from a baseline score of 6 or greater. The thresholds of improvement and worsening on T25FW, 9HPT-D, and 9HPT-ND were ⩾15% reduction and ⩾15% increase in time from baseline, respectively. For each component, a change that reached the improvement threshold was scored as +1 and a change that reached the worsening threshold was scored as −1. The scores across the four components were then summed at each time point in individual patients, and the total score ranged from +4 to −4 (Figure 1). A positive ODRS score suggests an overall disability improvement from baseline and vice versa; a positive difference in ODRS between the treatment group versus the control group suggests a potential positive treatment effect on MS-related disability and vice versa.
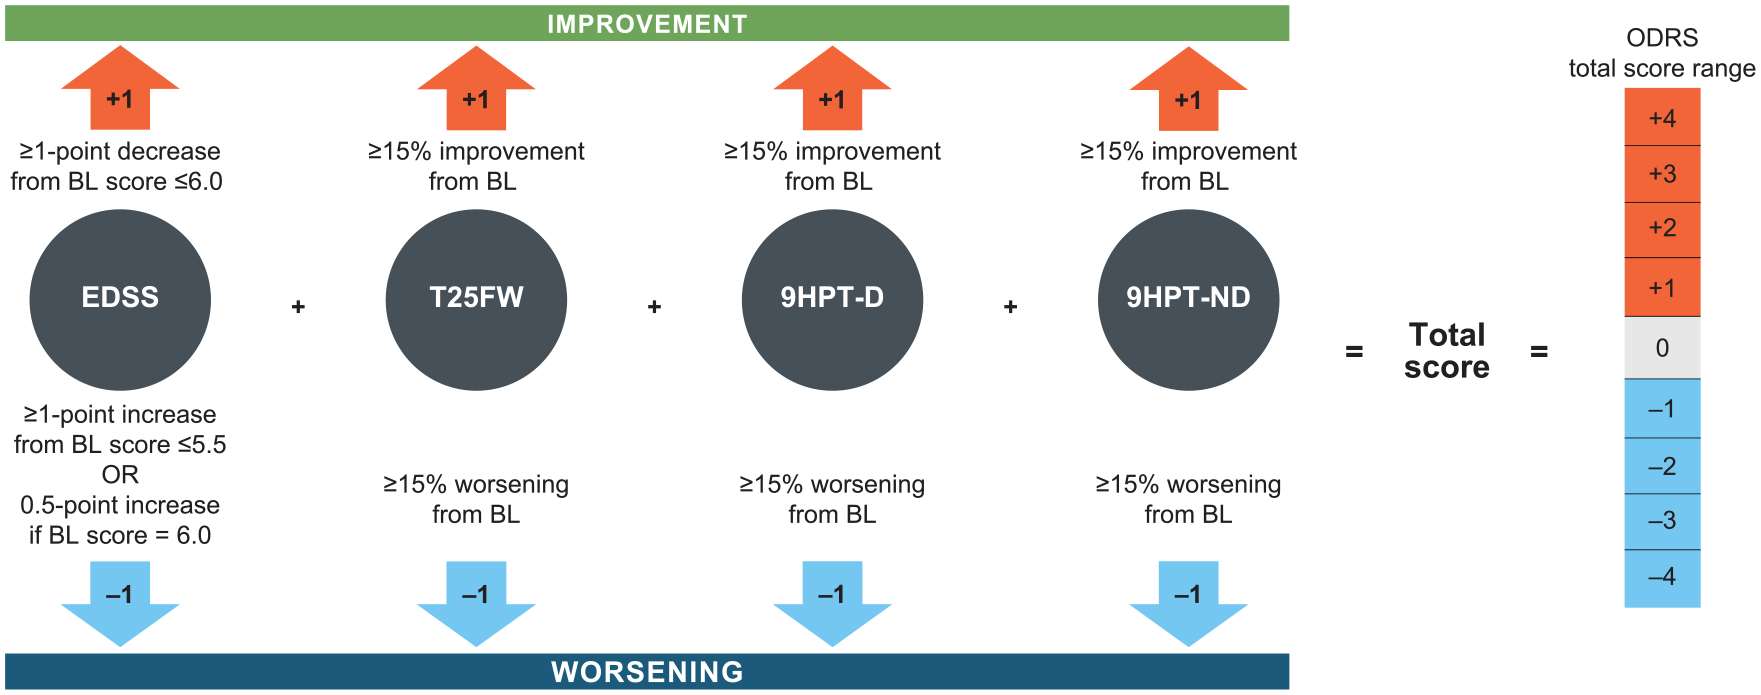
Calculation of the ODRS based on thresholds established for component measures.
The relationship between ODRS and the PRO measures, that is, 36-item Short Form Survey (SF-36) 29 and the 29-item Multiple Sclerosis Impact Scale (MSIS-29), 30 was determined at the end of the 2-year trials. The SF-36 physical component score (PCS) and mental component score (MCS) were administered in both AFFIRM and ASCEND, whereas the MSIS-29 was administered only in ASCEND.25,28 The SF-36 was conducted at Weeks 0, 24, 52, 104, and 120 in AFFIRM. Both SF-36 and MSIS-29 were conducted at Week 0 and then every 24 weeks through Week 96 in placebo-controlled ASCEND Study Part 1.
Statistical analysis
In both trials, the mean ODRS score over a 96-week period (similar to area under the curve), the ODRS score at Week 96, and the slope of change in ODRS per year were compared between treatment arms. The analyses of mean ODRS score over 96 weeks and the ODRS score at Week 96 were based on a linear mixed-effect model for repeated measures within participants, with treatment, visit, and treatment and visit interaction as fixed effects; and baseline EDSS, T25FW, and 9HPT (average of two hands) scores as covariates. The slope of change in ODRS per year analysis was based on a linear mixed-effect model, with treatment and time (numerical) interaction as fixed effect; individual intercept (at Week 12) as random effect; and baseline EDSS, T25FW, and 9HPT (average of two hands) as covariates. Sensitivity analyses were performed in the AFFIRM and ASCEND data sets to explore the impact of a different threshold of change (⩾20% change from baseline) for the T25FW, 9HPT-D, and 9HPT-ND, and of reduced weights (50%) for the 9HPT-D and 9HPT-ND.
The relationship between the ODRS at Week 96 and the change from baseline in the SF-36 PCS and MCS at Week 104 and Week 96 was assessed in the AFFIRM and ASCEND data sets, respectively. The SF-36 assessment at Week 104 was the closest to ODRS assessment at Week 96 in AFFIRM. Treatment arms were pooled in each study. Spearman correlation coefficients between PCS/MCS and the ODRS were calculated in AFFIRM and ASCEND. Linear regression models were used with PCS/MCS as the dependent variable and the ODRS as the explanatory variable. In addition, the association of change in PCS/MCS at 2 years with ODRS score at 2 years was estimated. ODRS was grouped into ⩽−3, −2, −1, 0, 1, 2, ⩾3 (due to very small numbers of ODRS as −4 or 4, they were combined with −3 or 3 in this analysis). Linear regression model was used with PCS/MCS as the dependent variable and the categorical ODRS as the explanatory variable, and the mean changes in PCS/MCS were obtained for every level of categorical ODRS. The relationship between the ODRS and the MSIS-29 physical (PHYS) and psychological (PSYCH) impact subscales 30 was similarly assessed in the ASCEND data set.
Results
The baseline disability characteristics of participants in AFFIRM and ASCEND were consistent with the expected phenotypes of participants with RRMS and SPMS, 31 respectively (Table 1).
Baseline scores on ODRS components (EDSS, T25FW, 9HPT-D, and 9HPT-ND).
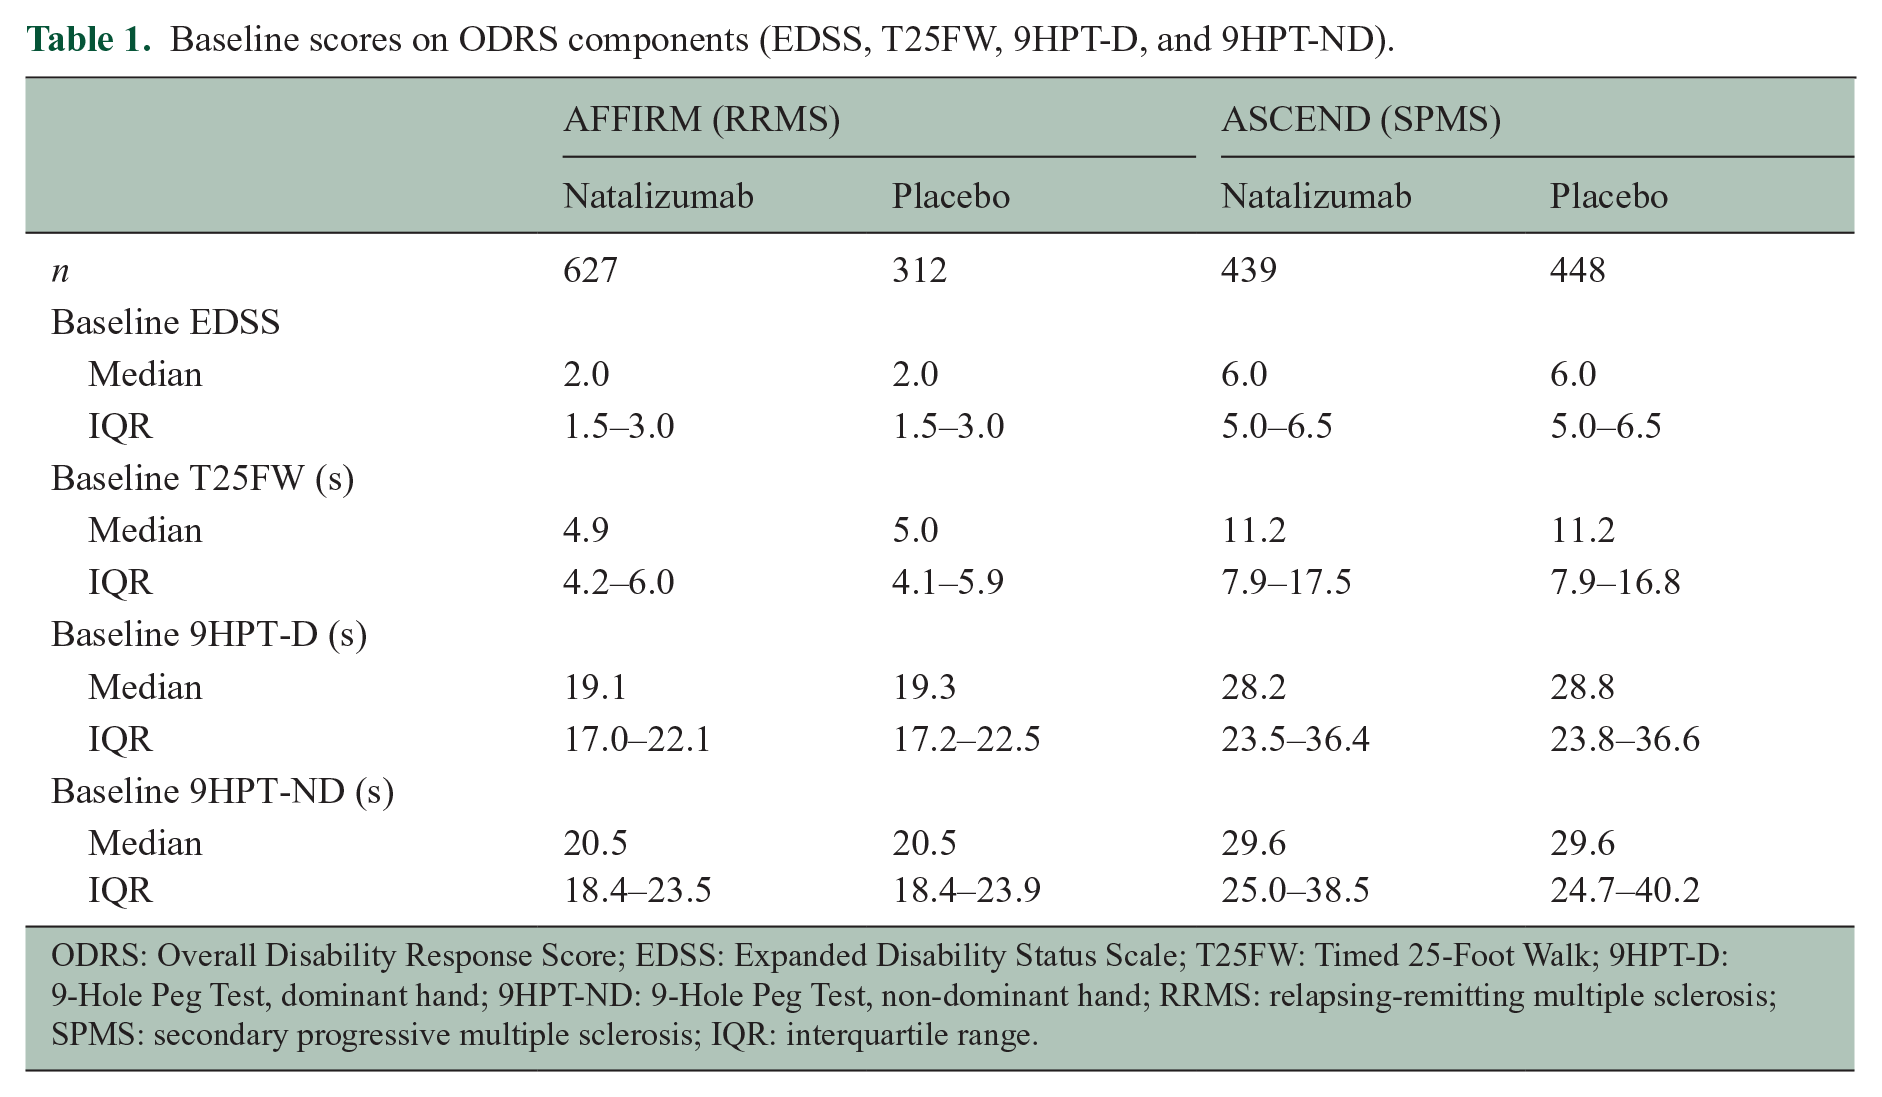
ODRS: Overall Disability Response Score; EDSS: Expanded Disability Status Scale; T25FW: Timed 25-Foot Walk; 9HPT-D: 9-Hole Peg Test, dominant hand; 9HPT-ND: 9-Hole Peg Test, non-dominant hand; RRMS: relapsing-remitting multiple sclerosis; SPMS: secondary progressive multiple sclerosis; IQR: interquartile range.
In AFFIRM, the mean ODRS curve over 2 years in participants who received placebo indicates a gradual worsening of disability; in contrast, participants treated with natalizumab showed a relatively stable disability status over time (Figure 2(a), Supplementary Table 1). The treatment difference between natalizumab and placebo groups, based on the mean ODRS over 2 years, was 0.34 (95% confidence interval (CI): 0.21–0.46; p < 0.001; Table 2). At 2 years, the treatment difference in the ODRS between natalizumab and placebo groups was 0.48 (95% CI: 0.30–0.67; p < 0.001). The slope of change per year was 0.04 in the natalizumab group versus −0.18 in the placebo group; the treatment difference was 0.21 (95% CI: 0.16–0.27; p < 0.001).
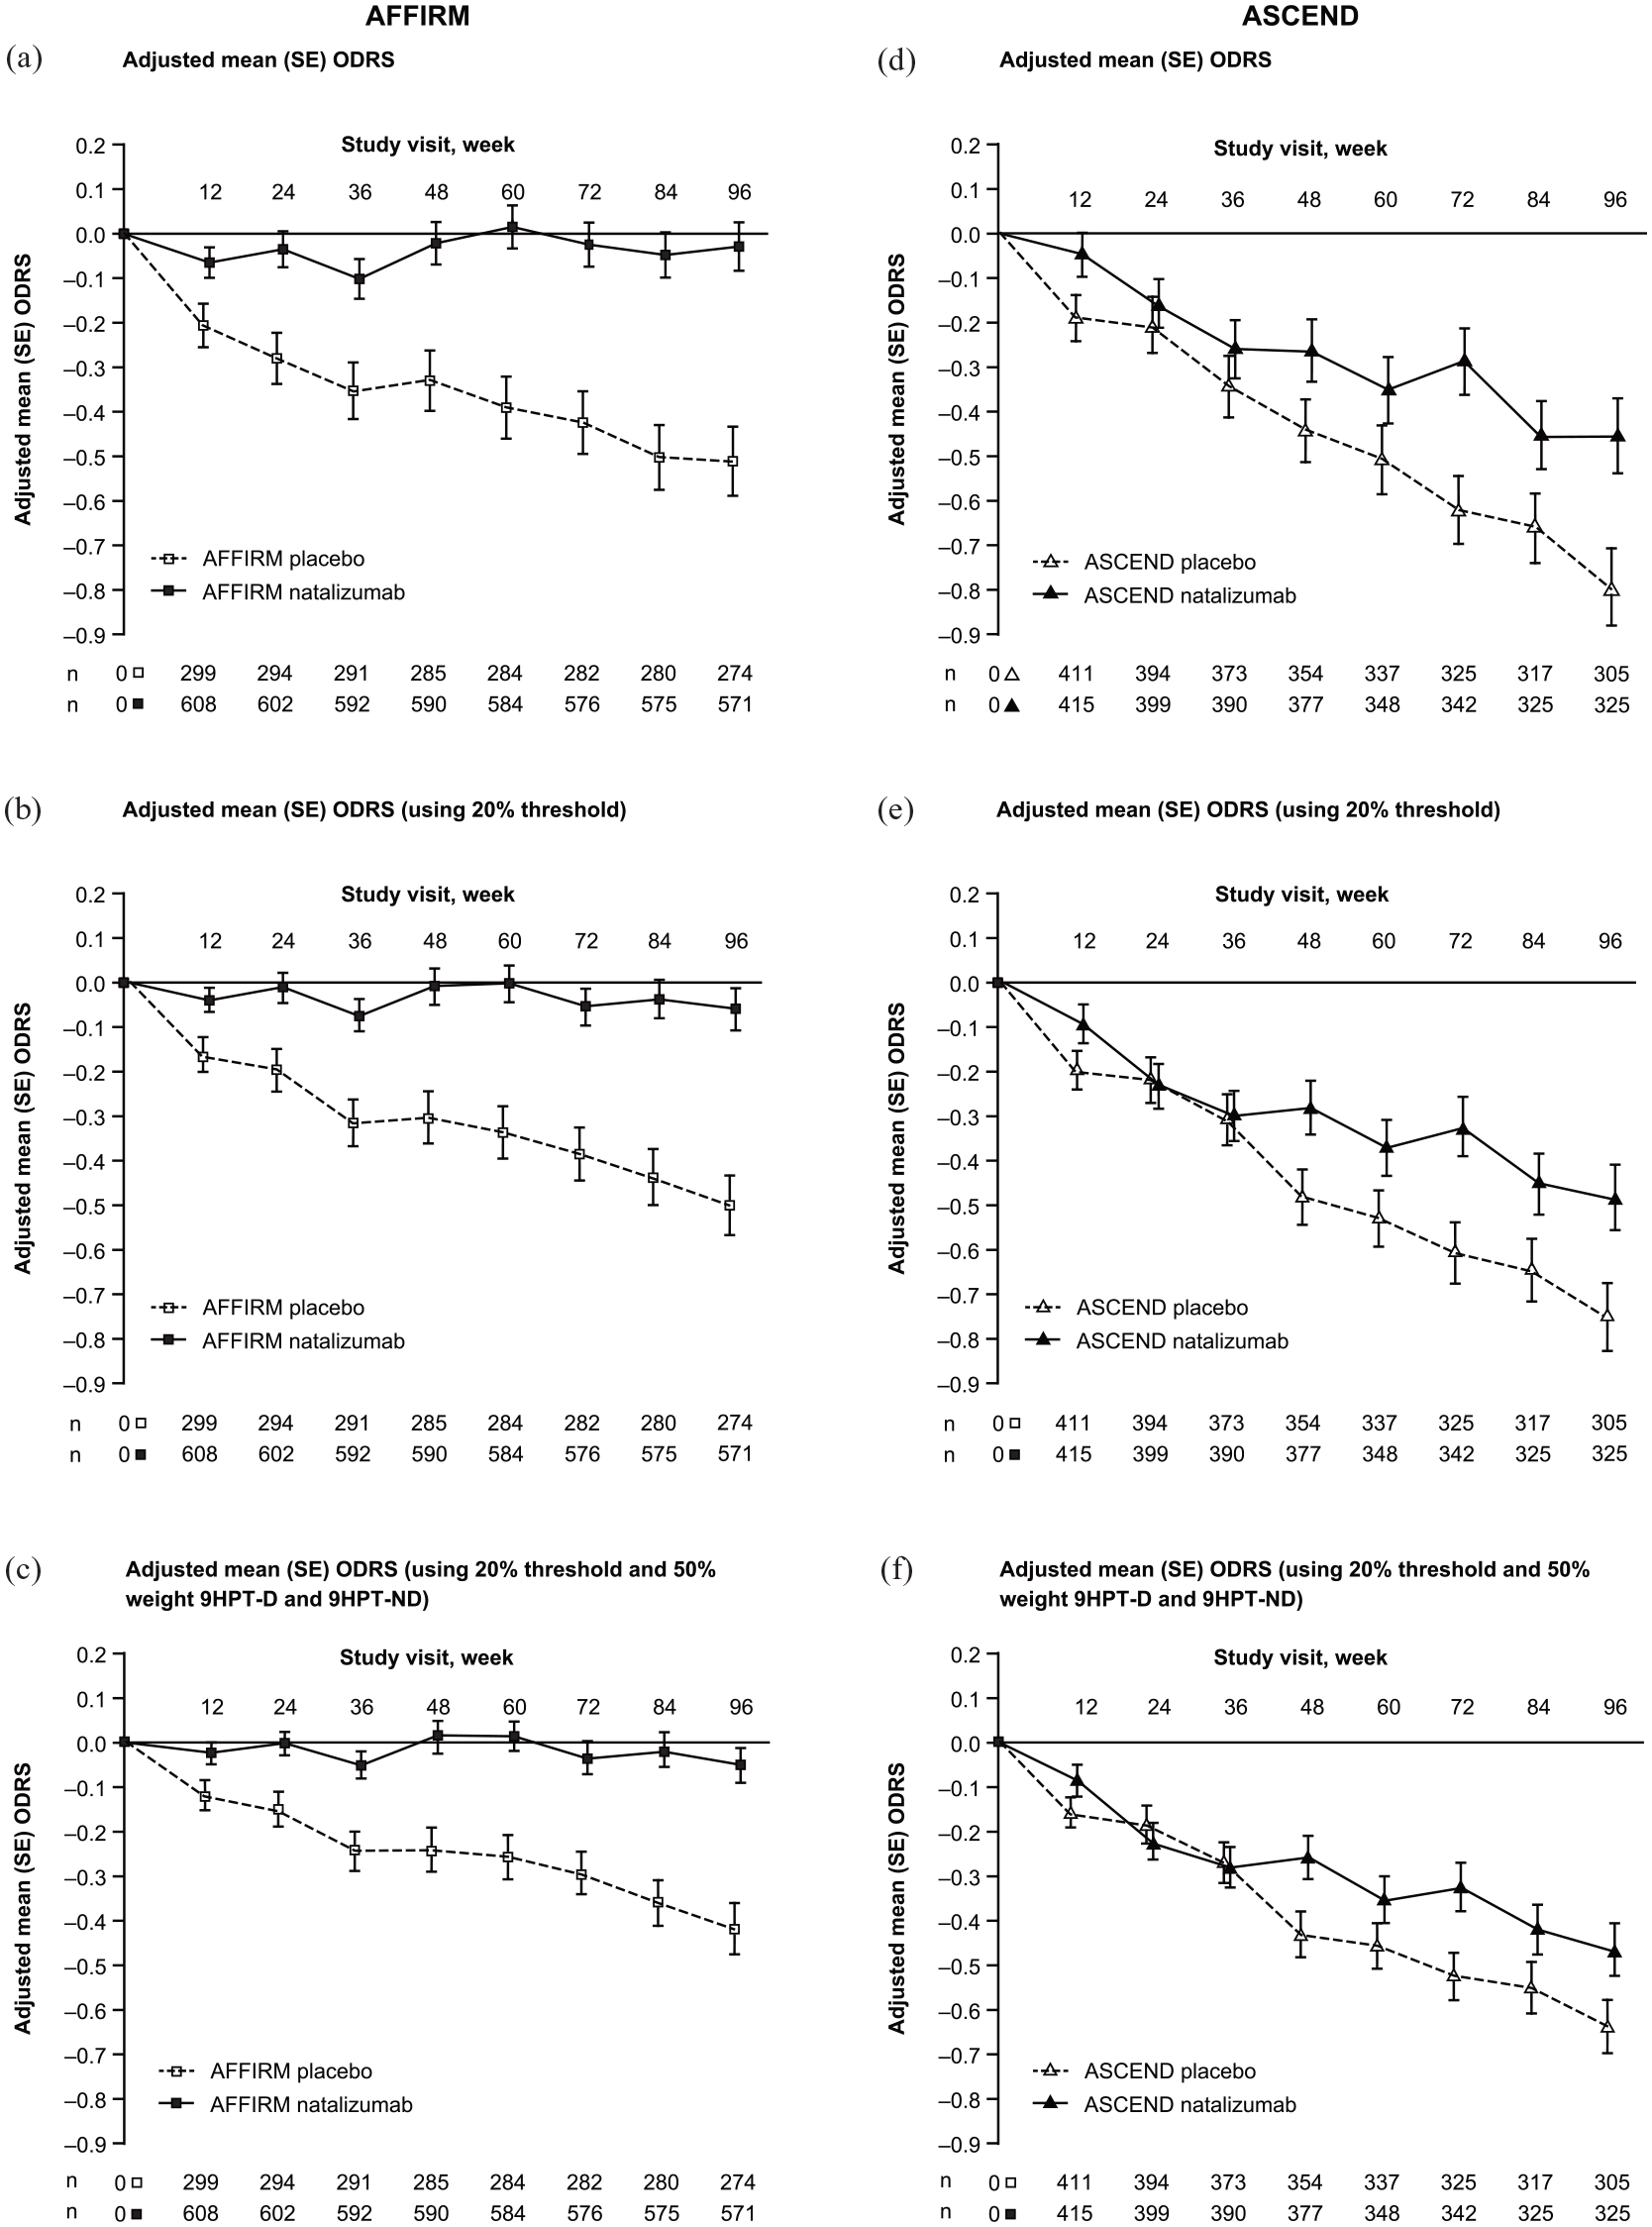
ODRS trajectories by treatment group in AFFIRM (RRMS, panels (a)–(c)) and ASCEND (SPMS, panels (d)–(f)) studies. Sensitivity analyses of ODRS were conducted based on 20% change threshold for T25FW and 9HPT (panels (b) and (e)) and based on 20% threshold for T25FW and 9HPT together with 50% weight of 9HPT-D and 9HPT-ND (panels (c) and (f)).
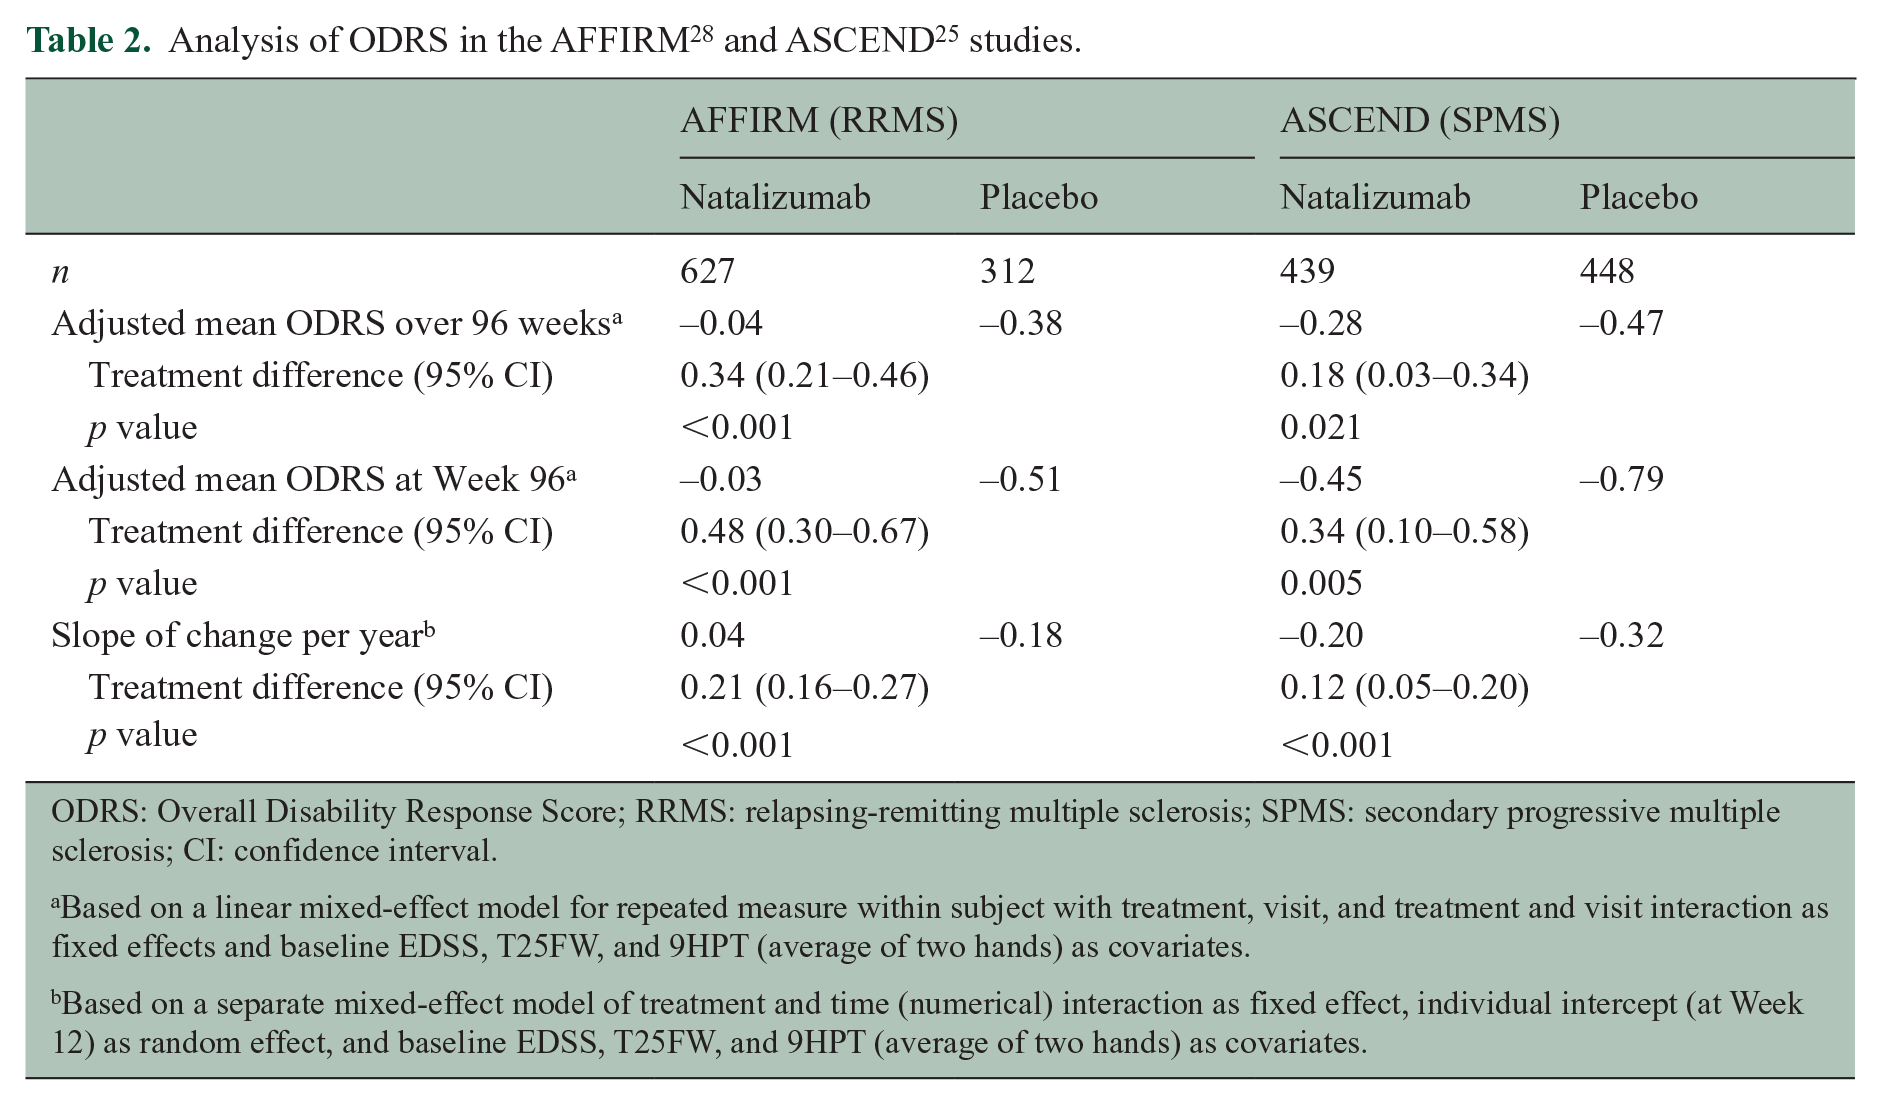
ODRS: Overall Disability Response Score; RRMS: relapsing-remitting multiple sclerosis; SPMS: secondary progressive multiple sclerosis; CI: confidence interval.
Based on a linear mixed-effect model for repeated measure within subject with treatment, visit, and treatment and visit interaction as fixed effects and baseline EDSS, T25FW, and 9HPT (average of two hands) as covariates.
Based on a separate mixed-effect model of treatment and time (numerical) interaction as fixed effect, individual intercept (at Week 12) as random effect, and baseline EDSS, T25FW, and 9HPT (average of two hands) as covariates.
In ASCEND, an overall worsening of the mean ODRS was found in both treatment groups, although this was less with natalizumab, especially during the second year (Figure 2(d), Supplementary Table 2). The treatment difference of natalizumab versus placebo in mean ODRS score over 2 years was 0.18 (95% CI: 0.03–0.34; p = 0.021; Table 2); at 2 years, the treatment difference in the ODRS was 0.34 (95% CI: 0.10–0.58; p = 0.005; Table 2). The ODRS slope was steeper in participants on placebo as compared to those on natalizumab (−0.32 and −0.20; p < 0.001).
A ⩾20% change threshold in T25FW and 9HPT may be clinically more meaningful compared with the ⩾15% change threshold. In addition, a question may be raised on whether 9HPT is overrepresented in the ODRS endpoint because 9HPT-D and 9HPT-ND are included as two independent components. Therefore, we performed sensitivity analyses in the AFFIRM and ASCEND data sets using a ⩾20% threshold for improvement or worsening in T25FW and 9HPT and including 9HPT-D and 9HPT-ND with half weight (50%) in the ODRS. Results of these sensitivity analyses were consistent with the primary analysis (Figure 2(b), (c), (e), and (f), Supplementary Table 3 and 4).
The results from ODRS were compared with those from EDSS and MSFC in these data sets (Supplementary Tables 5 and 6). In AFFIRM, the differences in mean EDSS over 96 weeks and at Week 96 were both nominally significant in favor of natalizumab treatment versus placebo. However, in ASCEND, neither the mean EDSS over 96 weeks nor the mean EDSS at Week 96 showed significant differences between the natalizumab and placebo groups (Supplementary Table 5). In AFFIRM, the difference in mean MSFC over 96 weeks was nominally significant in favor of the natalizumab group, but there was no significant difference between the two treatment groups at Week 96 (Supplementary Table 6). The MSFC was not analyzed in the ASCEND data set because PASAT-3 was not collected. Therefore, ODRS appears to be more sensitive in identifying potential treatment responses in these two data sets.
In both AFFIRM and ASCEND at 2 years, the ODRS showed statistically significant but relatively weak linear correlations with changes from baseline in the SF-36 PCS and MCS (p < 0.001; Figures 3(a) and (b), 4(a) and (b)). In addition, in both study data sets, positive ODRS at 2 years were associated with positive mean changes from baseline in SF-36 PCS and MCS, and vice versa (Figures 3(c) and 4(c), Supplementary Table 7). In ASCEND, the association between ODRS and MSIS-29 PHYS and PSYCH impact subscale scores at 2 years was stronger than with SF-36 PCS and MCS scores (Figures 4 and 5; Supplementary Table 7). Positive ODRS at 2 years was also associated with negative mean changes from baseline in MSIS-29 PHYS and PSYCH subscales, and vice versa (Figure 5(c), Supplementary Table 7). Therefore, improvement and worsening in ODRS were directionally correlated with improvement and worsening in SF-36 and MSIS-29, respectively.
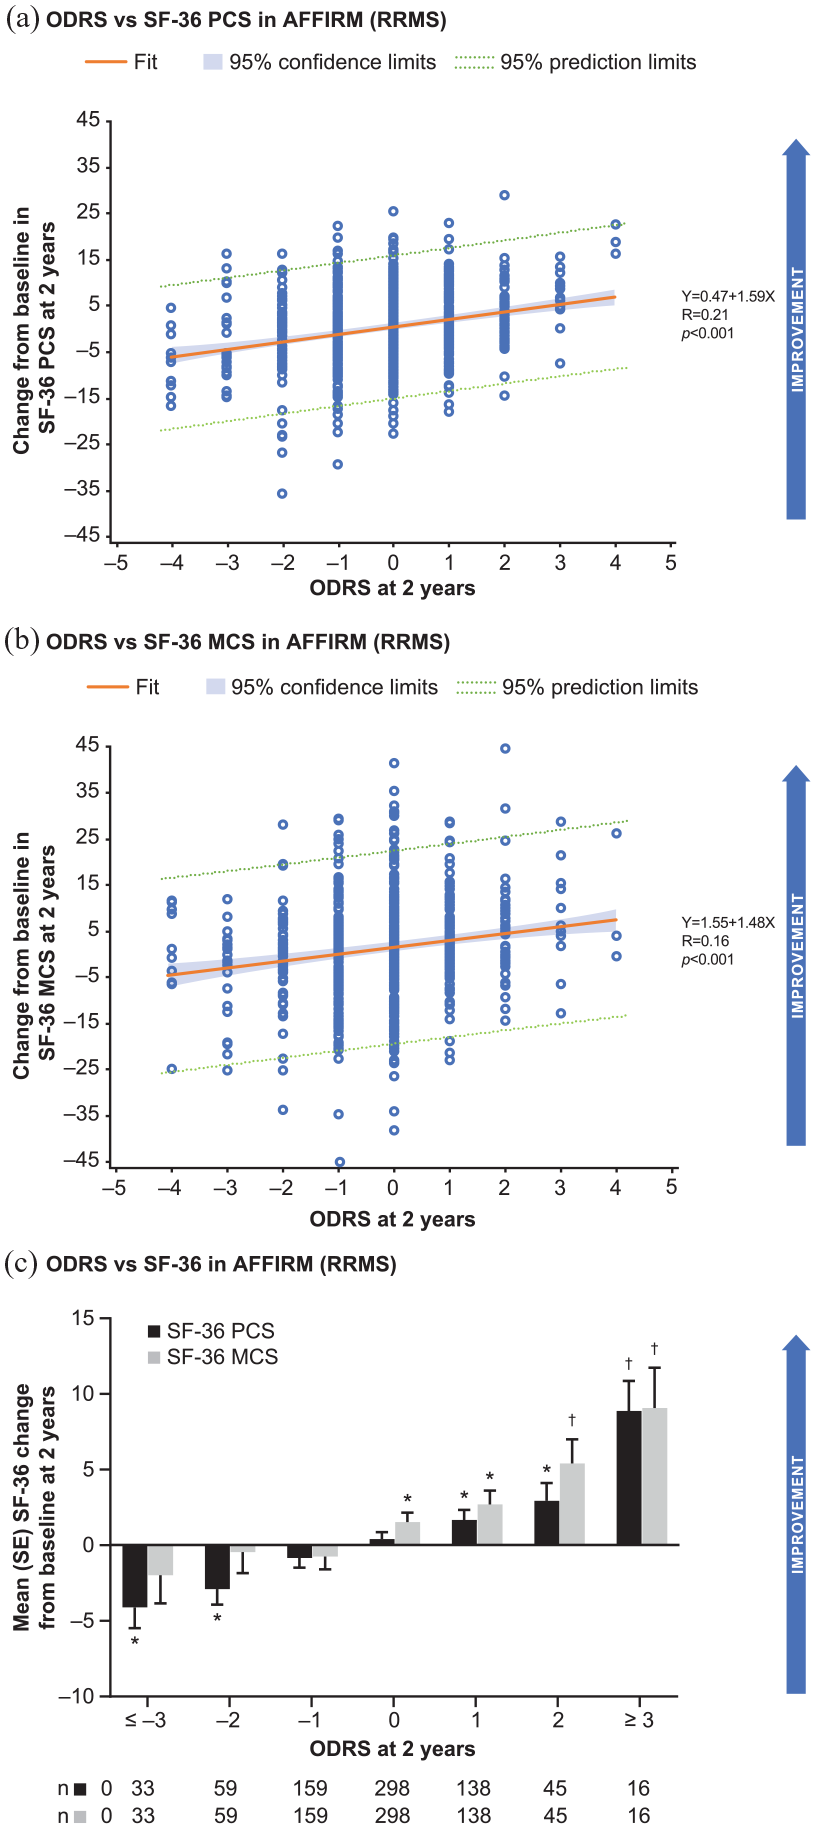
Relationship between ODRS and change from baseline in SF-36 scores at 2 years in AFFIRM (RRMS) study. Correlations of ODRS with changes from baseline in the SF-36 PCS (a) and MCS (b), respectively. Mean changes in SF-36 PCS and MCS at 2 years were estimated for different ODRS outcomes at 2 years. (c) Treatment arms were pooled in this analysis.
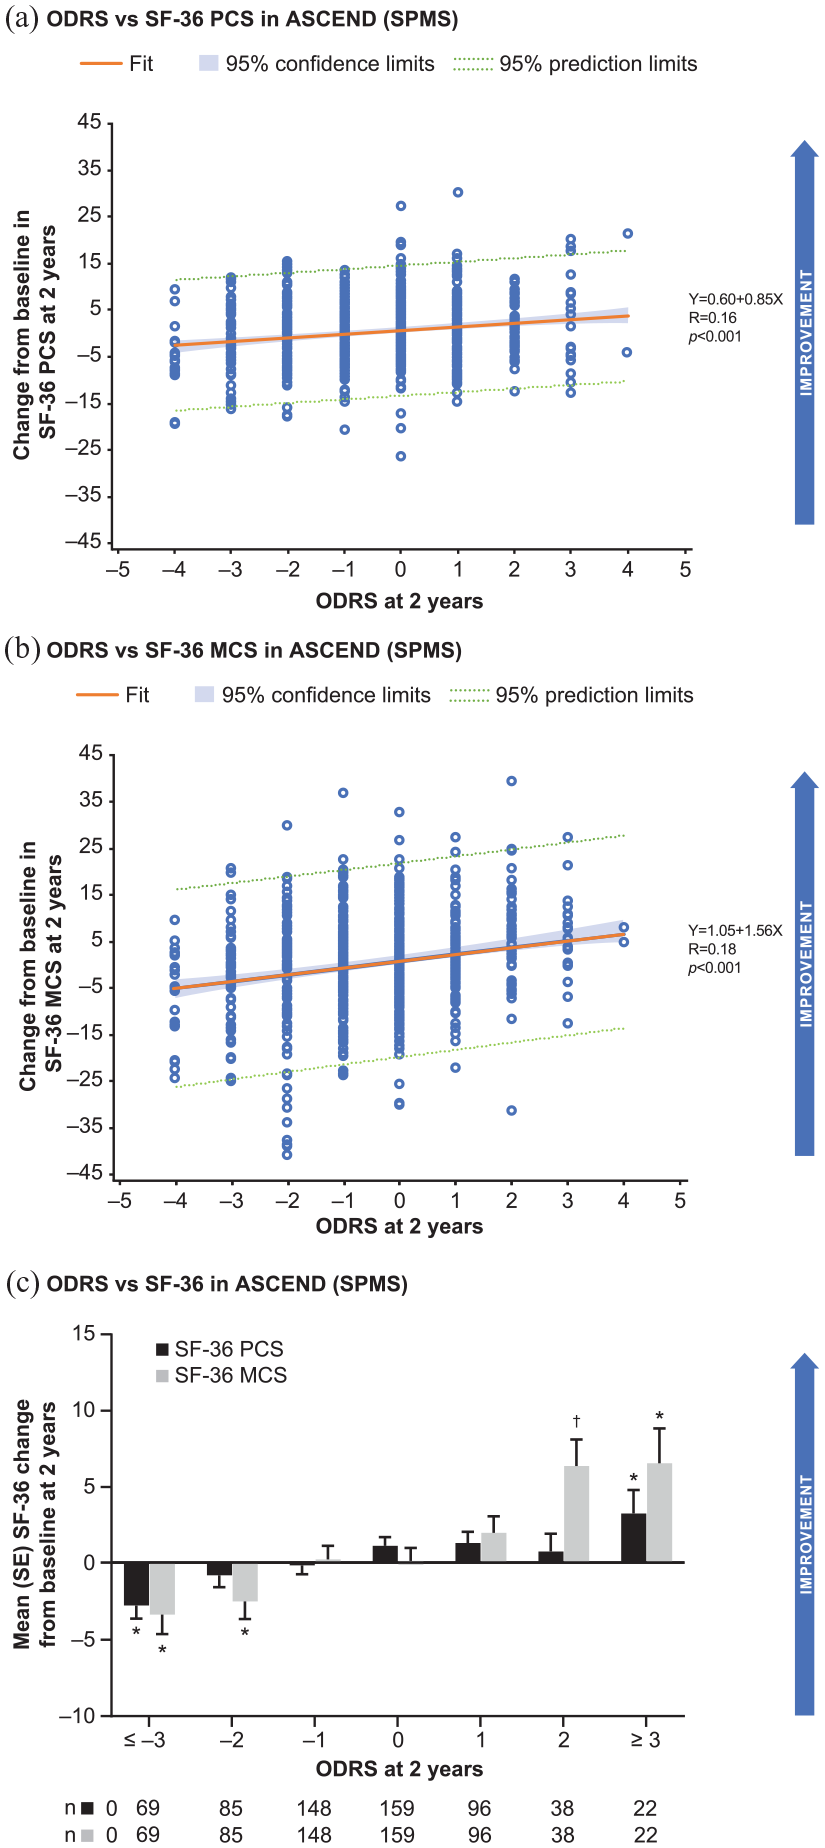
Relationship between ODRS and change from baseline in SF-36 scores at 2 years in ASCEND (SPMS) study.Correlations of ODRS with changes from baseline in the SF-36 PCS (a) and MCS (b), respectively. Mean changes in SF-36 PCS and MCS at 2 years were estimated for different ODRS outcomes at 2 years. (c) Treatment arms were pooled in this analysis.
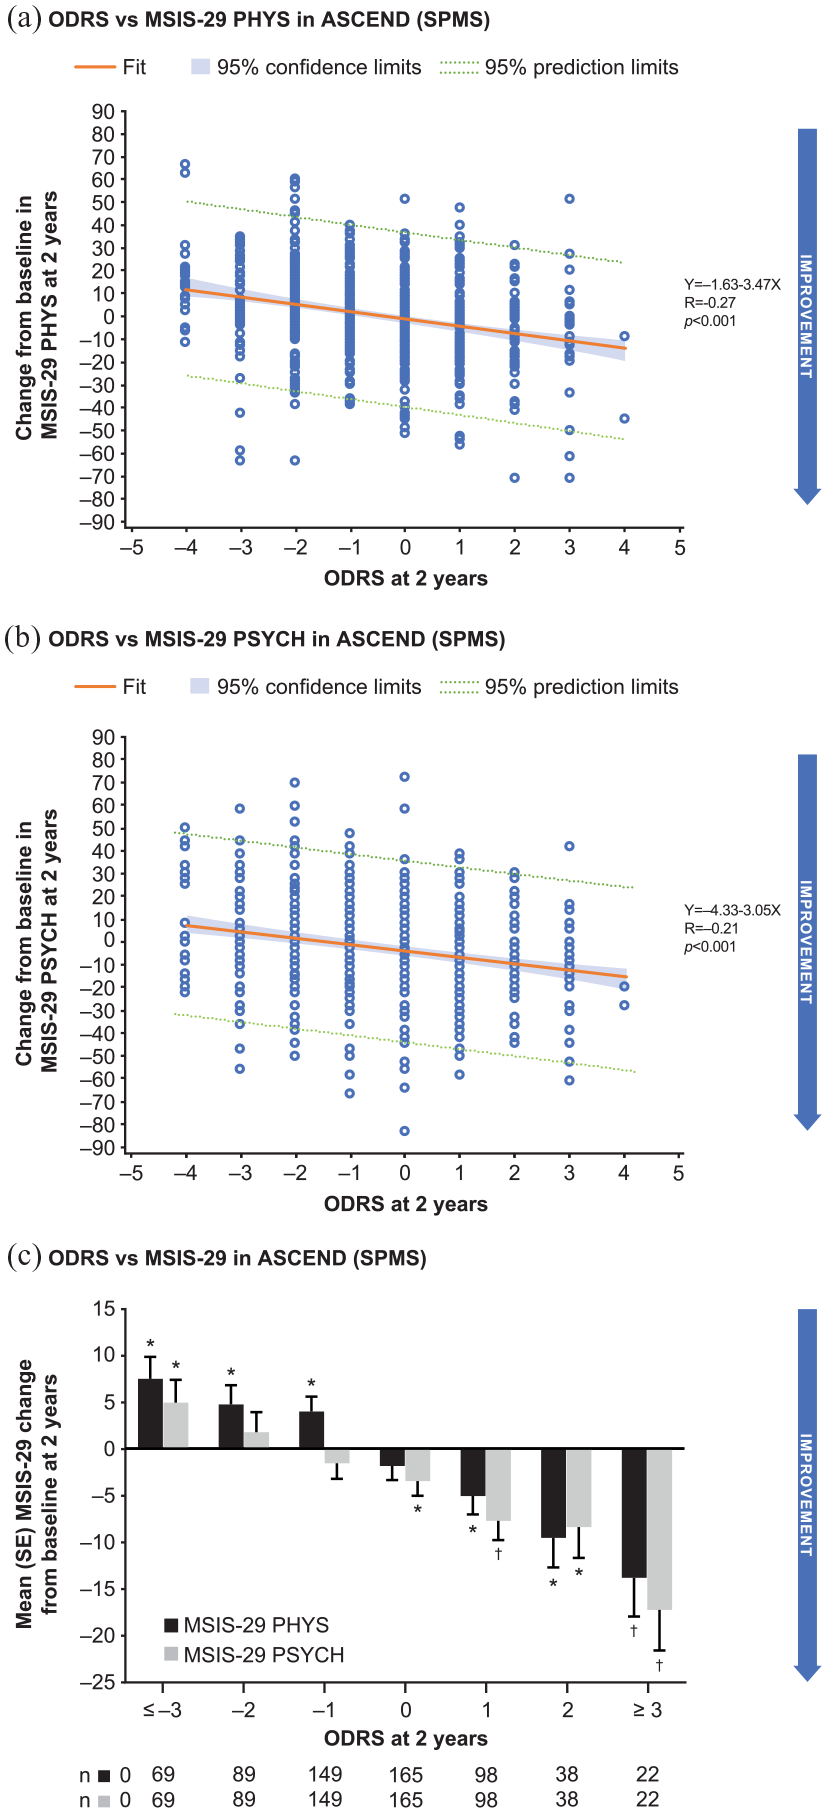
Relationship between ODRS and change from baseline in MSIS-29 scores at 2 years in ASCEND (SPMS) study. Correlations of ODRS with changes from baseline in the MSIS-29 PHYS (a) and PSYCH (b) scores, respectively. Mean changes in MSIS-29 PHYS and PSYCH scores at 2 years were estimated for different ODRS outcomes at 2 years. (c) Treatment arms were pooled in this analysis.
Discussion
The ODRS includes well-established components with previously defined thresholds to measure clinically relevant changes in disability in MS.8,24,27 This retrospective analysis of two natalizumab Phase 3 trial data sets25,28 provides evidence that the ODRS captures disability worsening and improvement over time that is consistent with self-reported quality of life and perceived MS-related impairment in individuals with RRMS or SPMS.8,24,27
The results obtained in the AFFIRM data set 28 with mean ODRS over 2 years of −0.04 in the natalizumab group and −0.38 in the placebo group (p < 0.001) are consistent with the primary AFFIRM outcome showing the reduction in the cumulative probability of 12-week confirmed worsening on EDSS in natalizumab group versus placebo (17% and 29%, respectively; hazard ratio (HR) = 0.58; p < 0.001). 28 Previous post hoc analysis in AFFIRM had also shown that natalizumab treatment increased the cumulative probability of 12-week confirmed improvement on EDSS versus placebo over 2 years (HR = 1.69; p = 0.006). 32 Additional analyses in the AFFIRM data set using MSFC progression 10 and EDSS-Plus 33 endpoints suggested that T25FW and 9HPT may be useful to detect additional efficacy signals of natalizumab treatment in RRMS patients. As compared to the previous analyses, ODRS has the advantage of including in one measure the overall disability changes over 2 years.10,33
In ASCEND, the primary endpoint was the proportion of participants with confirmed disability progression over 2 years using a multicomponent measure comprising EDSS, T25FW, and 9HPT. The primary endpoint was not met in ASCEND (44% in natalizumab group vs 48% in placebo group; p = 0.287). Although there was no apparent treatment effect on disability status as measured by the EDSS or T25FW, the 9HPT showed a reduction in confirmed worsening (15% vs 23%; p = 0.001). 25 In addition, a post hoc analysis of the ASCEND data set showed a potential benefit of natalizumab versus placebo on time-to-first confirmed disability improvement. 34 Interestingly, the ODRS, which encompasses changes of disability scales from baseline in both directions, was able to detect an overall significantly reduced disability worsening in the natalizumab group versus placebo over 2 years (–0.28 in natalizumab group vs −0.47 in placebo group; p = 0.021). Analyses of mean ODRS at 2 years, and slope of change per year supported these potential benefits of natalizumab treatment in SPMS patients. Of note, this analysis was post hoc in nature and would not change the conclusion that ASCEND trial was negative; there is no conclusive evidence to demonstrate the benefit of natalizumab treatment in SPMS patients.
Our analysis suggests that the slope of disability change per year is a sensitive parameter with better face validity as compared with the mean changes in ODRS. In addition, our findings suggest that determining the mean ODRS at 2 years may be more sensitive in measuring overall changes in disability status compared to the mean ODRS over 2 years, particularly when the estimated treatment effect increases with longer duration of treatment. By capturing both improvement of existing disability and reduction in further disability worsening, the ODRS may be especially advantageous as an outcome measure in clinical trials of drugs that facilitate remyelination and neurological repair.
A number of factors may explain the relatively high sensitivity of the ODRS in detecting changes in disability status from baseline. (1) The integration of T25FW and 9HPT measures, which are responsive to changes in ambulatory and upper-extremity function, adds to the sensitivity of EDSS in detecting key motor functional changes in MS. Recent qualification work from the Multiple Sclerosis Outcome Assessments Consortium supported the validity of T25FW and 9HPT as performance tests for MS, 35 and provided evidence of their clinical meaningfulness using patient surveys and pooled analyses of large trial data sets.23,35 (2) The ODRS allows the determination of an integrated score at each time point during the study, without censoring assessments obtained after confirmed disability progression or improvement. As a result, the ODRS may more comprehensively reflect the overall trajectory of disability changes. (3) The ODRS requires a 15% minimum change threshold for the T25FW and 9HPT components. As ODRS has been developed mainly as a proof-of-concept measurement tool with high sensitivity, the change threshold was set above the variability level. It was reported that T25FW and 9HPT scores varied by <20% from individual mean scores on repeated testing on five consecutive days in clinically stable patients with MS. 36 Using pooled data from two randomized double-blind Phase 3 trials of fampridine versus placebo in MS (MS-F203 and MS-F-204), the average within-visit variability of T25FW (speed) was reported to be 7.2%–8.7% and between-visit variability to be 14.4%–16.3%. 37 In the opicinumab Phase 2 SYNERGY trial data set, the mean and median variability in different treatment arms and at different visits were consistently below 10% (Biogen data on file). A ⩾15% threshold has been shown to confer greater sensitivity compared with a ⩾20% minimum threshold change in T25FW and 9HPT yet maintain the clinical relevance of identified changes. 10 (4) The sensitivity analysis in AFFIRM and ASCEND data sets showed potentially improved sensitivity by separating 9HPT-D and 9HPT-ND into two components. The intent in separating these two measurements was to balance with the weight of walking function being assessed in both EDSS and T25FW in ODRS. In people with MS (PwMS) whose walking ability is severely impacted, the hand function is particularly important. In addition, it is recommended that the average time to complete the task be reported for both the dominant and non-dominant hands separately due to the significantly different performance scores. 18 (5) Because assessment is repeated at multiple consecutive time points, confirmation of disability changes at a later time point is no longer needed. For example, a score returning to 0 after a score of −1 in the EDSS reflects the transient nature of a non-sustained disability worsening event which has limited impact on overall outcomes.36,37
In the ODRS endpoint, there was an asymmetry in the change in EDSS in participants with EDSS 6.0 at baseline. The worsening threshold from baseline EDSS 6.0 only needs 0.5 points, considering the relatively poor sensitivity to disease progression at higher EDSS. 8 This threshold has been utilized in most MS trials. On the other hand, the improvement threshold from baseline EDSS 6.0 is less defined in the literature. We chose a 1.0-point reduction as the threshold based on two considerations: (1) the 1.0-point reduction from EDSS 6.0 to 5.0 is consistent with the 1.0-point worsening threshold from EDSS 5.0 to 6.0, which is commonly used, and (2) 1.0-point reduction threshold would be more conservative and may reduce the noise.
Our data showed that ODRS mildly, but significantly, correlated with established measures of the physical and mental/psychological components of quality of life (SF-36) and of self-perception of MS-related disability impact (MSIS-29) at 2 years. It suggests that improvement and worsening on ODRS are directionally related with changes in quality of life in PwMS. Interestingly, in our analysis, changes in ODRS, which mainly measures physical disability, were also correlated with changes in the SF-36 MCS and the MSIS-29 PSYCH subscale. It was reported that PwMS had lower mean scores for all eight SF-36 health dimensions compared with age- and sex-adjusted scores in the general population. 38 Our data suggest that common pathogenic mechanisms in MS may impact both physical and mental functions, and physical disability measurements may be correlated to some degree with both physical and mental scores in PROs.
The development of ODRS has limitations, partly due to data availability. First, ODRS focuses on physical measures of disability. Ideally, cognitive and visual functional domains would be included in a disability outcome measure for MS. The AFFIRM and ASCEND studies did not collect SDMT and LCLA, respectively. Future studies may evaluate if including the SDMT 21 and LCLA 22 adds to the sensitivity and clinical meaningfulness of a multicomponent disability outcome measure for MS. Similarly, the correlation of the ODRS with MSIS-29 was only described for ASCEND because this outcome measure was not used in AFFIRM. Second, although a correlation between ODRS and changes in SF-36 and MSIS-29 was observed, additional work will be needed to establish a clinically meaningful change threshold of ODRS. Third, the ODRS is more suitable for proof-of-concept Phase 2 studies at this stage due to the lack of formal validation through psychometric analysis. In particular, there is a lack of understanding of the consistency and potential overlapping in the contributions from each component. However, the ODRS in this post hoc analysis of two large Phase 3 data sets sensitively captured the trajectory of disability changes in typical RRMS and SPMS patient populations. These findings support its further development as an endpoint in prospective clinical trials.
Supplemental Material
sj-pdf-1-msj-10.1177_13524585221114997 – Supplemental material for Overall Disability Response Score: An integrated endpoint to assess disability improvement and worsening over time in patients with multiple sclerosis
Supplemental material, sj-pdf-1-msj-10.1177_13524585221114997 for Overall Disability Response Score: An integrated endpoint to assess disability improvement and worsening over time in patients with multiple sclerosis by Ih Chang, Ludwig Kappos, Gavin Giovannoni, Peter A Calabresi, Alfred Sandrock, Wenting Cheng, Shan Xiao, Katherine Riester, Shibeshih Belachew, Aaron Deykin and Bing Zhu in Multiple Sclerosis Journal
Footnotes
Acknowledgements
The authors thank Robert Hyde, Sarah Sheikh, Carmen Castrillo-Viguera, and Yi Chai for their participation in the development of the ODRS concept. Bess Reinoso, PhD, from Excel Scientific Solutions wrote the first draft of the manuscript based on input from authors, and Cara Dickinson from Excel Scientific Solutions copyedited and styled the manuscript per journal requirements.
Declaration of Conflicting Interests
The author(s) declared the following potential conflicts of interest with respect to the research, authorship, and/or publication of this article: L.K. institution (University Hospital Basel) received in the last 3 years and used exclusively for research support at the Department: steering committee, advisory board, consultancy fees, and support of educational activities from: Actelion, Bayer, Biogen, Celgene/BMS, CSL-Behring, Desitin, Excemed, Eisai, F. Hoffmann-La Roche Ltd, Genzyme, Janssen, Japan Tobacco, Merck, Minoryx, Novartis, Sanofi Aventis, Santhera, and license fees for Neurostatus-UHB products; the research of the MS Center in Basel has been supported by grants from Bayer, Biogen, the European Union, Innosuisse, Novartis, Roche Research Foundations, the Swiss MS Society, and the Swiss National Research Foundation. G.G. advisory boards for AbbVie Biotherapeutics Inc., Almirall, Atara, Biogen, Merck, Merck Serono, Novartis, Roche, Sanofi-Genzyme, and Teva; speaker fees from AbbVie Biotherapeutics Inc., Biogen, Genzyme, Merck, Merck Serono, Sanofi-Genzyme, and Teva; co-editor in chief of Multiple Sclerosis and Related Disorders; research support unrelated to study from Biogen, Genzyme, and Novartis. P.A.C. received consulting fees from Avidea, Biogen, and Disarm Therapeutics; research support/grants to his institution from Annexon, Biogen, Principia, and Genentech; and associate editor of The Journal of Clinical Investigation. I.C., A.S., S.X., and A.D. are former employees and shareholders of Biogen. W.C., K.R., S.B., and B.Z. are current employees of and shareholders in Biogen.
Funding
This study was funded by Biogen (Cambridge, MA, USA). Biogen provided funding for medical writing support in the development of this manuscript. The authors had full editorial control of the manuscript and provided their final approval of all content.
Supplemental material
Supplemental material for this article is available online.
References
Supplementary Material
Please find the following supplemental material available below.
For Open Access articles published under a Creative Commons License, all supplemental material carries the same license as the article it is associated with.
For non-Open Access articles published, all supplemental material carries a non-exclusive license, and permission requests for re-use of supplemental material or any part of supplemental material shall be sent directly to the copyright owner as specified in the copyright notice associated with the article.