
Abstract
Background:
Cognitive impairment affects 50%–75% of people with secondary progressive multiple sclerosis (PwSPMS). Improving our ability to predict cognitive decline may facilitate earlier intervention.
Objective:
The main aim of this study was to assess the relationship between longitudinal changes in cognition and baseline serum neurofilament light chain (sNfL) in PwSPMS. In a multi-modal analysis, MRI variables were additionally included to determine if sNfL has predictive utility beyond that already established through MRI.
Methods:
Participants from the MS-STAT trial underwent a detailed neuropsychological test battery at baseline, 12 and 24 months. Linear mixed models were used to assess the relationships between cognition, sNfL, T2 lesion volume (T2LV) and normalised regional brain volumes.
Results:
Median age and Expanded Disability Status Score (EDSS) were 51 and 6.0. Each doubling of baseline sNfL was associated with a 0.010 [0.003–0.017] point per month faster decline in WASI Full Scale IQ Z-score (p = 0.008), independent of T2LV and normalised regional volumes. In contrast, lower baseline volume of the transverse temporal gyrus was associated with poorer current cognitive performance (0.362 [0.026–0.698] point reduction per mL, p = 0.035), but not change in cognition. The results were supported by secondary analyses on individual cognitive components.
Conclusion:
Elevated sNfL is associated with faster cognitive decline, independent of T2LV and regional normalised volumes.
Keywords
Introduction
Cognitive dysfunction is common in multiple sclerosis (MS), with the prevalence of impairment ranging from 34% to 65%. 1 It exerts a disproportionate impact on function and employment and is present from the earliest stages of the disease, or even pre-morbidly. 1 Cognitive dysfunction is particularly prevalent in patients with secondary progressive MS (PwSPMS), where 50%–75% are impaired. 1 Deficits are often multifaceted, most commonly involving processing speed and episodic memory, in addition to executive, verbal and visuospatial abilities.1,2 Treatments for cognitive dysfunction are limited, although there is evidence to support the efficacy of cognitive rehabilitation, and licensed disease-modifying therapies (DMTs) for PwSPMS (siponimod) may delay the rate of decline on cognitive outcomes.3,4
Multiple MRI metrics have been identified as risk factors for future cognitive decline. 1 In addition to higher T2 lesion volume (T2LV), more severe atrophy of both cortical and deep grey matter structures has consistently been associated with poorer cognitive performance.5,6 Two studies have reported that in patients with progressive MS, greater cortical atrophy in particular is associated with faster cognitive decline.7,8
There is also increasing evidence to support the use of neurofilament light (NfL) levels as a biomarker of cognitive dysfunction. Cross-sectionally, higher serum or plasma NfL has been associated with poorer cognition across multiple domains.9 –11 Higher baseline serum or plasma NfL has also been associated with poorer future cognition, or greater risk of cognitive decline.9,11,12 Existing studies, however, rarely focus on PwSPMS and have not included MRI variables in their analyses. The extent to which sNfL adds independent prognostic information on cognition, beyond that which can be established through MRI, therefore remains uncertain.
We have previously reported that in the MS-STAT randomised controlled trial (NCT00647348), higher sNfL was associated with more severe disability, higher T2LVs and a greater subsequent whole brain atrophy rate. 13 In this study, we now combined the same sNfL and imaging dataset together with the detailed neuropsychometric assessments obtained as part of the MS-STAT trial. Our aim was to perform a multi-modal analysis including both sNfL and MRI predictors of current and future cognitive performance in PwSPMS. The key objective was to assess to what extent sNfL is predictive of future cognitive decline in PwSPMS beyond the variability already accounted for by T2LV and normalised brain regional volume variables.
Materials and methods
MS-STAT trial
The MS-STAT study protocol and the neuropsychological test battery have been outlined previously.14,15 Briefly, PwSPMS, aged 18–65 years with Expanded Disability Status Score (EDSS) 4.0–6.5 were eligible. Key exclusion criteria included primary progressive MS, relapse within 3 months and DMT use within 6 months. In total, 140 patients were randomised, 1:1, to simvastatin 80 mg or placebo.
Neurofilament analysis
Serum was acquired at baseline, Month 6, 12 and 24. sNfL was quantified on the Simoa HD-1 platform using a commercially available assay (NF-Light Advantage, Quanterix, Billerica, MA), as described previously. 13 The sNfL distribution was skewed, and hence, for all analyses, sNfL data were log2-transformed. Recent reports have highlighted the benefits of analysing sNfL as age- and BMI-adjusted Z-scores. 16 Since access to the required control and BMI data were not available for this historical cohort, we analysed sNfL without adjustment, but included age as a covariate in all multivariable analyses.
Cognitive assessments
As previously described, a detailed neuropsychological test battery was developed to cover a broad range of cognitive domains (see Table 1 and discussion). 15 Assessments were completed at baseline, Month 12 and 24. For Wechsler Abbreviated Scale of Intelligence (WASI), Brain Injury and Rehabilitation Trust (BIRT), Graded Naming Test and Paced Auditory Serial Addition Test (PASAT), Z-scores were generated with reference to healthy control data from assessment manuals or the published literature, as previously described. 15 On each cognitive variable, impairment was defined as a Z-score < −1.5. The Frontal Assessment Battery (FAB) and Visual Object and Space Perception (VOSP) cube analysis are presented as raw scores. The FAB is scored out of 18 and the VOSP out of 10.
Cognitive assessments included in the MS-STAT neuropsychometric test battery.
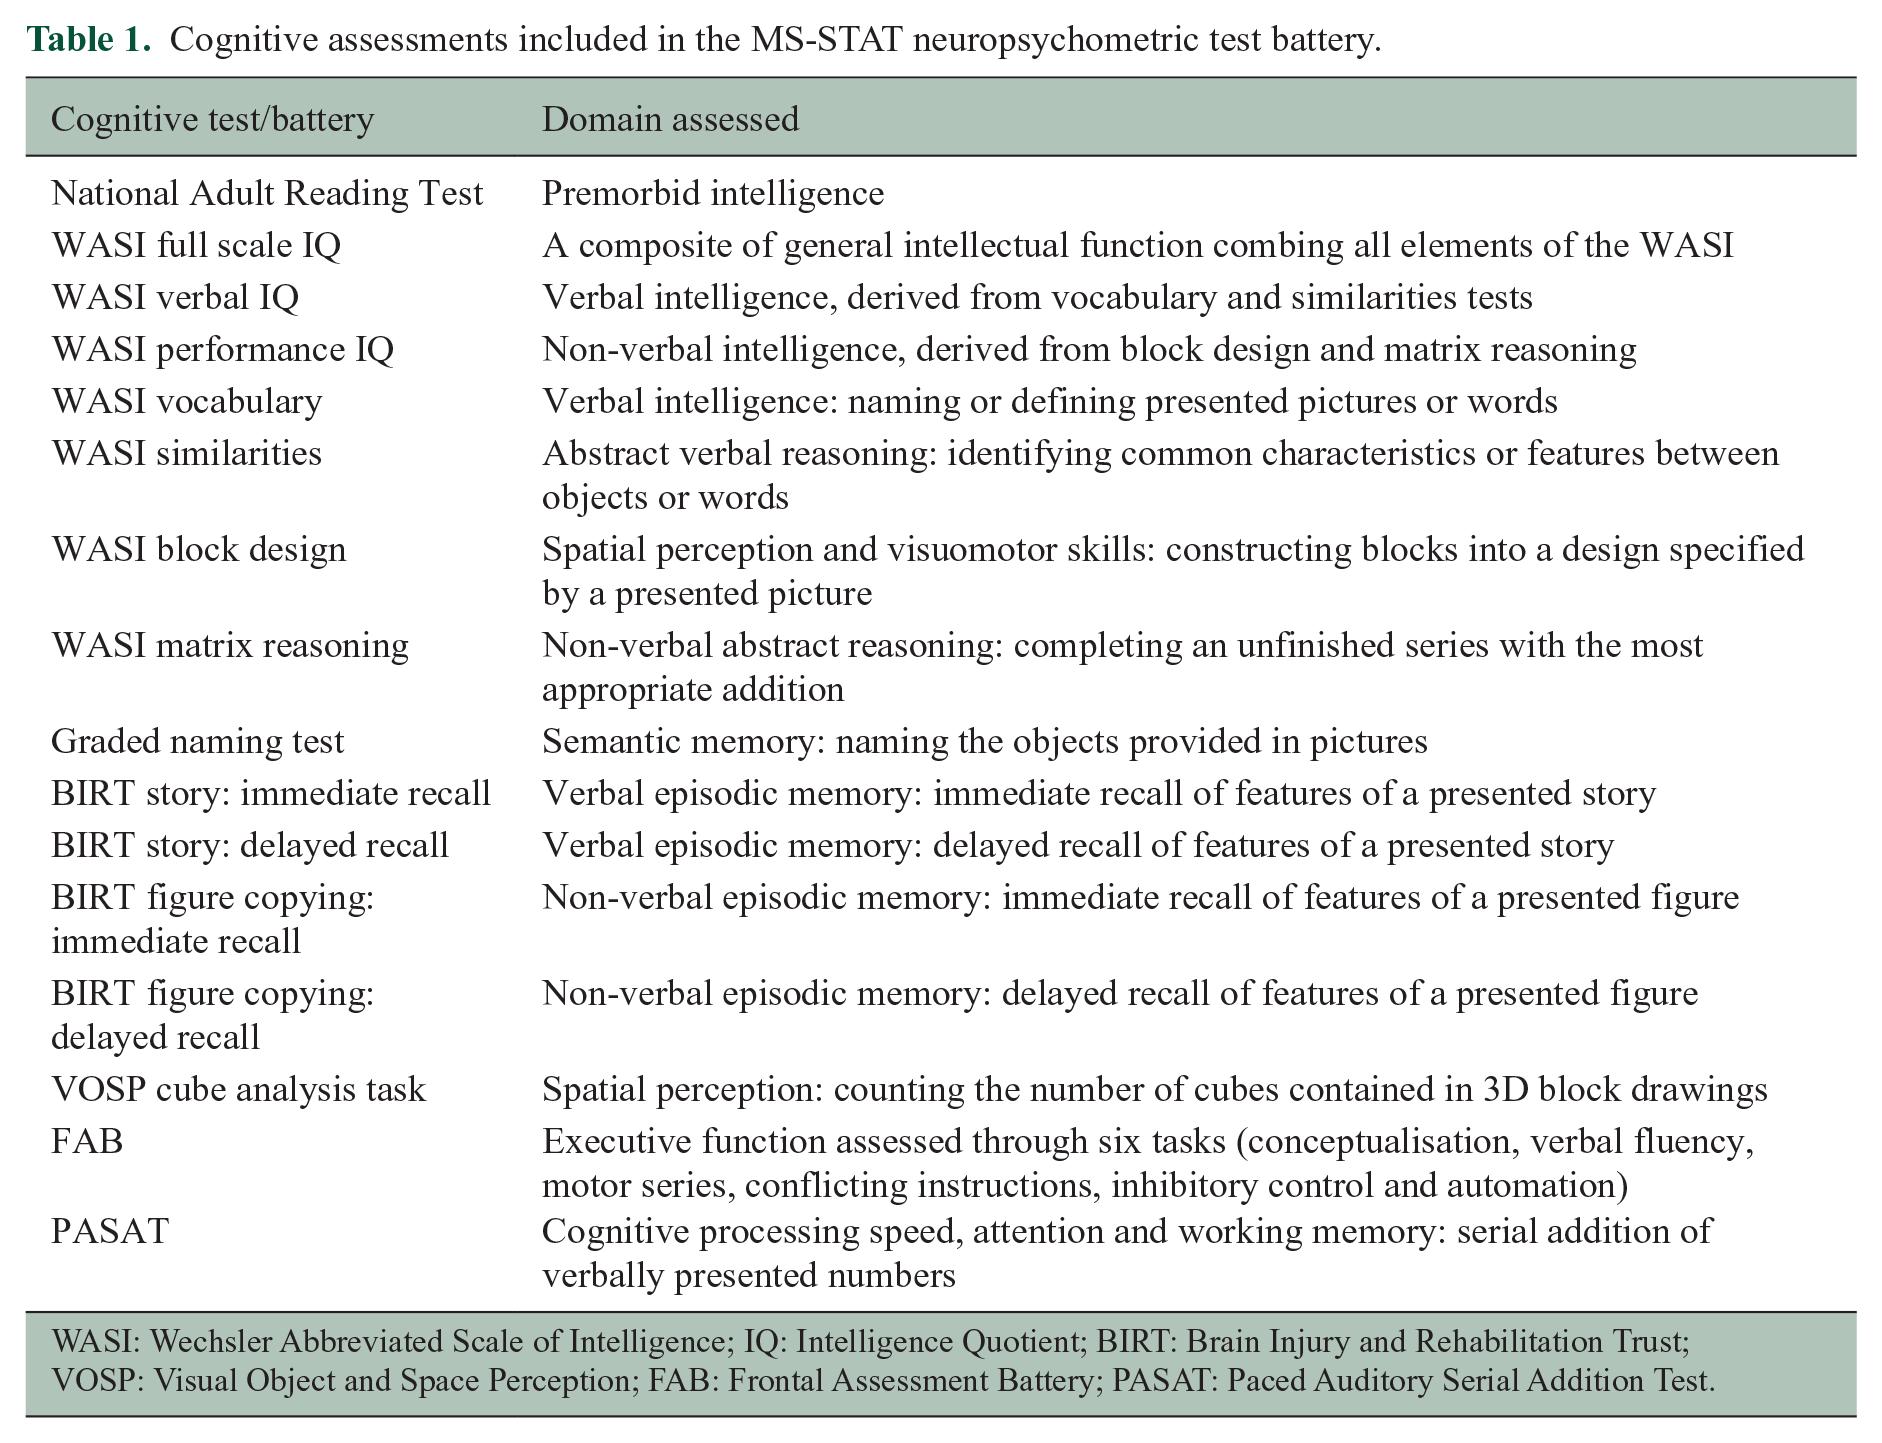
WASI: Wechsler Abbreviated Scale of Intelligence; IQ: Intelligence Quotient; BIRT: Brain Injury and Rehabilitation Trust; VOSP: Visual Object and Space Perception; FAB: Frontal Assessment Battery; PASAT: Paced Auditory Serial Addition Test.
MRI processing
The imaging data were acquired as previously described.14,17 Briefly, 3D T1-weighted, double-echo proton density (PD) and T2-weighted MRI was obtained at baseline, Month 12 and month 25. T2 lesion masks were created with automated longitudinal lesion segmentation with manual editing and used to calculate T2LV (mL). 17 Images were segmented using geodesic information flows (GIF) to produce region of interest (ROI) volumes. Volumes were normalised by the covariate regression method using total intracranial volume (TIV). 18 Whole-brain atrophy was determined using the boundary shift integral method and expressed as yearly percentage change in whole brain volume (PBVC). 14 Longitudinal change in all other predictor variables was included by the established method of creating a summary measure of the rate of change for each individual participant based on the linear regression slope between these variables and time. 19
Statistical analysis
The pre-specified primary outcome was to assess the relationship between baseline sNfL with the change in WASI Full Scale IQ from baseline to 24 months, while adjusting for baseline demographic and MRI variables. Pre-specified secondary outcomes included the same analysis, but with change in the other cognitive variables as the outcome. A post hoc exploratory analysis investigated the relationship between both baseline sNfL and MRI predictors, and rate of change in these variables from baseline to 24 months, with the primary cognitive outcome of WASI Full Scale IQ.
Identification of regional volume variables
The following ROIs were included due to their previously reported associations with cognitive performance in people with multiple sclerosis (pwMS): T2LV, whole brain volume (nWBV), cortical grey matter volume (nCGMV), deep grey matter volume (nDGMV), white matter volume (nWMV), thalamic volume (nThalamus) and hippocampal volume (nHippocampus). The following additional ROIs were also included, as they demonstrated the fastest degree of atrophy in this cohort: 17 transverse temporal gyrus (nTTG), post-central gyrus medial segment (nMPOG), pre-central gyrus medial segment (nMPRG), planum polare (nPP), frontal operculum (nFO), superior frontal gyrus medial segment (nSFG), planum temporale (nPT), supramarginal gyrus (nSMG), supplementary motor cortex (nSMC) and the post-central gyrus (nPOG).
Each of these ROI were first examined individually in linear mixed effect models. The baseline ROI was the predictor, and longitudinal WASI Full Scale IQ was the dependent variable. The following covariates were included: years in education, premorbid IQ (from the National Adult Reading Test), age, sex, dichotomised baseline EDSS (< 6.0 vs ⩾ 6.0), trial treatment allocation (simvastatin or placebo) and baseline TIV. For the predictor and all covariates, their interaction with time (in months) was included in the model. Adjustment for multiple comparisons was made using the false discovery rate (FDR). 20
Combined model of baseline sNfL and MRI predictors
A linear mixed effect model was constructed, as above. Baseline sNfL together with baseline MRI ROI which maintained significance after adjustment for multiple comparisons were included as predictors. The same covariates and interactions with time were included. For the primary analysis, the dependent variable was longitudinal WASI Full Scale IQ; for the pre-specified secondary analyses, separate models were constructed with each of the other longitudinal cognitive measures as the dependent variable. Models for FAB and VOSP violated assumptions, and hence, coefficients and the 95% confidence intervals for these variables were generated through non-parametric, bias-corrected and accelerated bootstrap with 10,000 replications. Sensitivity analyses were performed following the exclusion of one outlier with high model residuals and very high baseline sNfL (116 pg/mL).
Exploratory models
Unadjusted univariable scatter plots and linear regression models were constructed for dependent variables with significant relationships with sNfL, or trends, in the adjusted models. Baseline log2NfL was the predictor, and change in cognitive performance from baseline to 2 years, calculated by simple subtraction, was the dependent variable.
For the models including longitudinal change in the predictor variables, the participant-level rate of change for each variable was included alongside the same baseline predictor variable in separate linear mixed effect models. For each predictor, adjustment for multiple comparisons was made. Only longitudinal predictors that were independently associated with cognitive performance alongside their baseline variable, after adjustment, were considered for a final multivariable model.
p-values are only presented for the pre-specified primary outcome. For the multiple secondary and exploratory outcomes, coefficient estimates and their 95% confidence interval are presented. While the inclusion of multiple secondary analyses will increase the family-wise type-I error rate, it does not increase the individual per-comparison-wise error rate of each test. 21 The results of the secondary analyses should not, however, be generalised beyond the precise relationships assessed. 21
Ethical approvals and consent
The study was conducted in accordance with Good Clinical Practice and the Declaration of Helsinki. The MS-STAT protocol was approved by each study site’s Institutional Review Board and a National Ethics Committee; all patients gave written informed consent and ethical approval for the retrospective analysis of serum samples was received. The MS-STAT clinical trial identification number is NCT00647348.
Results
The MS-STAT trial cohort was described previously. 14 Overall, 110 participants had sufficient sNfL, MRI and neuropsychometric data to be included in the primary analysis, 101 of whom had at least one follow-up cognitive assessment. A total of 274 neuropsychological test batteries were included for these 110 participants. The characteristics of the 110 participants were similar to the overall MS-STAT trial population (Table S1 and Table 2). Median age, disease duration and EDSS were 51, 21 and 6.0, respectively.
Baseline characteristics of participants included in this analysis.
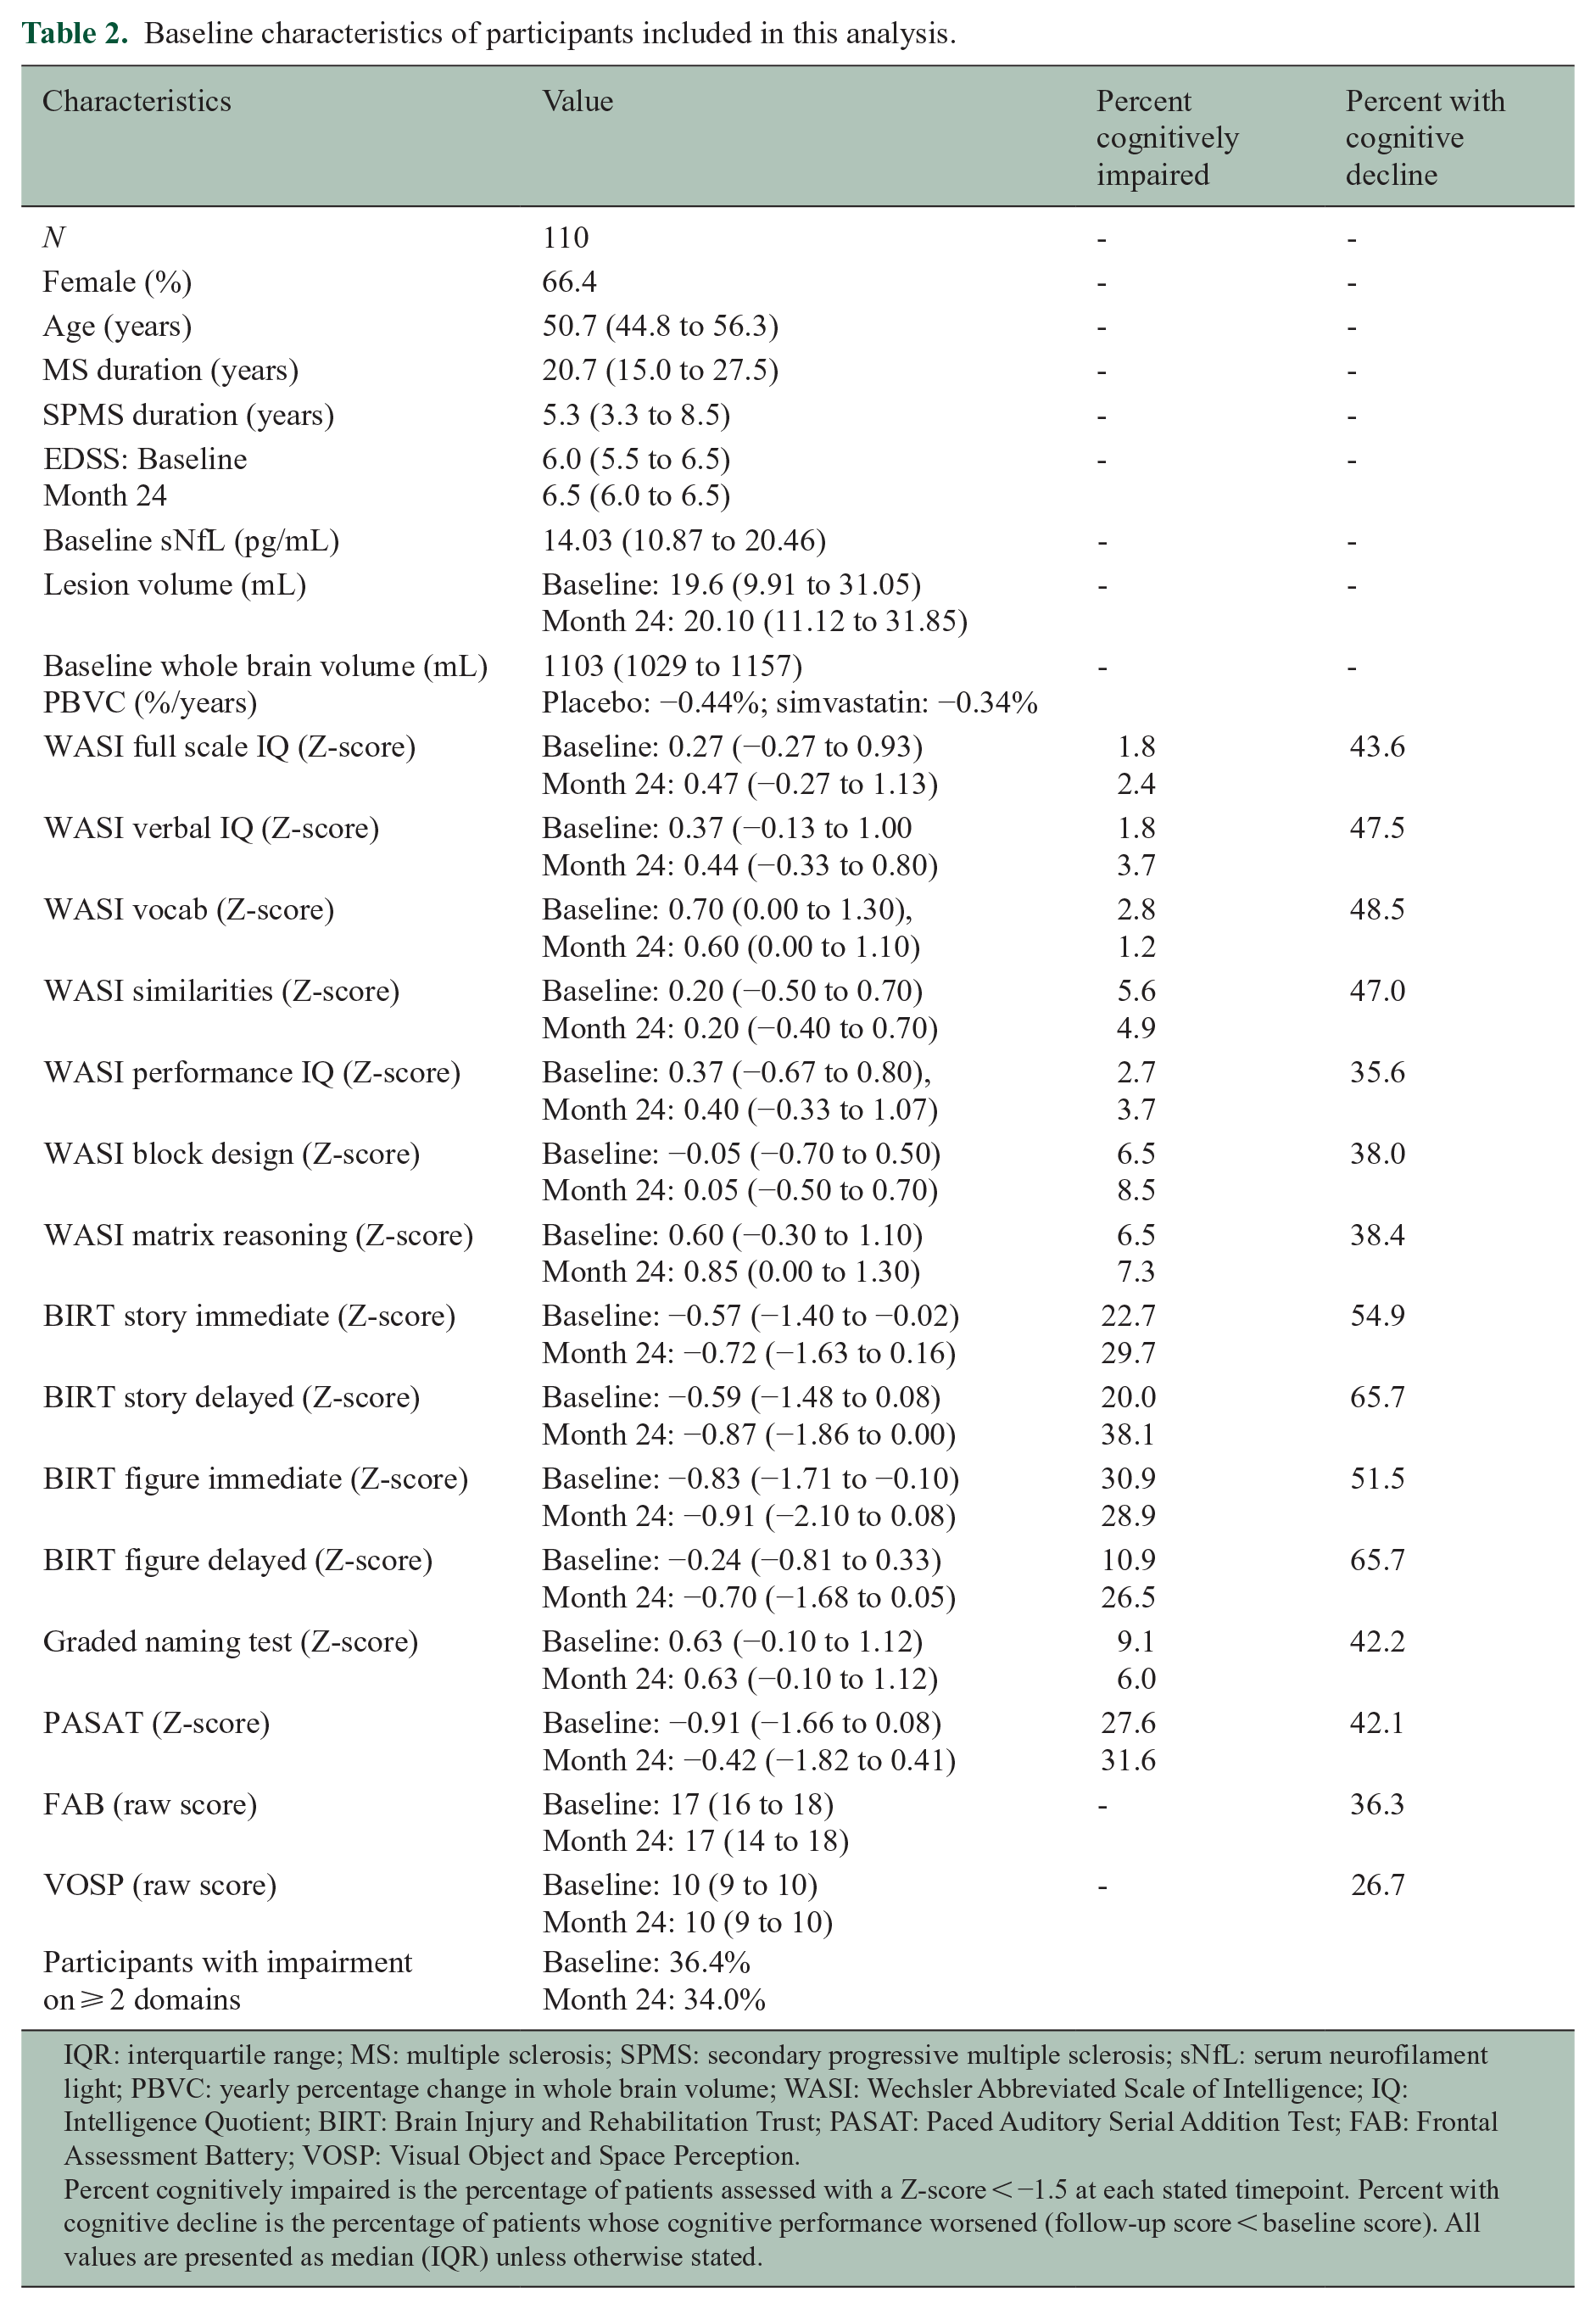
IQR: interquartile range; MS: multiple sclerosis; SPMS: secondary progressive multiple sclerosis; sNfL: serum neurofilament light; PBVC: yearly percentage change in whole brain volume; WASI: Wechsler Abbreviated Scale of Intelligence; IQ: Intelligence Quotient; BIRT: Brain Injury and Rehabilitation Trust; PASAT: Paced Auditory Serial Addition Test; FAB: Frontal Assessment Battery; VOSP: Visual Object and Space Perception.
Percent cognitively impaired is the percentage of patients assessed with a Z-score < −1.5 at each stated timepoint. Percent with cognitive decline is the percentage of patients whose cognitive performance worsened (follow-up score < baseline score). All values are presented as median (IQR) unless otherwise stated.
Compared to published healthy control data, participants had a low degree of impairment (defined as Z-scores < −1.5) on the WASI (Table 2). More participants were defined as impaired on the BIRT and PASAT. Across all cognitive variables, however, a substantial proportion of the cohort demonstrated worsening between baseline and follow-up (Table 2).
Relationship between baseline sNfL, MRI variables and change in WASI Full Scale IQ
When analysed individually and after adjustment for multiple comparisons, the following MRI variables were associated with poorer baseline WASI Full Scale IQ performance: higher T2LV, lower nCGM volume, lower nDGM volume and lower nTTG volume (Table S2). No MRI variables were significantly associated with the subsequent rate of change in WASI Full Scale IQ.
These significant MRI variables were combined with baseline sNfL in the primary analysis, the results of which are shown in Table 3. While lower nTTG volume was independently associated with poorer baseline WASI Full Scale IQ, only higher baseline sNfL was independently associated with a faster rate of decline in WASI Full Scale IQ from baseline to Month 24. While controlling for covariates, a 1 mL decrease in baseline nTTG volume was associated with a 0.362 [0.026–0.698] point poorer baseline WASI Full Scale IQ Z-score (p = 0.035), while a doubling of baseline sNfL was associated with a 0.010 [0.003–0.017] point per month faster decline in WASI Full Scale IQ Z-score (p = 0.008).
Results from the primary analysis examining the relationship between baseline sNfL, MRI variables and repeated-measures WASI Full Scale IQ.
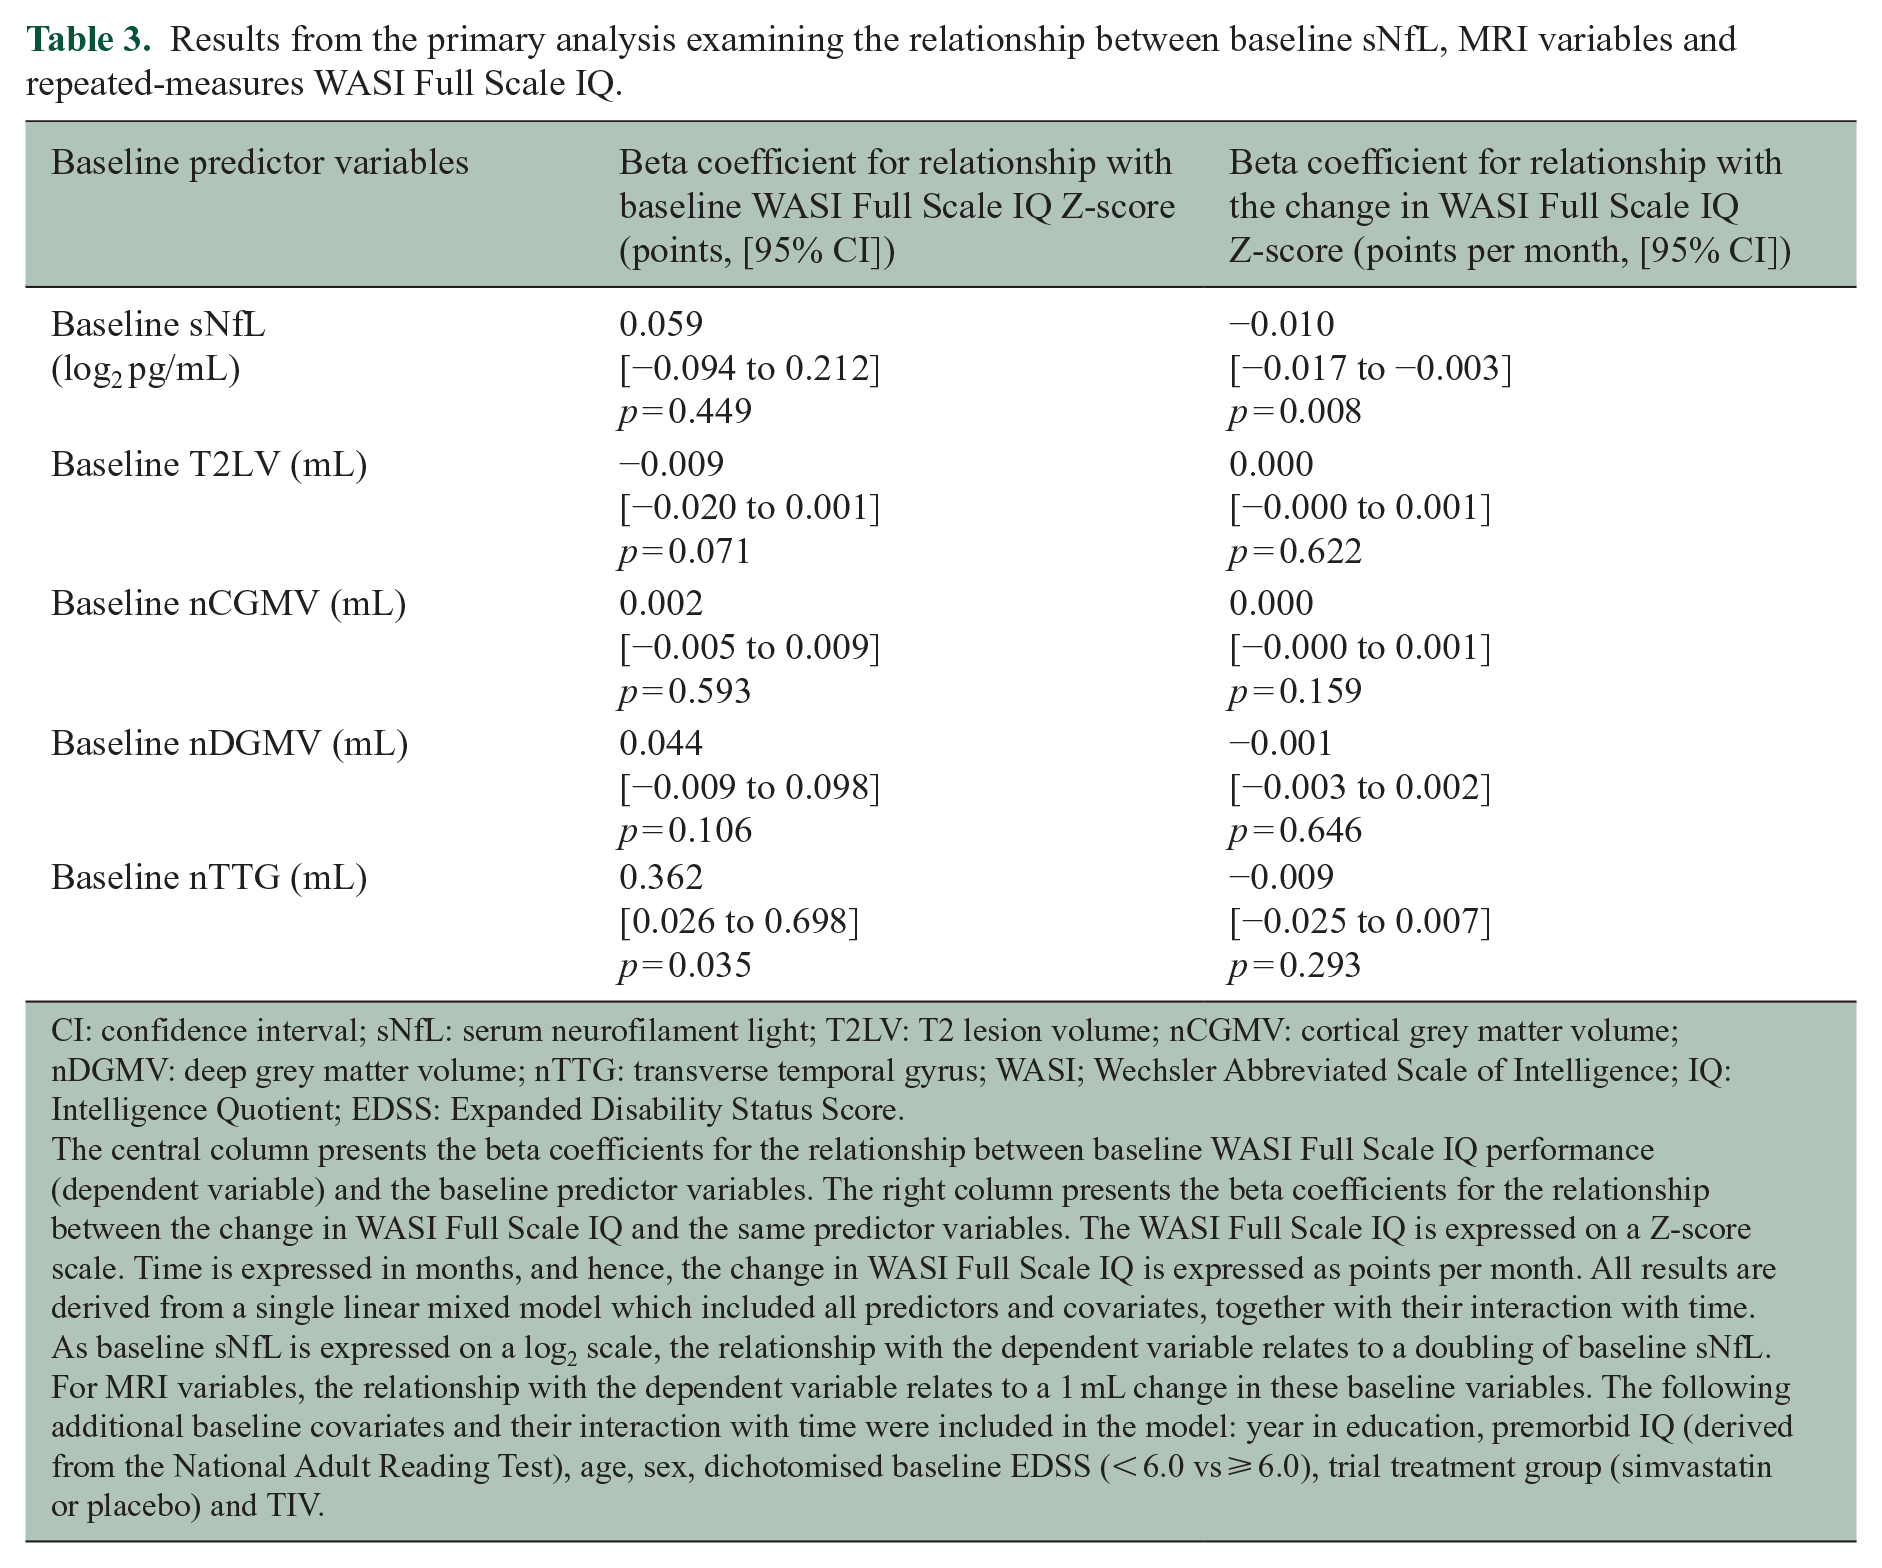
CI: confidence interval; sNfL: serum neurofilament light; T2LV: T2 lesion volume; nCGMV: cortical grey matter volume; nDGMV: deep grey matter volume; nTTG: transverse temporal gyrus; WASI; Wechsler Abbreviated Scale of Intelligence; IQ: Intelligence Quotient; EDSS: Expanded Disability Status Score.
The central column presents the beta coefficients for the relationship between baseline WASI Full Scale IQ performance (dependent variable) and the baseline predictor variables. The right column presents the beta coefficients for the relationship between the change in WASI Full Scale IQ and the same predictor variables. The WASI Full Scale IQ is expressed on a Z-score scale. Time is expressed in months, and hence, the change in WASI Full Scale IQ is expressed as points per month. All results are derived from a single linear mixed model which included all predictors and covariates, together with their interaction with time. As baseline sNfL is expressed on a log2 scale, the relationship with the dependent variable relates to a doubling of baseline sNfL. For MRI variables, the relationship with the dependent variable relates to a 1 mL change in these baseline variables. The following additional baseline covariates and their interaction with time were included in the model: year in education, premorbid IQ (derived from the National Adult Reading Test), age, sex, dichotomised baseline EDSS (< 6.0 vs ⩾ 6.0), trial treatment group (simvastatin or placebo) and TIV.
Relationship between baseline sNfL, MRI variables and all other cognitive variables
The results of the secondary analyses, which included all other cognitive variables, are shown in Table 4 (baseline cognitive performance) and Table 5 (rate of change in cognitive performance). Similar trends were seen as in the primary analysis. Lower nCGMV, lower nDGMV and lower nTTG volume were frequently associated with poorer baseline cognitive performance (Table 4). In contrast, higher baseline sNfL was frequently associated with a faster rate of decline in cognition (Table 5).
Results from secondary analyses examining the relationship between baseline sNfL and MRI variables with baseline performance on all other cognitive assessments.
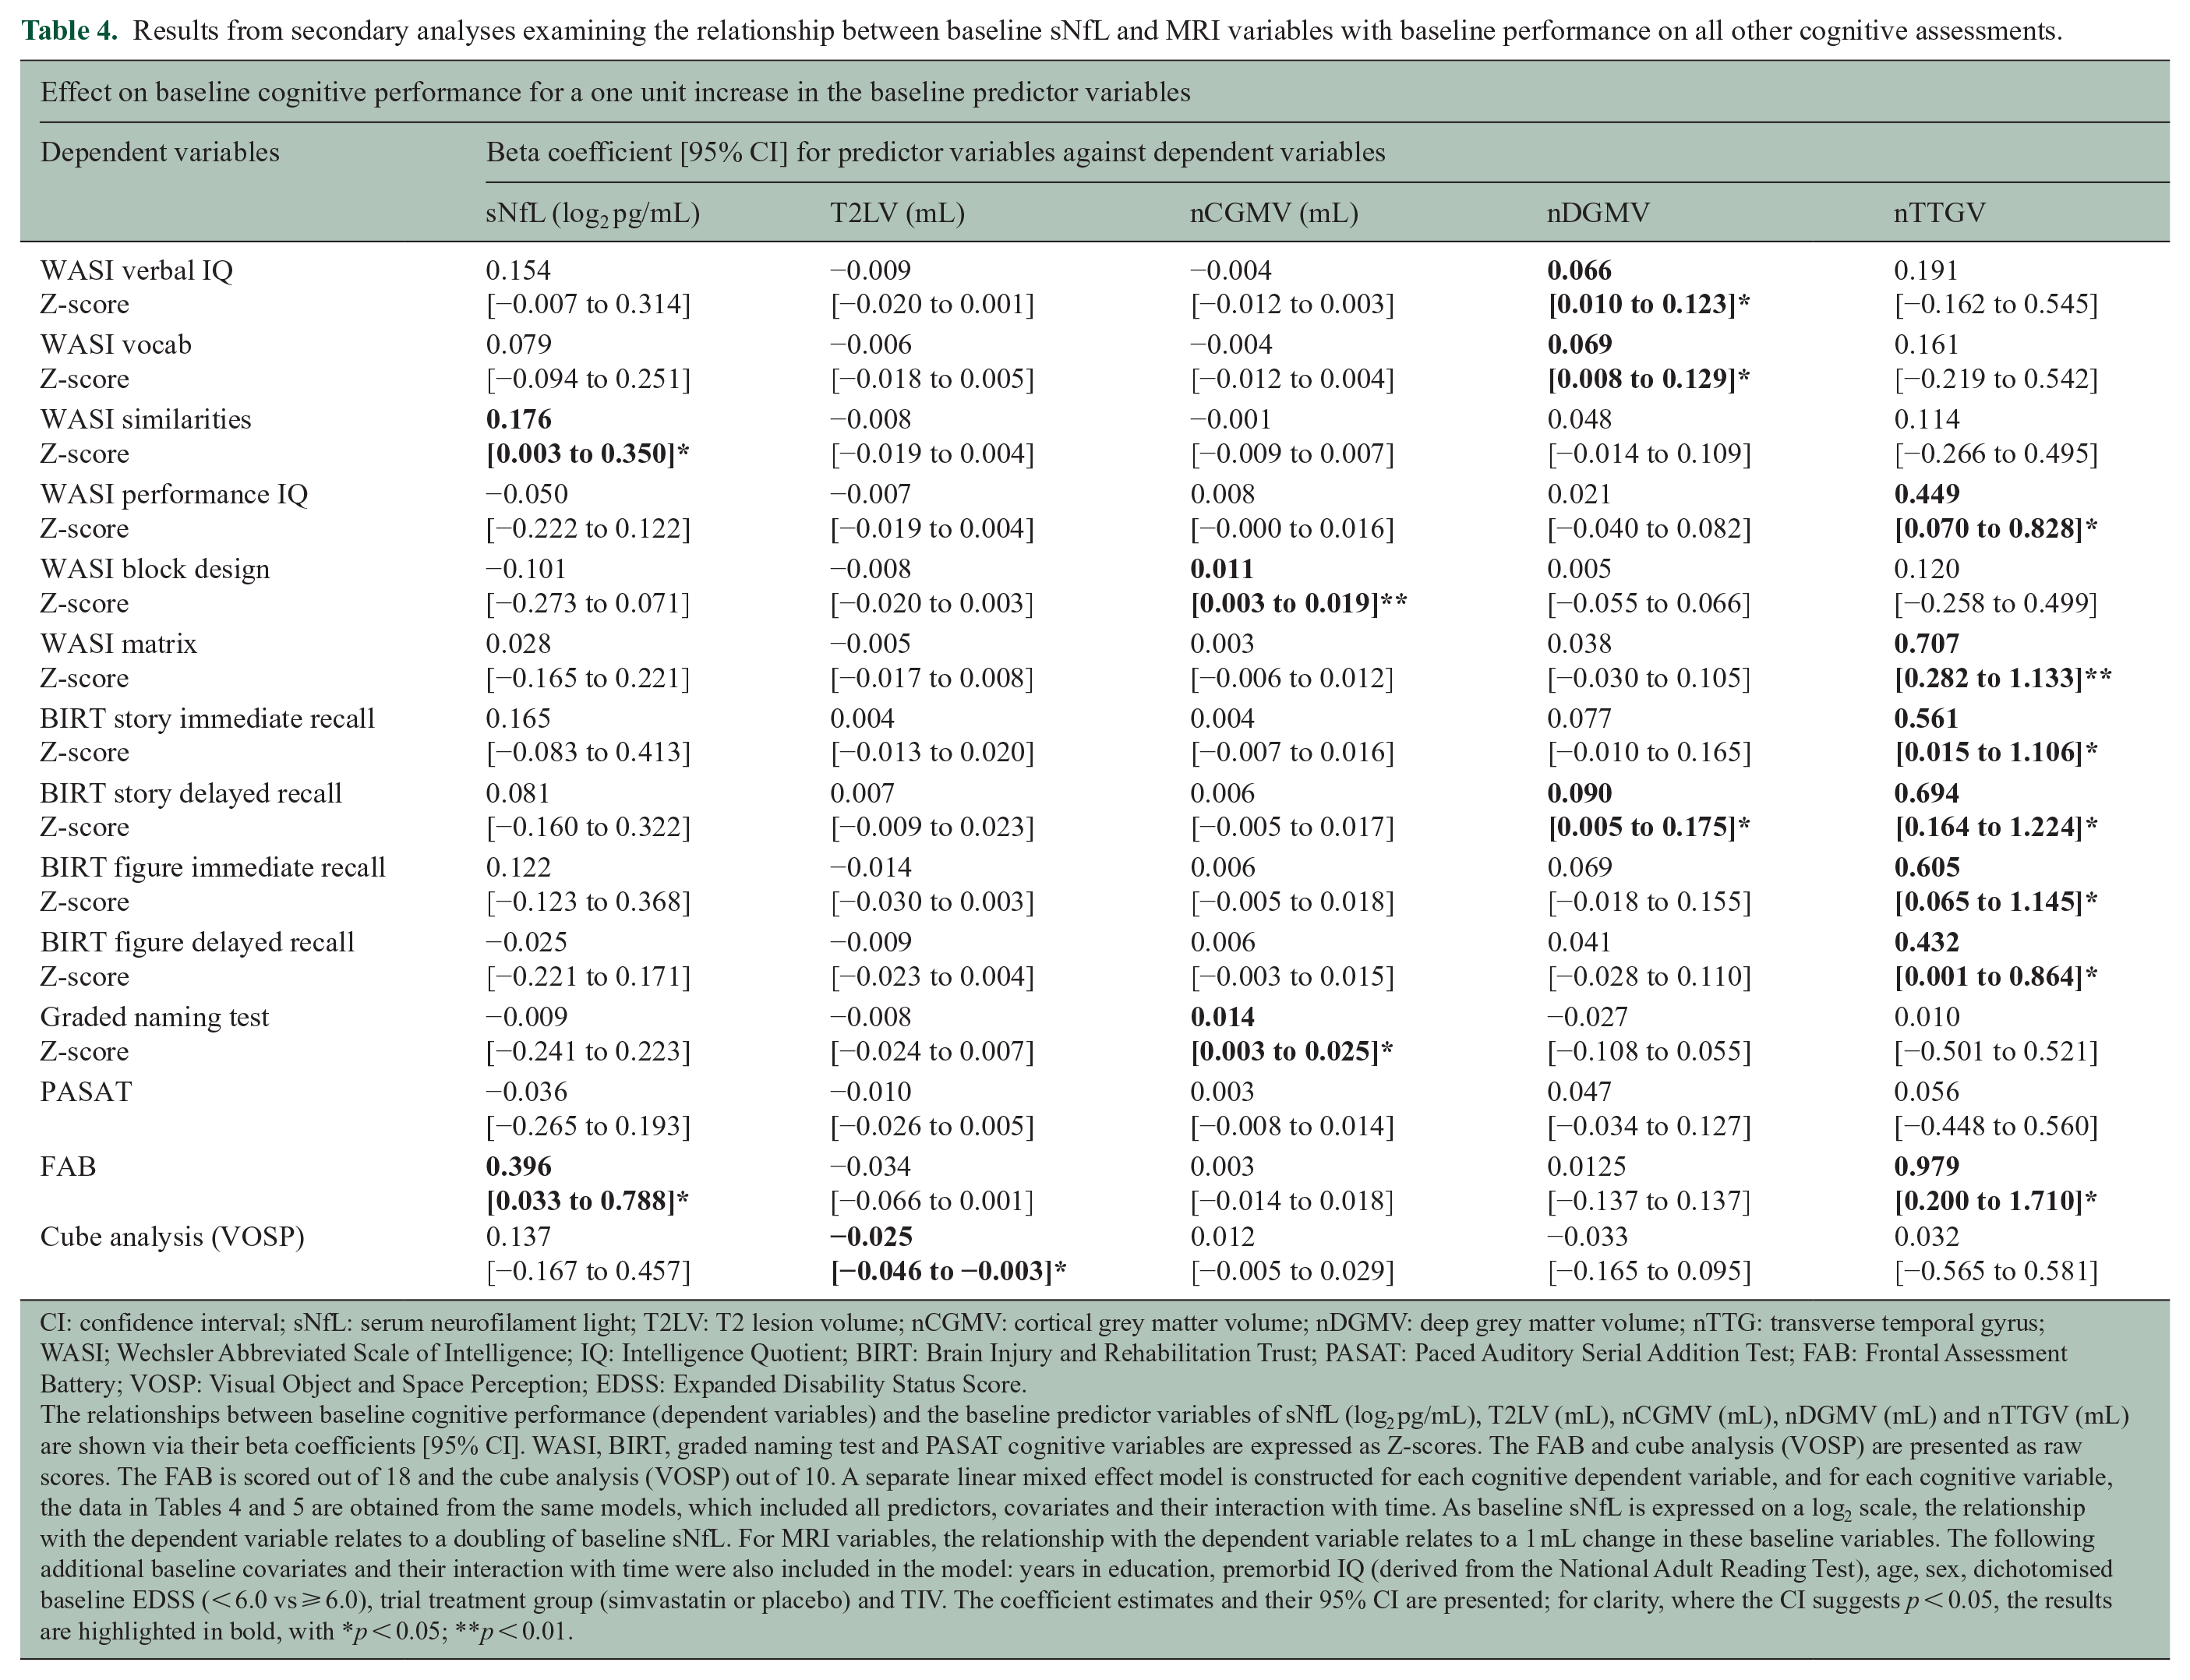
CI: confidence interval; sNfL: serum neurofilament light; T2LV: T2 lesion volume; nCGMV: cortical grey matter volume; nDGMV: deep grey matter volume; nTTG: transverse temporal gyrus; WASI; Wechsler Abbreviated Scale of Intelligence; IQ: Intelligence Quotient; BIRT: Brain Injury and Rehabilitation Trust; PASAT: Paced Auditory Serial Addition Test; FAB: Frontal Assessment Battery; VOSP: Visual Object and Space Perception; EDSS: Expanded Disability Status Score.
The relationships between baseline cognitive performance (dependent variables) and the baseline predictor variables of sNfL (log2 pg/mL), T2LV (mL), nCGMV (mL), nDGMV (mL) and nTTGV (mL) are shown via their beta coefficients [95% CI]. WASI, BIRT, graded naming test and PASAT cognitive variables are expressed as Z-scores. The FAB and cube analysis (VOSP) are presented as raw scores. The FAB is scored out of 18 and the cube analysis (VOSP) out of 10. A separate linear mixed effect model is constructed for each cognitive dependent variable, and for each cognitive variable, the data in Tables 4 and 5 are obtained from the same models, which included all predictors, covariates and their interaction with time. As baseline sNfL is expressed on a log2 scale, the relationship with the dependent variable relates to a doubling of baseline sNfL. For MRI variables, the relationship with the dependent variable relates to a 1 mL change in these baseline variables. The following additional baseline covariates and their interaction with time were also included in the model: years in education, premorbid IQ (derived from the National Adult Reading Test), age, sex, dichotomised baseline EDSS (< 6.0 vs ⩾ 6.0), trial treatment group (simvastatin or placebo) and TIV. The coefficient estimates and their 95% CI are presented; for clarity, where the CI suggests p < 0.05, the results are highlighted in bold, with *p < 0.05; **p < 0.01.
Results from secondary analyses examining the relationship between baseline sNfL and MRI variables with the change in performance for all other cognitive variables.
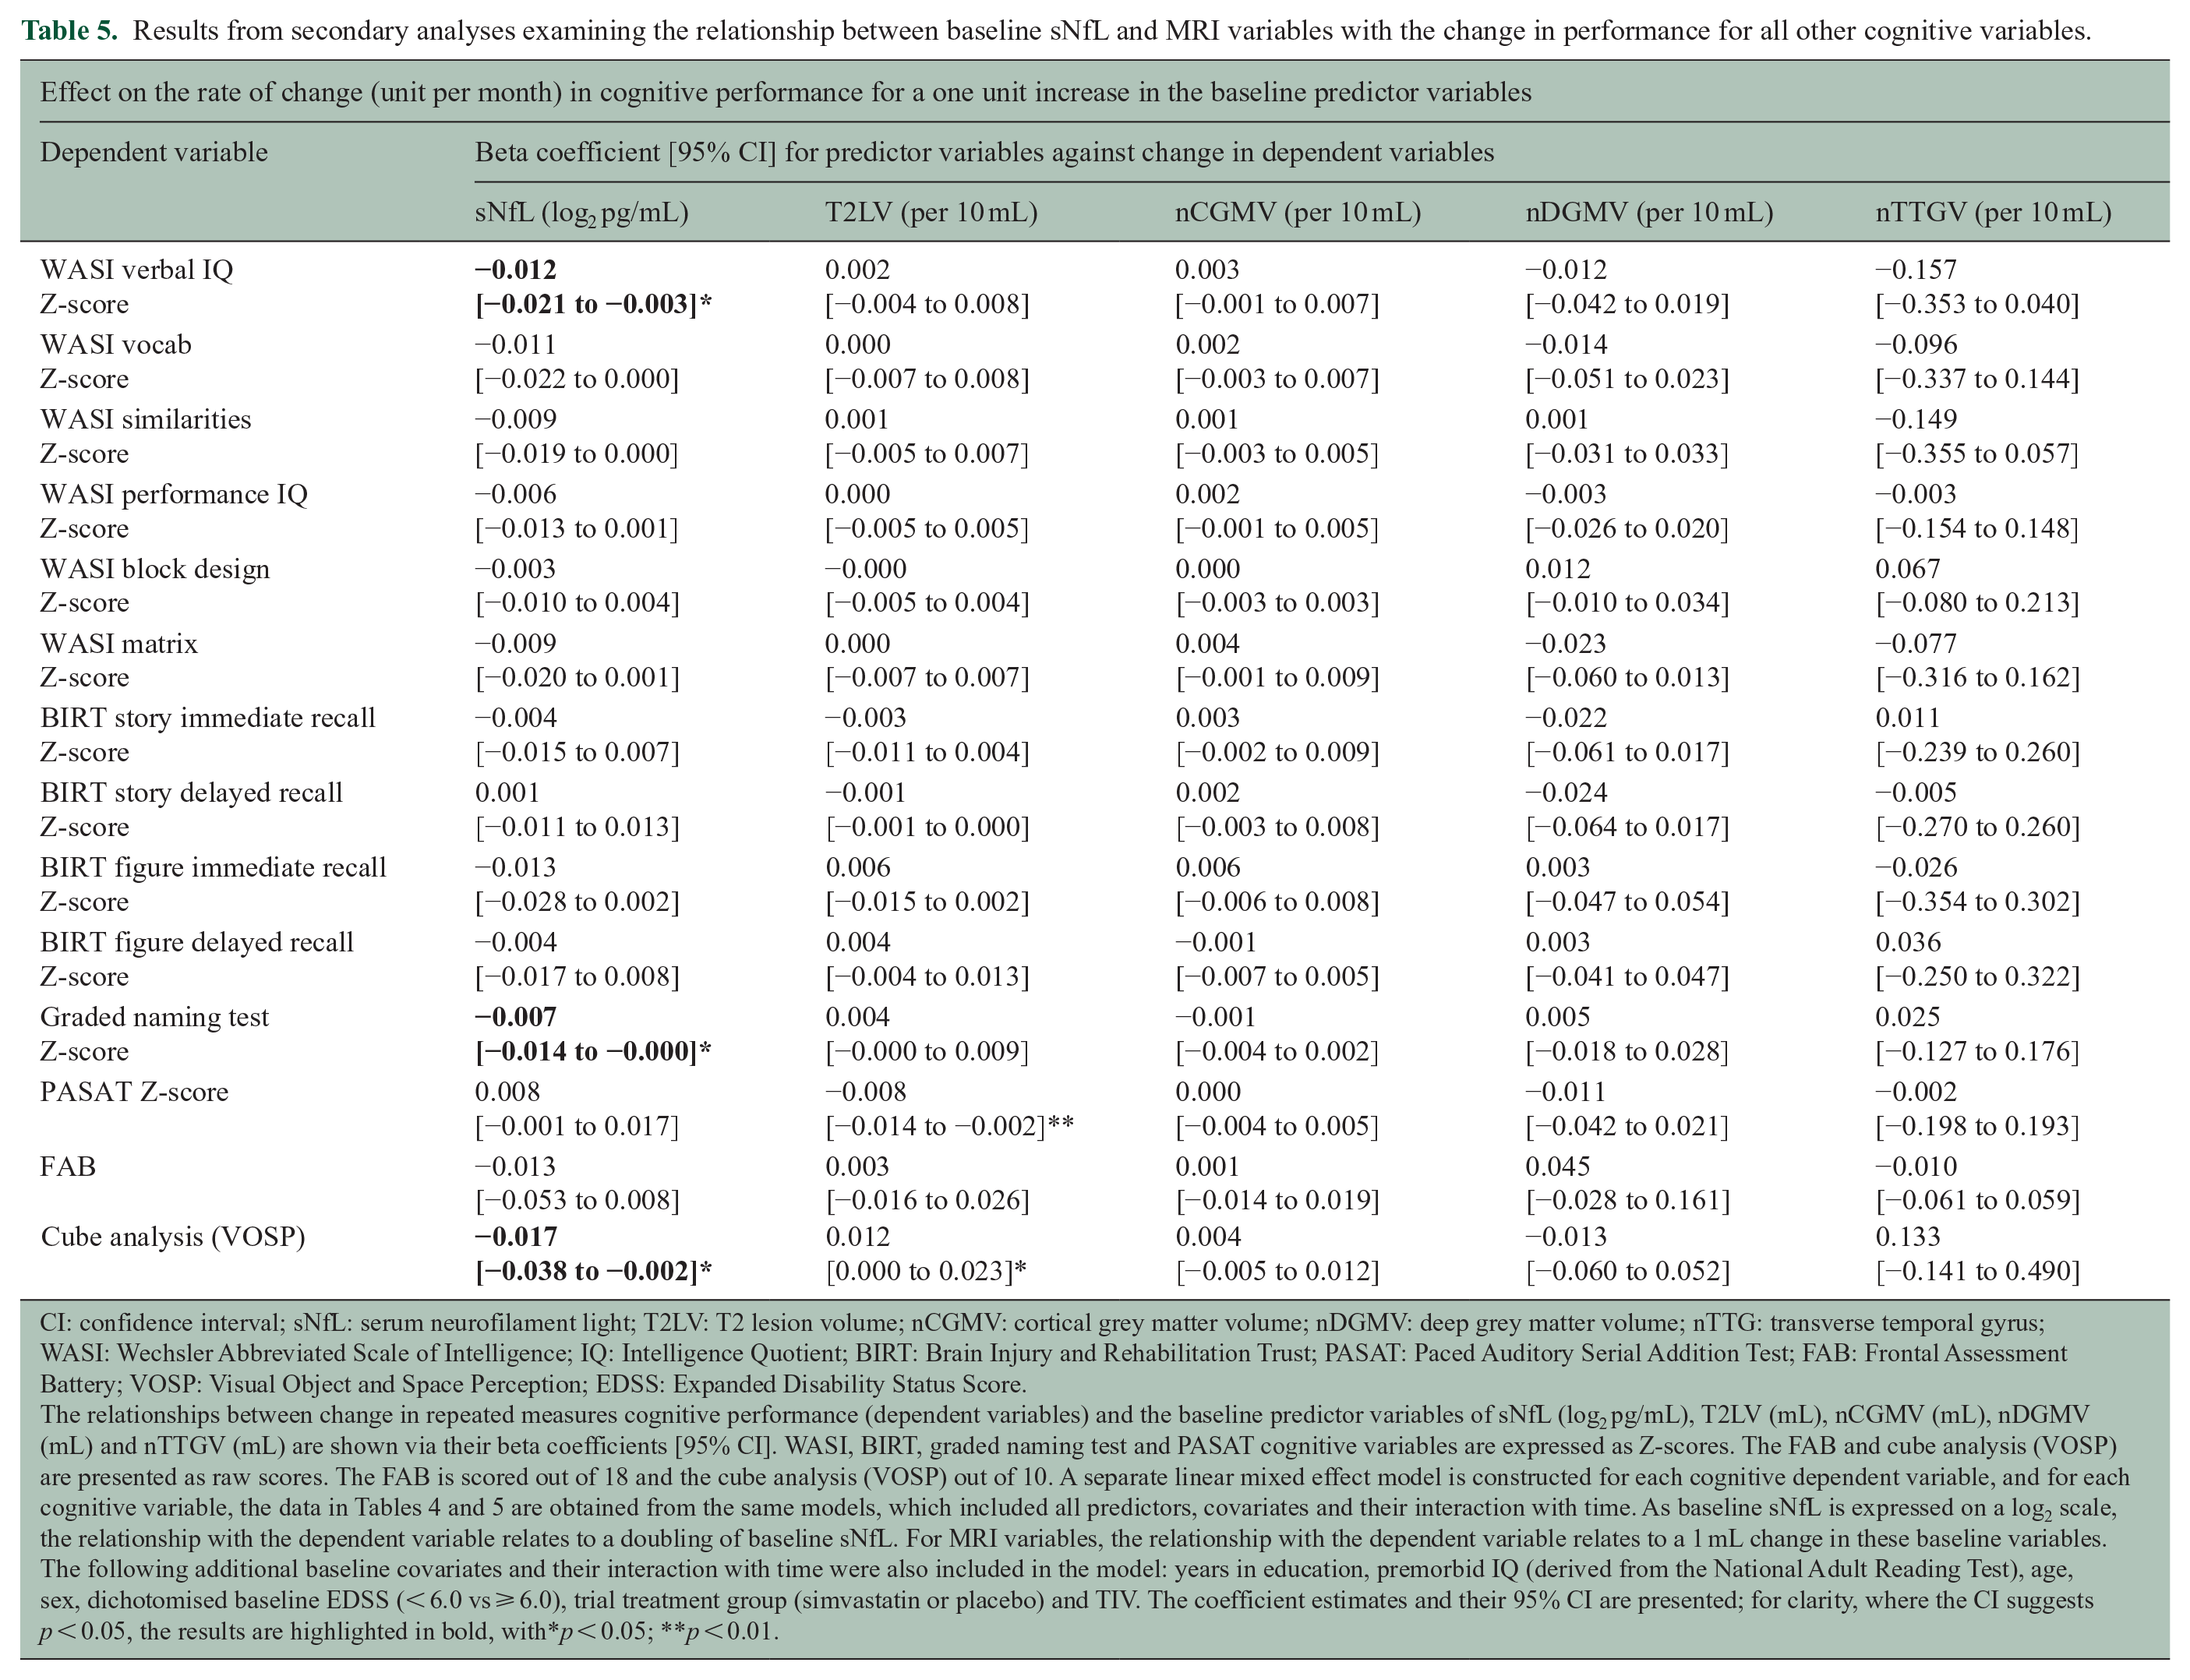
CI: confidence interval; sNfL: serum neurofilament light; T2LV: T2 lesion volume; nCGMV: cortical grey matter volume; nDGMV: deep grey matter volume; nTTG: transverse temporal gyrus; WASI: Wechsler Abbreviated Scale of Intelligence; IQ: Intelligence Quotient; BIRT: Brain Injury and Rehabilitation Trust; PASAT: Paced Auditory Serial Addition Test; FAB: Frontal Assessment Battery; VOSP: Visual Object and Space Perception; EDSS: Expanded Disability Status Score.
The relationships between change in repeated measures cognitive performance (dependent variables) and the baseline predictor variables of sNfL (log2 pg/mL), T2LV (mL), nCGMV (mL), nDGMV (mL) and nTTGV (mL) are shown via their beta coefficients [95% CI]. WASI, BIRT, graded naming test and PASAT cognitive variables are expressed as Z-scores. The FAB and cube analysis (VOSP) are presented as raw scores. The FAB is scored out of 18 and the cube analysis (VOSP) out of 10. A separate linear mixed effect model is constructed for each cognitive dependent variable, and for each cognitive variable, the data in Tables 4 and 5 are obtained from the same models, which included all predictors, covariates and their interaction with time. As baseline sNfL is expressed on a log2 scale, the relationship with the dependent variable relates to a doubling of baseline sNfL. For MRI variables, the relationship with the dependent variable relates to a 1 mL change in these baseline variables. The following additional baseline covariates and their interaction with time were also included in the model: years in education, premorbid IQ (derived from the National Adult Reading Test), age, sex, dichotomised baseline EDSS (< 6.0 vs ⩾ 6.0), trial treatment group (simvastatin or placebo) and TIV. The coefficient estimates and their 95% CI are presented; for clarity, where the CI suggests p < 0.05, the results are highlighted in bold, with*p < 0.05; **p < 0.01.
Univariable analysis of baseline sNfL and change in cognitive performance
To further examine the relationships identified between baseline sNfL and change in cognitive performance, exploratory scatter plots and unadjusted univariable linear regression were performed. Figure 1 demonstrates the relationship between baseline sNfL and change in cognitive performance, which supported the results of primary and secondary analyses. Regression slopes are reported in the figure legend.
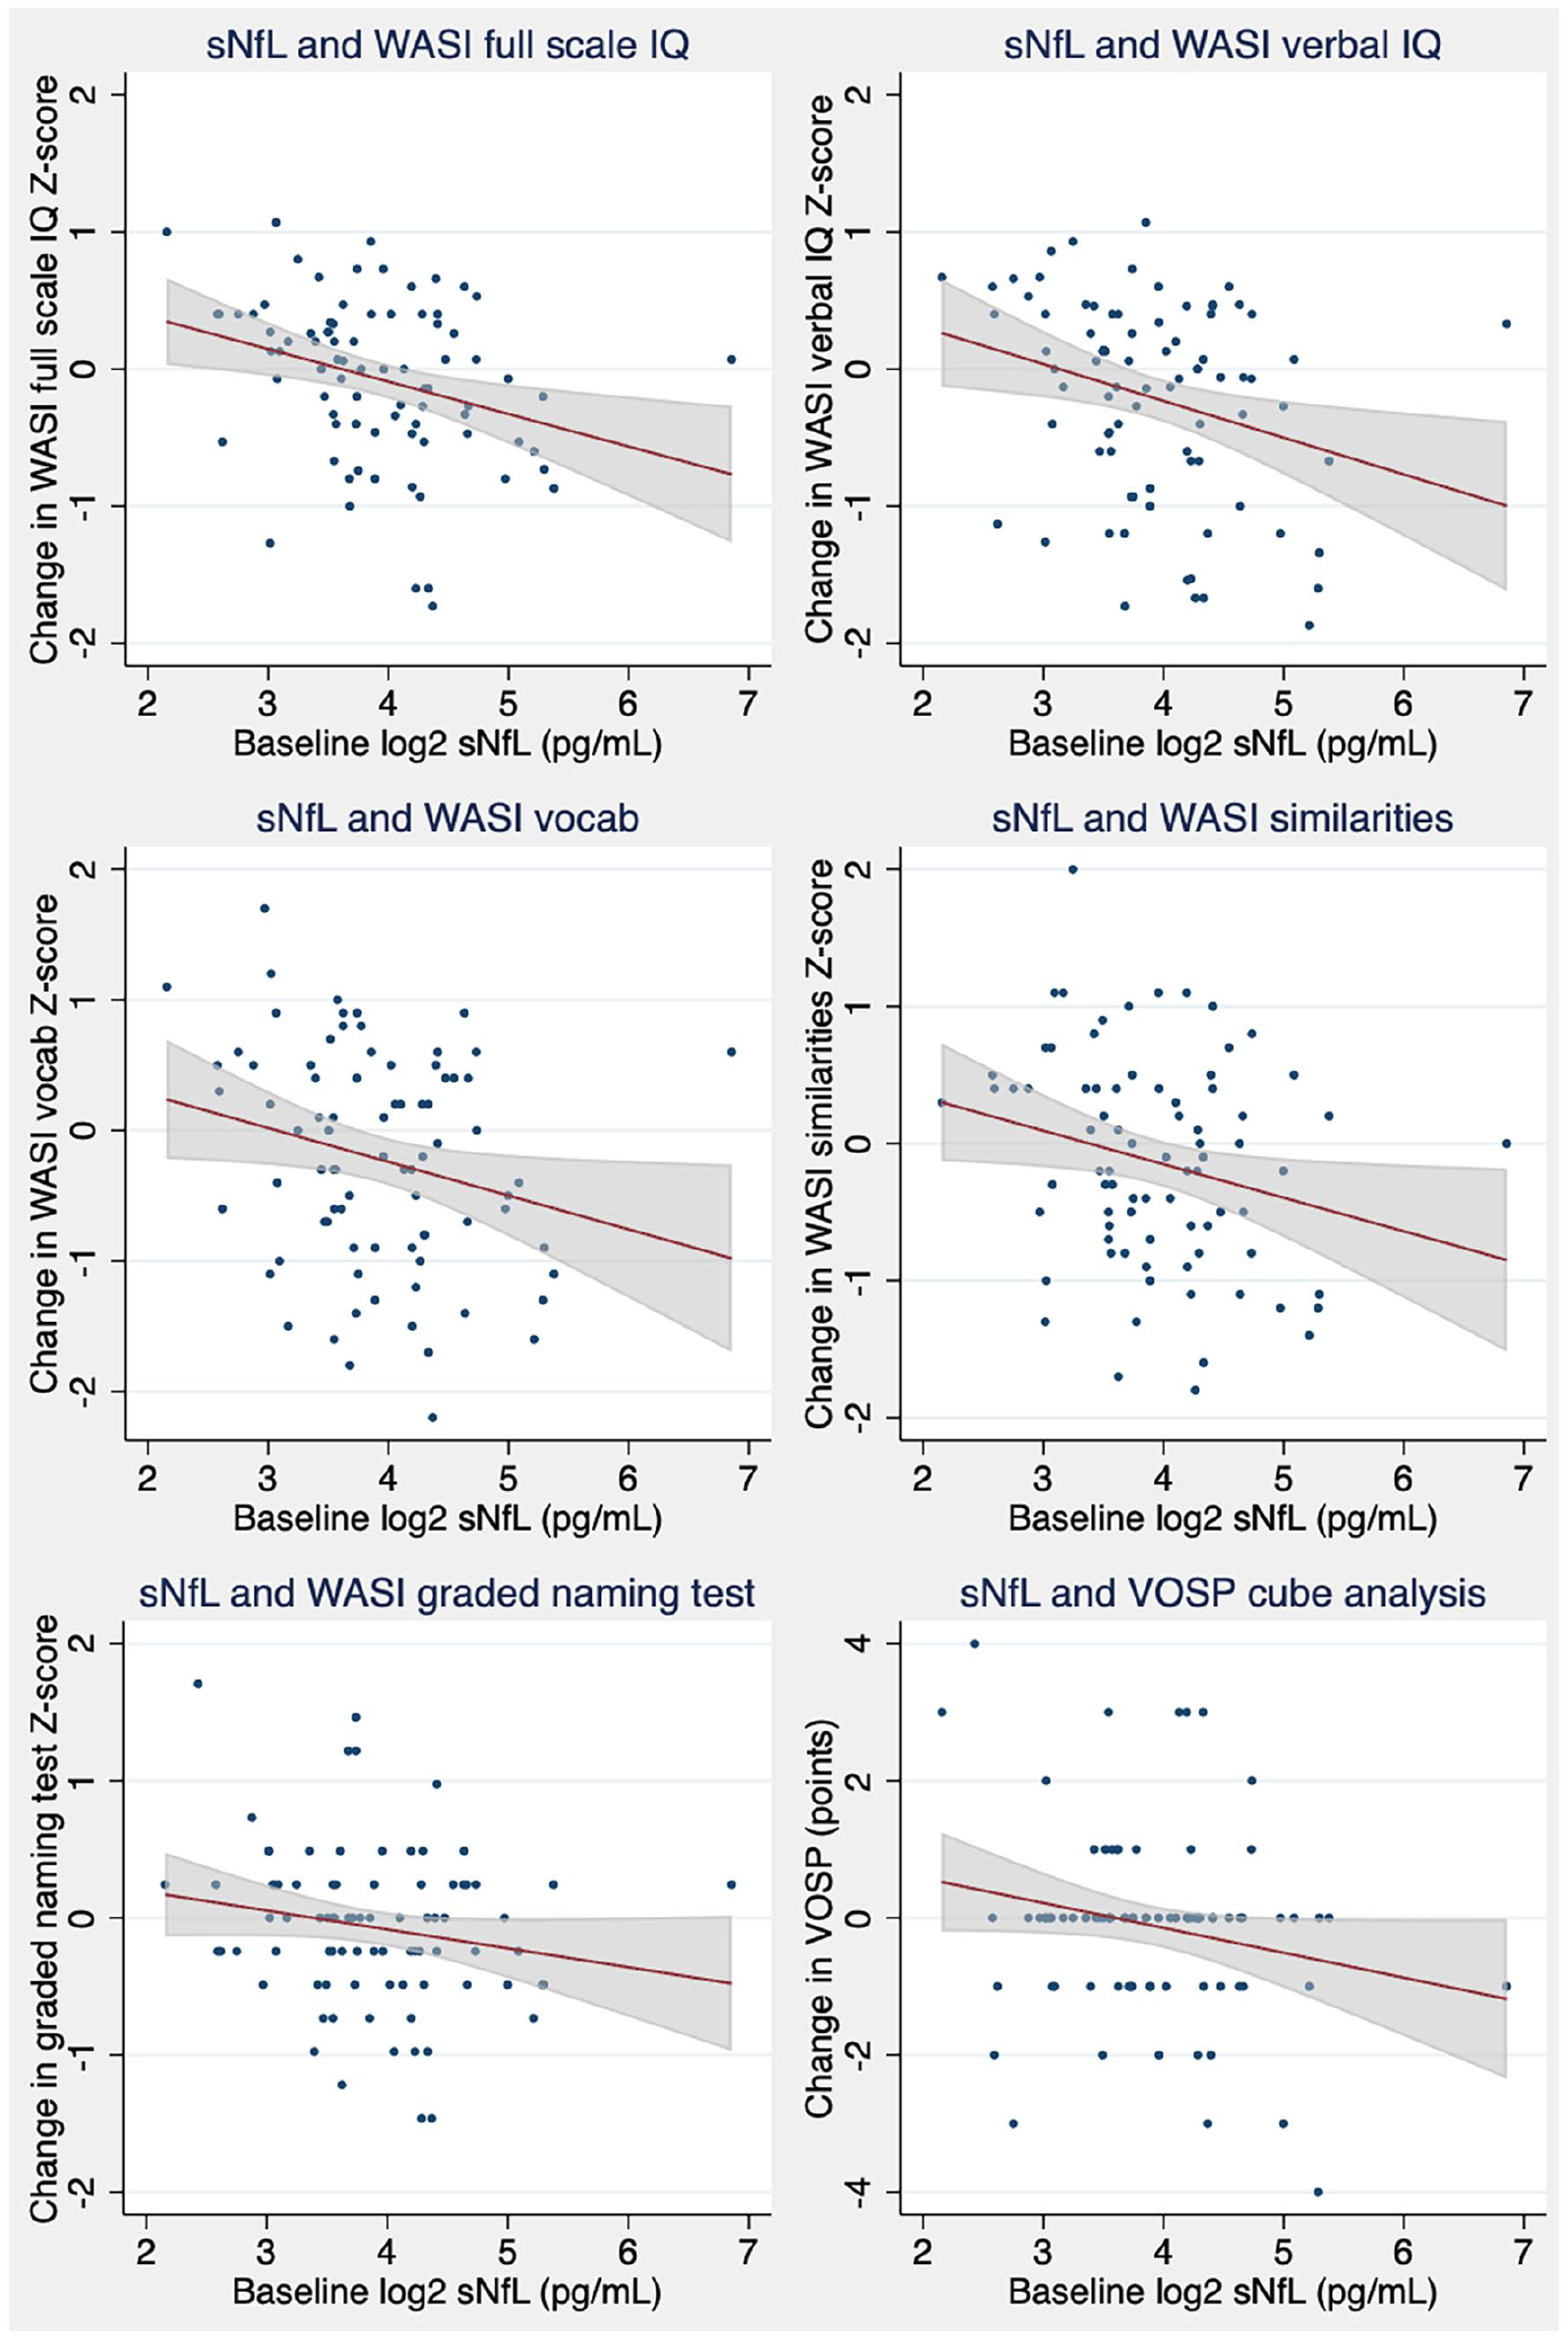
Unadjusted change in cognitive performance from baseline to 2 years, against baseline sNfL Plots represent raw unadjusted data, with univariable linear regression slope and 95% CI. Change in cognitive performance is calculated by simple subtraction of baseline performance from Month 24 performance, so a positive value represents improved cognition. The regression slope and 95% CI for each variable was as follows: WASI Full Scale IQ T-score, −2.4 [−4.0 to −0.7]; WASI verbal IQ T-score, −2.7 [−4.7 to −0.6]; WASI vocab T-score, −2.6 [−5.0 to −0.2]; WASI similarities T-score, −2.4 [−4.7 to −0.2]; Graded Naming Test, −1.4 [−3.0 to 0.2]; and VOSP cube analysis, −0.36 [−0.74 to 0.02]. CI, confidence interval; sNfL, serum neurofilament light; WASI; Wechsler Abbreviated Scale of Intelligence; IQ, Intelligence Quotient; VOSP, Visual Object and Space Perception.
Exploratory analysis of baseline sNfL and MRI variables, and their rates of change with time, against WASI Full Scale IQ
When included alongside their baseline values, none of the longitudinal rate of change predictor variables were associated with cognitive performance after adjustment for multiple comparisons (Table S3). No longitudinal predictor variables were therefore added to the multivariable model shown in Table 3.
Sensitivity analysis
An outlier was identified with high model residuals, high baseline sNfL (116 pg/mL; cohort median = 14.0 g/mL) and relatively stable cognitive performance, as visible in Figure 1. Repeating analyses following exclusion of this participant did not materially affect the results, with slight strengthening of all relationships between higher baseline sNfL and faster future cognitive decline (data not shown). Examining data from this individual, assessments of lower limb function were poor at baseline, but improved thereafter (25-foot time walk: 15.0, 9.4 and 10.8 seconds). sNfL levels fell during follow-up (116, 25.8, 29.6 and 14.5 pg/mL).
Discussion
We have assessed the extent to which sNfL can predict future decline in cognitive performance in PwSPMS from the MS-STAT trial. In the pre-specified primary analysis, we have demonstrated that independent of T2LV and selected regional normalised volumes, higher baseline sNfL was associated with a faster subsequent rate of decline in WASI Full Scale IQ from baseline to Month 24. The predicted 0.010 [0.003–0.017] point per month decline for each doubling of baseline sNfL corresponds to a 0.24 [0.07–0.41] point decline over the 24 months of the trial on the Z-score scale. For comparison, patients who have experienced a traumatic brain injury have a WASI Full Scale IQ of 0.64–0.87 points lower than a matched control group (on the Z-score scale). 22 None of the other predictors were associated with future decline on the WASI Full Scale IQ. In contrast to the association of sNfL with future changes in cognition, when assessed individually, higher T2LV and lower nCGM volume, nDGM volume and nTTG volume were associated with poorer current cognitive performance, with the association between cognition and nTTG volume remaining significant in the combined analysis. The results of our primary analysis were supported by secondary analyses. Lower nCGM volume, nDGM volume and nTTG volume were again found to often be associated with poorer baseline cognitive performance. Higher baseline sNfL was associated with a faster rate of decline in measures of verbal comprehension and on the VOSP cube analysis, and higher T2LV with faster decline on the PASAT. The significant independent relationships for sNfL were further supported by exploratory univariable analyses, as shown in Figure 1.
The demonstration that baseline MRI variables were often associated with current cognitive performance, while sNfL was associated with future cognitive decline, is biologically plausible. Normalised regional volumes estimate the cumulative loss since maximum brain volume was achieved. 18 Similarly, once formed, T2 lesions typically persist on MRI, hence T2LV also represents a cumulative measure of overall disease burden. Both such measures therefore incorporate pathological processes which may have occurred at any point during a patient’s disease (median 21 years in this cohort). As expected, our data suggest that this disease burden is related to current cognitive performance. In contrast, sNfL is released from ongoing neuro-axonal injury, and unlike regional volumes or T2LV, sNfL has a half-life, remaining elevated for perhaps only 3 months after an episode of disease activity. 23 Elevations in sNfL have been consistently associated with measures of recent inflammatory disease activity in patients with progressive MS. 24 Our data are therefore consistent with the hypothesis that increases in sNfL (representing the degree of ongoing neuro-axonal injury, largely caused by neuroinflammation) are not independently associated with poorer current cognitive performance, but instead are associated with a faster rate of future cognitive decline. In this regard, elevated sNfL may share similarities with gadolinium-enhancing lesions, which were not assessed in this cohort but have also previously been associated with poorer future cognitive performance in pwMS. 25 Our results are also in keeping with the results reported for other neurodegenerative conditions and cognitively normal older adults.26,27 Other fluid biomarkers previously associated with cognitive decline in pwMS include CSF CHI3L1 (a marker of glial activation) and oligoclonal bands, with the latter potentially driven by its association with cortical lesions.28,29
Our finding that lower nCGM and nDGM volumes are associated with poorer cognitive performance is in keeping with previously reported studies in pwMS.5–8 The results for the nTTG volume, which was associated with WASI Full Scale IQ, WASI performance IQ, memory and executive function, are more novel. Interestingly, a recent study has reported similar results in patients recently diagnosed with relapsing–remitting multiple sclerosis (RRMS): lower nTTG volume was associated with poorer cognitive performance using the Brief Repeatable Battery of Neuropsychological Tests (BRBN). 30 Similar results have been reported in patients with Alzheimer’s disease (AD) or mild cognitive impairment. 31 These findings may relate to the location of the primary auditory cortex within the TTG, and its role in attention and learning from auditory cues. 30,32
The longitudinal changes in predictor variables, including change in sNfL, were not independently associated with cognitive performance, beyond the variance accounted for by baseline predictors. This may in part reflect the hypothesis that clinical progression, such as cognitive decline, is primed by earlier neuroinflammation. 33 Baseline sNfL, representing recent inflammatory-mediated neuro-axonal injury, may therefore be associated with the future decline in cognition via the precipitated neurodegenerative mechanisms. Subsequent change in sNfL levels, however, may not be associated with concomitant changes in cognitive performance as a delay is required before the precipitated clinical progression becomes apparent. This is analogous to an inverse of the therapeutic lag which is frequently seen with anti-inflammatory DMTs. 34 Studies with longer clinical follow-up would be required to confirm whether early changes in sNfL are associated with future changes in cognition, independent of baseline sNfL.
The participant excluded in the sensitivity analysis warrants discussion. The markedly elevated baseline sNfL (116 pg/mL), together with the slow baseline 25-foot walk, both of which subsequently improved during follow-up, suggests inflammatory disease activity was present at baseline. While recent relapse was an exclusion criterion for the MS-STAT trial, we speculate that this participant may have been experiencing an undiagnosed spinal cord relapse at baseline, causing high sNfL and poor lower limb function, but relative sparing of future cognitive performance. Future studies should assess whether sNfL is a stronger prognostic factor for cognition in clinically stable patients, rather than in those experiencing a relapse.
The neuropsychological battery used in the original MS-STAT trial was specifically chosen to ensure as broad a coverage of cognitive domains as would be possible. To do so, we applied tests widely used in the study of acquired neurological disorders associated with cognitive impairment, notably the neurodegenerative diseases. The aim was to reduce the risk that some aspects of cognition may be impaired in SPMS that are not captured by other cognitive batteries, such as Brief International Cognitive Assessment for MS (BICAMS), BRBN and Minimal Assessment of Cognitive Function in MS (MACFIMS). All of these tests are shorter and less comprehensive than our test battery, and this reflects the rationale for their usage – namely to provide a brief cognitive assessment in MS. 2 For this current analysis, we then made the a priori decision to use WASI Full Scale IQ as the primary outcome, with all other cognitive measures performed in the MS-STAT trial as secondary outcomes. The WASI Full Scale IQ represents a broad measure of overall cognitive performance, based on four subtests (Table 1). 35 It is widely used in dementia research where, for example, it has been validated as a cross-sectional and longitudinal measure of cognition in AD or in mixed neurological cohorts.36–38 Interestingly, similar to our findings, higher sNfL was associated with greater estimated change in WASI Full Scale IQ in autosomal dominant AD and also associated with poorer WASI similarities performance in frontotemporal dementia.39,40 The BIRT memory battery has also been validated against the histological severity of hippocampal sclerosis in temporal lobe epilepsy and is sensitive to decline following anterior temporal lobe resection.41,42 While the WASI and BIRT are not commonly used in MS research, previous work has found that lower WASI Full Scale IQ was associated with slower walking speed and higher risk of falls in a cohort of 78 pwMS and baseline WASI performance has been reported in a randomised controlled trial of cognitive rehabilitation for pwMS.43,44
In summary, we felt that the requirement for more comprehensive cognitive outcome measures was warranted given the aim and hypotheses of the original MS-STAT interventional trial. This has then allowed us to examine the relationships between these detailed cognitive outcomes and the sNfL and MRI predictors included in this analysis. We do accept that our measures are not currently widely used in the MS field and would propose that future work aim to compare the effect size of these study tests with those of BICAMS/MACFIMS/BRBN in predicting cognitive dysfunction.
A further point to note on the WASI was that the degree of cognitive impairment (defined as Z-score < −1.5) in this cohort was low (Table 2). This is consistent with previous data using the WASI in a mixed cohort of pwMS, which also found that few participants were defined as cognitively impaired. 44 An established weakness of using definitions of cognitive impairment based on normative data, however, is that patients may experience an important decline in cognitive function, but still not meet the required threshold to be deemed cognitively impaired. 2 A previous study found that pwMS had significantly poorer performance compared to healthy controls on the Wechsler Adult Intelligence Scale (which is closely related to the WASI), despite T-scores apparently still within the normal range. 45 While few of our participants were cross-sectionally defined as cognitively impaired on the WASI, our use of longitudinal repeated assessments is therefore preferable for assessing cognitive decline. Procedural learning effects are known to be relevant for components of the WASI and would be expected to result in improved participant performance on repeat assessments. 46 Despite this, 44% of participants declined on the WASI Full Scale IQ during the trial, similar to the number who declined on the PASAT (42%).
The treatment of cognition is a research priority for the MS community. Our group-level analysis, however, cannot be used to determine an individual patients’ risk. Randomised controlled trial data support the ability of immunosuppressive DMTs to both suppress sNfL levels and delay cognitive decline.4,47 Further research is required to determine whether elevated sNfL may be useful in identifying patients that may benefit most from such DMT in terms of future cognitive outcomes.
In conclusion, our results demonstrate that in PwSPMS, elevated baseline sNfL was independently associated with a faster future rate of decline in WASI Full Scale IQ. In contrast, normalised regional brain volumes were frequently associated with poorer current cognitive performance. Future research should aim to assess whether elevated sNfL can identify PwSPMS that may benefit most from interventions aimed at slowing cognitive decline.
Supplemental Material
sj-docx-1-msj-10.1177_13524585221114441 – Supplemental material for Serum neurofilament light and MRI predictors of cognitive decline in patients with secondary progressive multiple sclerosis: Analysis from the MS-STAT randomised controlled trial
Supplemental material, sj-docx-1-msj-10.1177_13524585221114441 for Serum neurofilament light and MRI predictors of cognitive decline in patients with secondary progressive multiple sclerosis: Analysis from the MS-STAT randomised controlled trial by Thomas Williams, Carmen Tur, Arman Eshaghi, Anisha Doshi, Dennis Chan, Sophie Binks, Henny Wellington, Amanda Heslegrave, Henrik Zetterberg and Jeremy Chataway in Multiple Sclerosis Journal
Supplemental Material
sj-pdf-2-msj-10.1177_13524585221114441 – Supplemental material for Serum neurofilament light and MRI predictors of cognitive decline in patients with secondary progressive multiple sclerosis: Analysis from the MS-STAT randomised controlled trial
Supplemental material, sj-pdf-2-msj-10.1177_13524585221114441 for Serum neurofilament light and MRI predictors of cognitive decline in patients with secondary progressive multiple sclerosis: Analysis from the MS-STAT randomised controlled trial by Thomas Williams, Carmen Tur, Arman Eshaghi, Anisha Doshi, Dennis Chan, Sophie Binks, Henny Wellington, Amanda Heslegrave, Henrik Zetterberg and Jeremy Chataway in Multiple Sclerosis Journal
Footnotes
Data Availability Statement
The datasets generated or analysed during the current study are not publicly available due to the patient-identifiable material contained, but fully anonymised datasets are available from the corresponding author on reasonable request.
Declaration of Conflicting Interests
The author(s) declared the following potential conflicts of interest with respect to the research, authorship and/or publication of this article: T.W. is currently funded by the MS-STAT2 trial grant (NCT03387670). This is funded by the NIHR Health Technology Assessment (HTA) Programme, Multiple Sclerosis Society (UK) and the National Multiple Sclerosis Society (US). He has received honorarium for educational talks from Novartis and Merck. C.T. is currently being funded by a Junior Leader La Caixa Fellowship; she has also received the 2021 Merck’s Award for the Investigation in Multiple Sclerosis (Spain) and a grant from Instituto de Salud Carlos III, Spain; PI21/01860; and she has received speaker honoraria from Roche and Novartis. A.E. has no disclosures relevant to the manuscript. A.D. has no disclosures relevant to the manuscript. D.C. is funded by the NIHR, Alzheimer’s Research UK and the Wellcome; he has been on scientific advisory boards for Roche and Biogen. S.B. is supported by the Wellcome Trust and has had salary support from the National Institute for Health Research (NIHR); S.B. is a co-applicant on a patent application entitled ‘Diagnostic Strategy to improve specificity of CASPR2 antibody detection’ (TBA/BB Ref. JA94536P.GBA). H.W. has no disclosures relevant to the manuscript. A.H. has no disclosures relevant to the manuscript. H.Z. is a Wallenberg Scholar supported by grants from the Swedish Research Council (#2018-02532), the European Research Council (#681712 and #101053962), Swedish State Support for Clinical Research (#ALFGBG-71320), the Alzheimer Drug Discovery Foundation (ADDF), USA (#201809-2016862), the AD Strategic Fund and the Alzheimer’s Association (#ADSF-21-831376C, #ADSF-21-831381C and #ADSF-21-831377C), the Olav Thon Foundation, the Erling-Persson Family Foundation, Stiftelsen för Gamla Tjänarinnor, Hjärnfonden, Sweden (#FO2019-0228), the European Union’s Horizon 2020 research and innovation programme under the Marie Skłodowska-Curie Grant No. 860197 (MIRIADE), the European Union Joint Programme – Neurodegenerative Disease Research (JPND2021-00694) and the UK Dementia Research Institute at UCL (UKDRI-1003); he has served at scientific advisory boards and as a consultant for Abbvie, Alector, Annexon, Artery Therapeutics, AZTherapies, CogRx, Denali, Eisai, Nervgen, Novo Nordisk, Pinteon Therapeutics, Red Abbey Labs, Passage Bio, Roche, Samumed, Siemens Healthineers, Triplet Therapeutics and Wave, has given lectures in symposia sponsored by Cellectricon, Fujirebio, Alzecure, Biogen and Roche, and is a co-founder of Brain Biomarker Solutions in Gothenburg AB (BBS), which is a part of the GU Ventures Incubator Program (outside submitted work). J.C. has received support from the Efficacy and Mechanism Evaluation Programme and Health Technology Assessment Programme (NIHR); UK Multiple Sclerosis Society and National Multiple Sclerosis Society. In the last 3 years, he has been a local principal investigator for trials in multiple sclerosis funded by Receptos, Novartis and Biogen Idec, and has received an investigator grant from Novartis outside this work. He has taken part in Advisory Boards/consultancy for Roche, Merck, MedDay, Biogen and Celgene.
Funding
The author(s) disclosed receipt of the following financial support for the research, authorship and/or publication of this article: No specific funding was received for this research. T.W. is currently funded by the MS-STAT2 trial grant (NCT03387670). This is funded by the NIHR Health Technology Assessment (HTA) Programme, Multiple Sclerosis Society (UK) and the National Multiple Sclerosis Society (US).
Supplemental Material
Supplemental material for this article is available online.
References
Supplementary Material
Please find the following supplemental material available below.
For Open Access articles published under a Creative Commons License, all supplemental material carries the same license as the article it is associated with.
For non-Open Access articles published, all supplemental material carries a non-exclusive license, and permission requests for re-use of supplemental material or any part of supplemental material shall be sent directly to the copyright owner as specified in the copyright notice associated with the article.