
Abstract
Background:
In the trial of Minocycline in Clinically Isolated Syndrome (MinoCIS), minocycline significantly reduced the risk of conversion to clinically definite multiple sclerosis (CDMS). Neurofilament light chain (NfL) and glial fibrillary acidic protein (GFAP) are emerging biomarkers in MS, and minocycline modulates matrix metalloproteinases (MMPs).
Objective:
To assess the value of blood NfL and GFAP as a biomarker of baseline and future disease activity and its utility to monitor treatment response in minocycline-treated patients with clinically isolated syndrome (CIS).
Methods:
We measured NfL, GFAP, and MMPs in blood samples from 96 patients with CIS from the MinoCIS study and compared biomarkers with clinical and radiologic characteristics and outcome.
Results:
At baseline, NfL levels correlated with T2 lesion load and number of gadolinium-enhancing lesions. Baseline NfL levels predicted conversion into CDMS at month 6. GFAP levels at baseline were correlated with T2 lesion volume. Minocycline treatment significantly increased NfL levels at 3 months but not at 6 months, and decreased GFAP levels at month 6. Minocycline decreased MMP-7 concentrations at month 1.
Discussion:
Blood NfL levels are associated with measures of disease activity in CIS and have prognostic value. Minocycline increased NfL levels at month 3, but reduced GFAP and MMP-7 levels.
Introduction
Multiple sclerosis (MS) is a chronic inflammatory and degenerative disease of the central nervous system (CNS). In the majority of cases, MS is preceded by a clinically isolated syndrome (CIS), the first clinical episode suggestive of MS. People with CIS have a variable risk of developing MS, depending on features such as age, lesion burden, or oligoclonal band status in the cerebrospinal fluid. 1 Current diagnostic criteria enable MS to be diagnosed soon after presentation, and disease-modifying therapies (DMTs) delay the development of MS from CIS. 1
In the trial of Minocycline in Clinically Isolated Syndrome (MinoCIS), 142 participants were randomized to receive minocycline 100 mg BID or placebo, with a primary outcome of conversion to MS within 6 months after randomization. 2 Minocycline significantly reduced the risk of conversion to MS by 54%. The precise mechanism of action of minocycline is unknown, but it modifies immune cell functioning and inhibits matrix metalloproteinases (MMPs), important extracellular proteases that participate in tissue remodeling and blood brain barrier disruption. 3
Levels of neurofilament light (NfL) chain in the serum is a proposed biomarker of neuroaxonal damage. 4 Elevation of NfL correlates with relapses and appearance of new active lesions on magnetic resonance imaging (MRI), and it is reduced after the initiation of DMTs in relapsing-remitting multiple sclerosis (RRMS).4,5 This suggests that NfL in the serum may be a promising biomarker of disease activity and treatment response. Furthermore, baseline NfL levels in people with CIS correlate with lesion burden and predict future development of brain atrophy and Expanded Disability Scoring Scale (EDSS) worsening 5–15 years later.6–9 Glial fibrillary acidic protein (GFAP) is a protein in astrocytes. Its level in the serum may reflect astrocyte activation that accompanies CNS injury, and blood GFAP levels are reported to correlate with disability, relapses, and MRI activity in RRMS.10,11
We hypothesized that serum NfL, GFAP, and MMP levels would decrease over time after minocycline treatment. We tested this hypothesis by comparing the longitudinal trajectories of NfL, GFAP, and MMPs in minocycline or placebo-treated patients with CIS. We then evaluated the potential of NfL, GFAP, or MMPs at baseline to predict future disease activity.
Methods
Cohort
Patients were from the MinoCIS study, a randomized placebo-controlled trial. 2 In the study, baseline and serial blood samples were obtained and stored at −80 degrees Celsius. The trial included untreated people between the ages of 18–60 years with CIS who presented during the period from January 2009 to July 2013 with their first demyelinating symptom within the previous 180 days, and classified as CIS according to the then applicable McDonald 2005 criteria. 12 Participants also had at least two lesions larger than 3 mm in diameter on T2-weighted MRI of the brain (one lesion had to be ovoid, periventricular, or infratentorial). Participants were randomized to receive either 100 mg of minocycline BID or placebo. The primary outcome was conversion to MS, according to 2005 McDonald criteria, within 6 months after randomization. Clinical data such as EDSS and MRIs were available at baseline and at different time points in the trial. This biomedical study was designed and analyzed these data retrospectively.
Serum NfL and GFAP measurement
Blood was collected at baseline, after 1, 3, and 6 months, and centrifuged at 1800g for 10 minutes at room temperature. Serum and plasma was aliquoted and stored at −80°C until analysis. Serum NfL and GFAP quantification was performed using Simoa assays (NfL kit and GFAP discovery kit run on HD-X; Quanterix (Lexington, MA, USA)). The samples of each individual patient were analyzed within one run, and the personnel performing the analyses was blinded for the clinical data. For technical reasons, NfL and GFAP were unmeasurable in serum samples from two participants (one in each group).
MMPs
MMPs were measured at baseline and at 1 month of follow-up. Plasma MMP analyses were performed by Eve Technologies (Calgary, Canada) with the Human MMP 9-MultiPlex, TIMP 4 MultiPlex Discovery Assay, a commercially available bead-based multiplex platform that measures MMP-1, MMP-2, MMP-3, MMP-8, MMP-9, MMP-10, MMP-12, MMP-13, TIMP-1, TIMP-2, TIMP-3, and TIMP-4. The details of the multiplex method and limits of detection of this assay are available online (https://www.evetechnologies.com).
MRI
A baseline cranial MRI (proton density; T2-weighted; fluid-attenuated inversion recovery; axial T1-weighted images before and after gadolinium (Gad) enhancement (0.1 mmol per kilogram of body weight)) was obtained in accordance with standardized reproducible imaging protocols. Lesion volume at baseline was determined using a semiautomatic method as described previously. 13 Follow-up MRI scans were performed at regular intervals and evaluated by experienced MR radiologists for inflammatory activity, defined as new T2 lesions or Gad-enhancing lesions.
Demographic, clinical, and radiologic characteristics related to NfL, GFAP, and MMPs
The analysis for correlation between variables was performed with Spearman’s rank correlation coefficient, and the results were plotted in correlation matrices. In the case of MMPs, where the analyses involved multiple comparisons, we applied the false discovery rate (FDR) method to correct p-values. We then investigated the association between baseline NfL/GFAP levels and selected variables using the Kruskal–Wallis test by categorizing into three groups, based on the median NfL/GFAP values in the study population: low, <the median of NfL/GFAP values; high, >twice the median, and mid, > the median but < than twice the median values. The median NfL in the study population was 10.35 pg/mL, and the median GFAP was 60.4 pg/mL.
Prognosis of outcome
To investigate the prognostic potential of the biomarkers on outcome (conversion to clinically definite multiple sclerosis (CDMS) at 6 months), baseline age, sex, disease onset <90 days, EDSS, T2 lesion volume, presence or absence of Gad+ lesions, and baseline NfL/GFAP and MMPs were explored using the univariate Mann–Whitney test. Significant variables were then included in a multivariate binary logistic regression model with outcome as the dependent variable. The underlying assumptions of the binary logistic regression models were acceptable in the obtained plots.
Longitudinal change of NfL, GFAP, and MMPs
For analysis of treatment effects, all available longitudinal paired samples from patients who had completed the trial were included. Paired tests of significance were analyzed using the Wilcoxon Signed-Rank or Friedman test, depending on the number of time points. Then, a treatment effect of minocycline on NfL and GFAP versus placebo was analyzed using a mixed model for repeated measurements with NfL and GFAP from month 1 to month 6 as the response variables and with adjustments for treatment and other potential explanatory variables (found to be significant in univariate analysis). Baseline NfL and GFAP levels were included as independent variables. An unstructured covariance matrix was used. Model assumptions were checked in regression diagnostic plots and deemed acceptable. The estimated treatment effects across all follow-up visits are presented. Another model included visit-by-treatment and visit-by-NfL or GFAP interactions, but results did not differ significantly. Adding variables such as age, sex, EDSS, or disease onset <90 days did not change the results of the model.
Analysis and descriptive statistics
Statistical analyses were performed using the Statistical Package for Social Sciences (SPSS 25.0, Chicago, IL, USA) and GraphPad PRISM (PRISM 9.0, GraphPad Software, San Diego, CA, USA). Since most of the biomarker data were not normally distributed, median and interquartile range (IQR) was used to describe the data, unless specified otherwise. Clinical and demographic characteristics were described with mean value ± standard deviation (SD) or as mean values (range) depending on the distribution.
Standard protocol approvals, registrations, and patient consents
This study received approval from the local ethics committee on human experimentation. All patients provided written informed consent.
Data availability
The raw data can be obtained upon reasonable request by contacting the corresponding author. However, we have no consent to share participant level clinical data.
Results
Patient characteristics
Ninety-six participants in the MinoCIS trial whose blood samples were available for analysis were studied, which represents 68% of the trial population. Of these, 49 were in the minocycline group and 47 in the placebo group. The remainder participants did not provide blood samples for biomedical studies separate from the original trial. Age, EDSS, T2 lesion load, or Gad-enhancing lesions at baseline were similar between these two groups (Table 1). This cohort did not differ in any of these characteristics from the overall population in the original trial (not shown). At 6 months, 32.7% of the patients in the minocycline group had converted to CDMS versus 51.1% in the placebo-treated group. Significance was not tested as this cohort would not meet the power requirements as in the original trial.
Cohort characteristics at baseline.
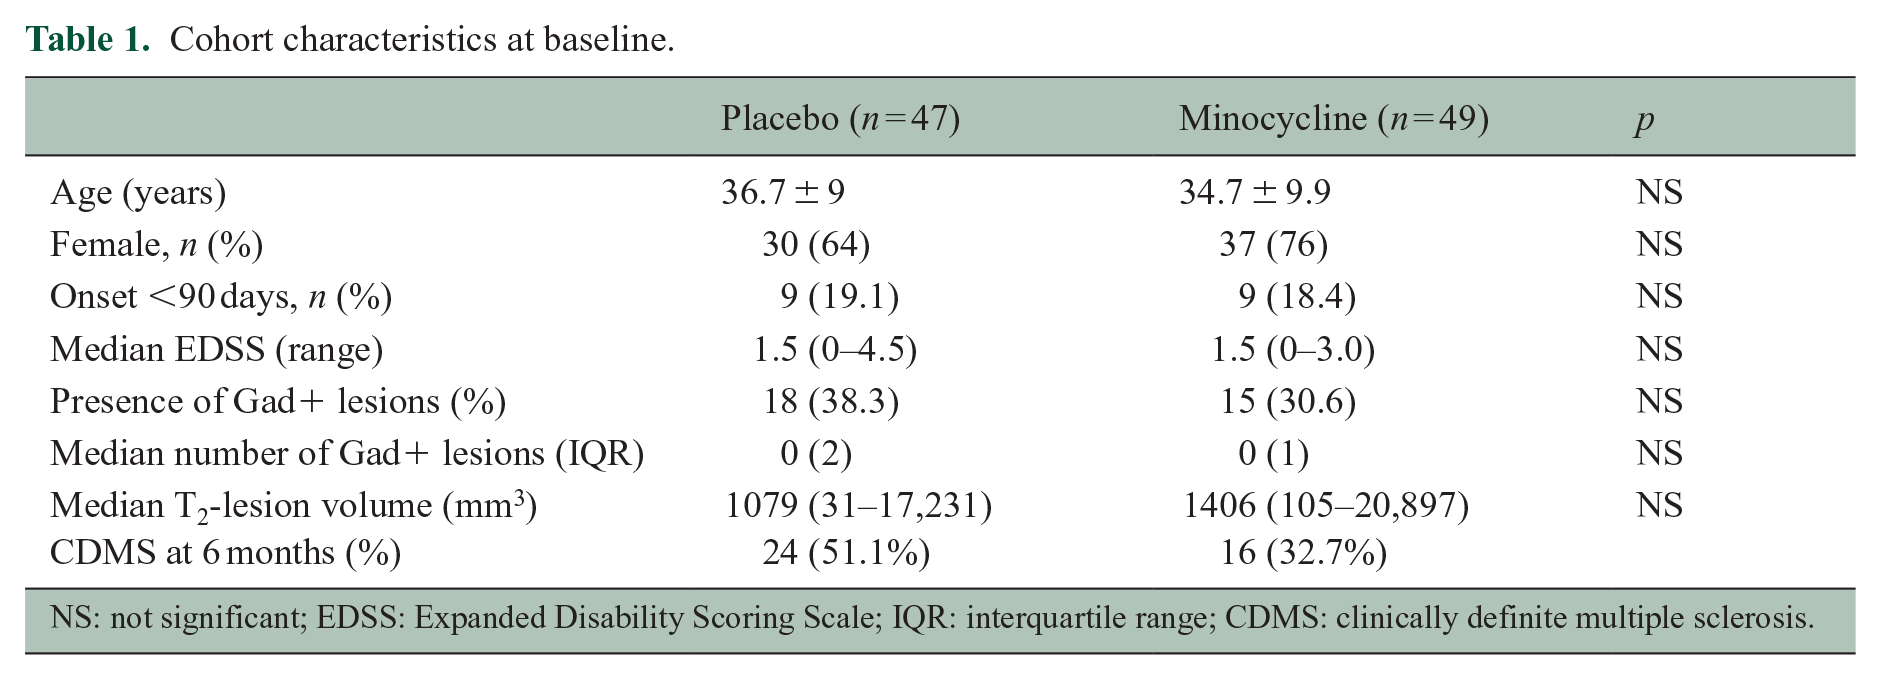
NS: not significant; EDSS: Expanded Disability Scoring Scale; IQR: interquartile range; CDMS: clinically definite multiple sclerosis.
NfL as a predictor of conversion to CDMS and associations with clinic-radiological variables
At baseline, NfL was significantly and positively correlated with T2 lesion volume (r = 0.48, 95% confidence interval (CI) = 0.31–0.63, p < 0.001), number of Gad-enhancing lesions (r = 0.37, 95% CI = 0.17–0.54, p < 0.001), and baseline GFAP concentrations (r = 0.31, 95% CI = 0.11–0.49, p = 0.002), but not with EDSS or age (Figure 1(a)). Furthermore, NfL concentrations were higher in those with disease onset <90 days (median = 11.91 (14.42) vs 7.72 (7.3), p = 0.028). NfL at baseline was significantly higher in those who converted to CDMS at month 6, independently of treatment arm (Figure 2(c)). There was, however, significant overlap among groups. Other significant variables associated with outcome were baseline T2 lesion volume and presence of Gad-enhancing lesions (Figure 2(a) and (b)). In a logistic regression model that included baseline NfL, T2 lesion volume, and presence/absence of Gad-enhancing lesions, only the presence of Gad-enhancing lesions was independently predictive of outcome (odds ratio (OR) = 7.39 (95% CI = 2.65–20.6), p = 0.02).
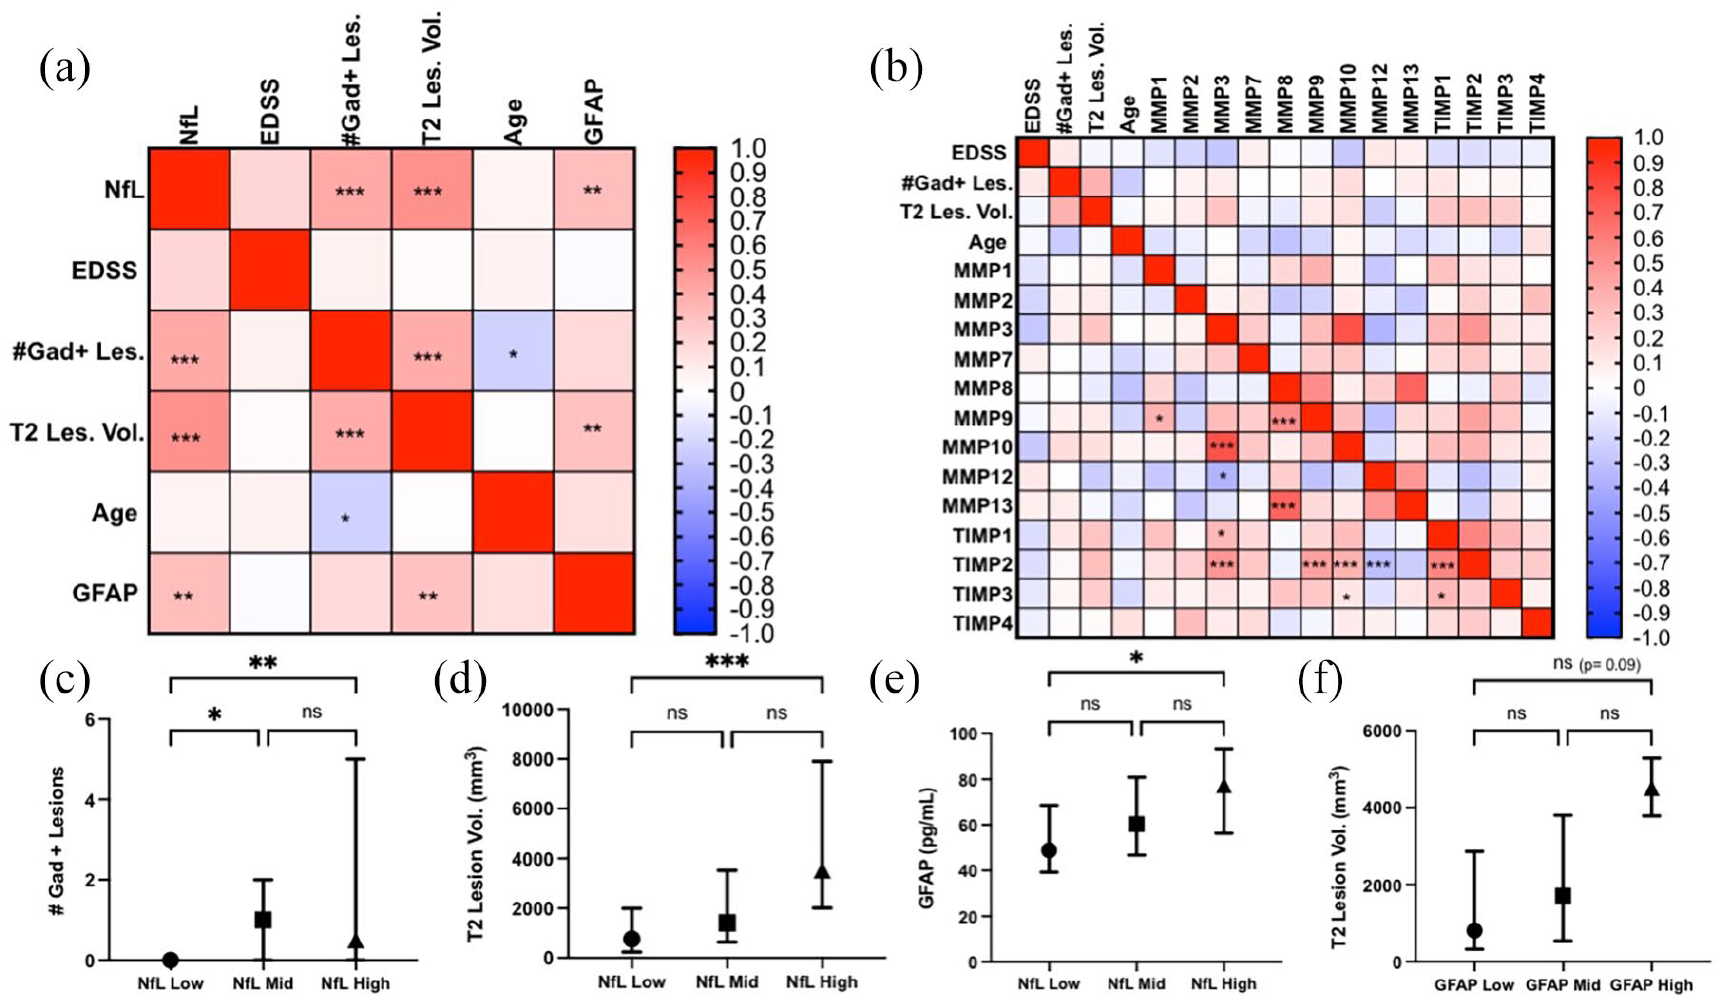
Correlation matrix plots of NfL/GFAP (a) and MMP (b) concentrations and clinical/radiological variables. The heatmaps indicate the Spearman r value, where red is a positive correlation and blue is a negative correlation. Associations between baseline NfL and Gad+ lesions (c), T2 lesion volume (d), and GFAP (e). Association between baseline GFAP and T2 lesion volume (f). The dots represent the medians and the error lines represent the IQR. Significance levels for MMPs are corrected with the false discovery rate method.
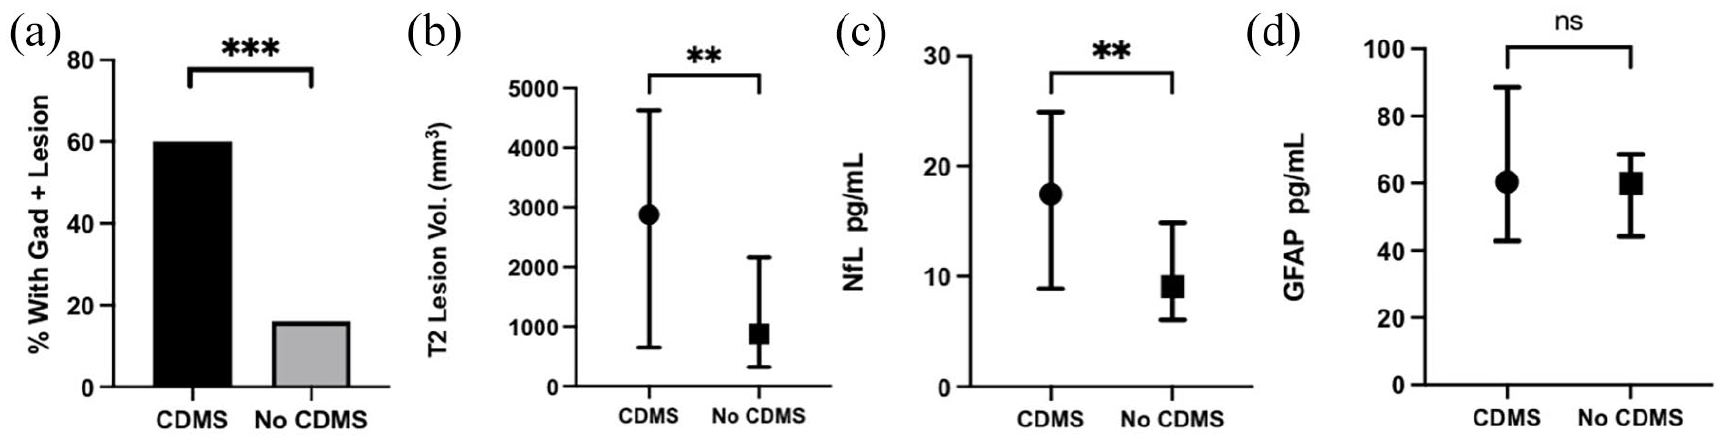
Association between outcome and baseline Gad+ lesions (a), T2 lesion volume (b), NfL (c), and GFAP (d).
Longitudinal dynamics of serum NfL levels
Baseline NfL concentrations were similar in both minocycline and placebo–treated groups (Table 2). Median NfL increased from 10.4 (13.5) pg/mL at baseline to 24.6 (18.4) pg/mL at month 1 (+136.5%), 31.6 (23.7) pg/mL at month 3 (+203.8% vs baseline), and then dropped to 23 (18.1) pg/mL at month 6 (+121.2% vs baseline) in the minocycline group. The increase reached statistical significance at month 3, compared to baseline (Figure 3(a)). In the placebo group, NfL concentrations remained stable over the course of the study. In the mixed model including NfL concentrations from month 1 to month 6 as the dependent variable, minocycline treatment group was associated with higher NfL levels (mean treatment effect in % change = +152% (95% CI = 107–206.2), p < 0.001) after adjusting for baseline NfL levels, baseline T2 lesion volume and Gad+ lesion status. Adding age, EDSS or disease onset <90 days into the model added no additional explanatory value.
Baseline NfL/GFAP and longitudinal change compared to baseline.
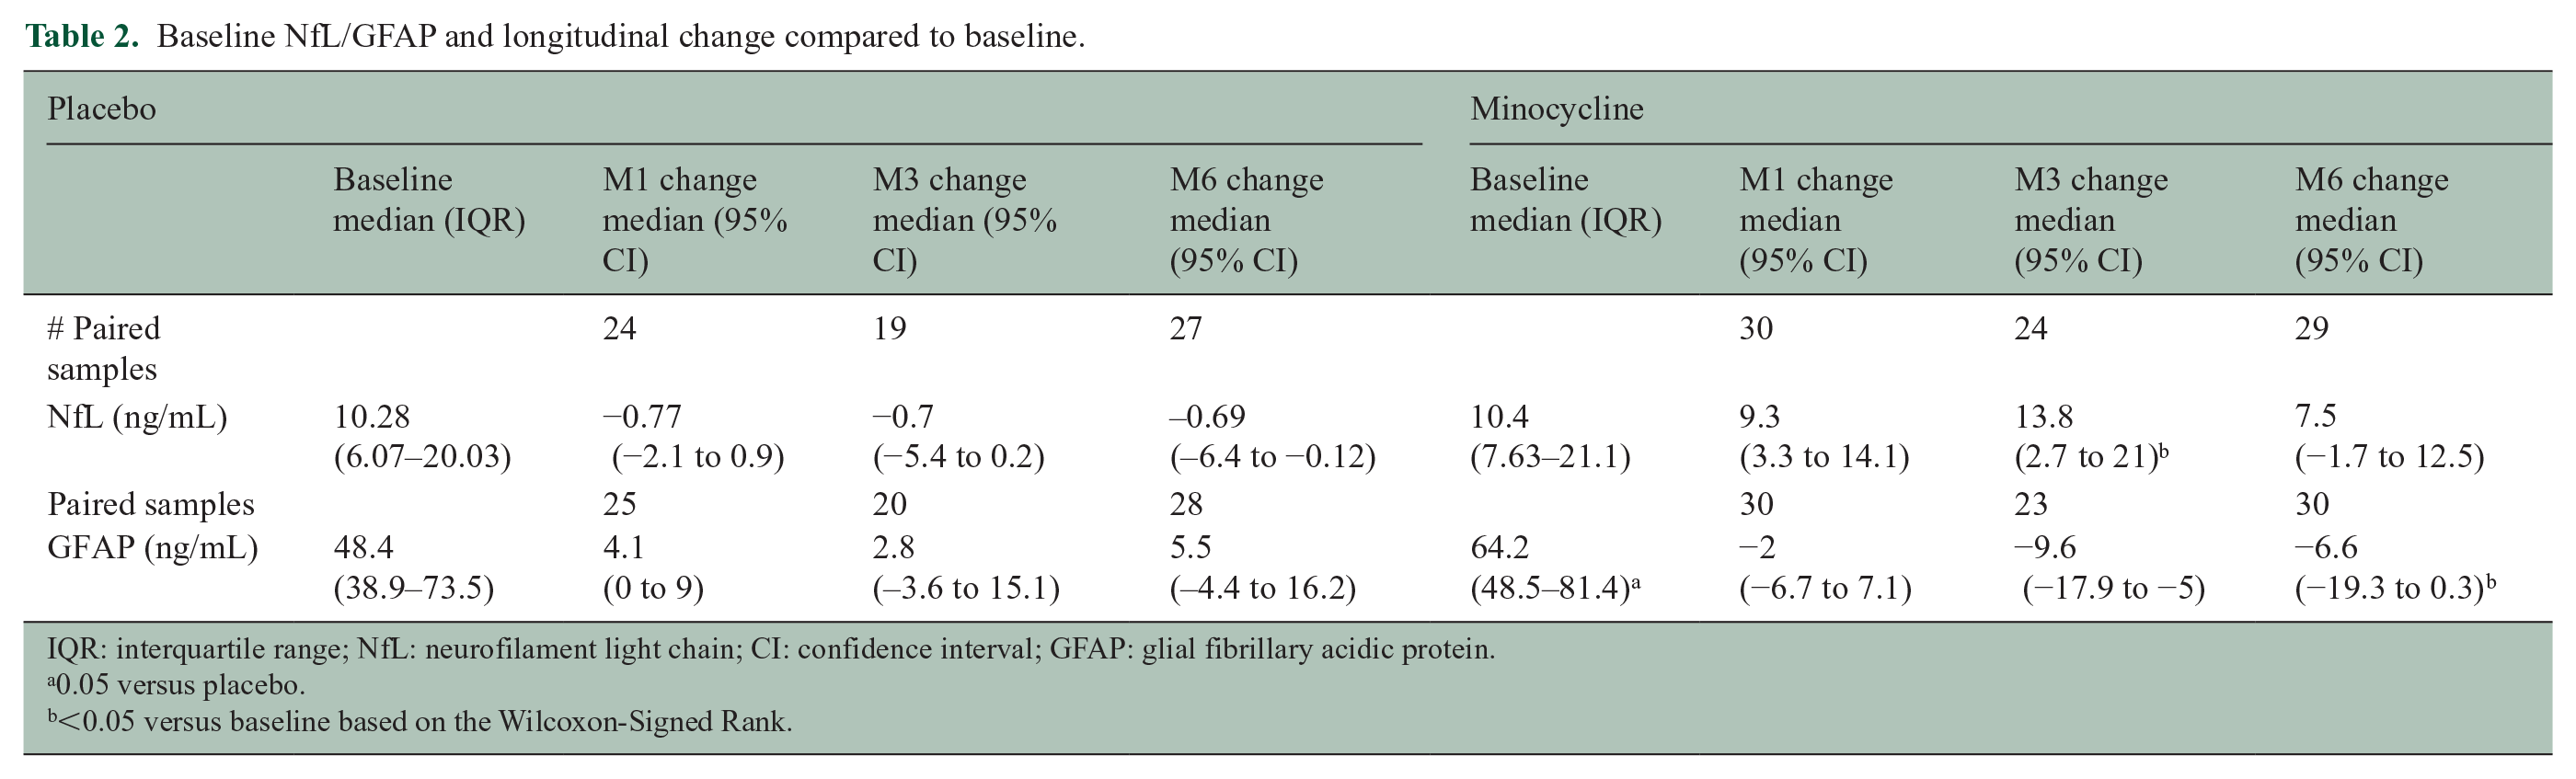
IQR: interquartile range; NfL: neurofilament light chain; CI: confidence interval; GFAP: glial fibrillary acidic protein.
0.05 versus placebo.
<0.05 versus baseline based on the Wilcoxon-Signed Rank.
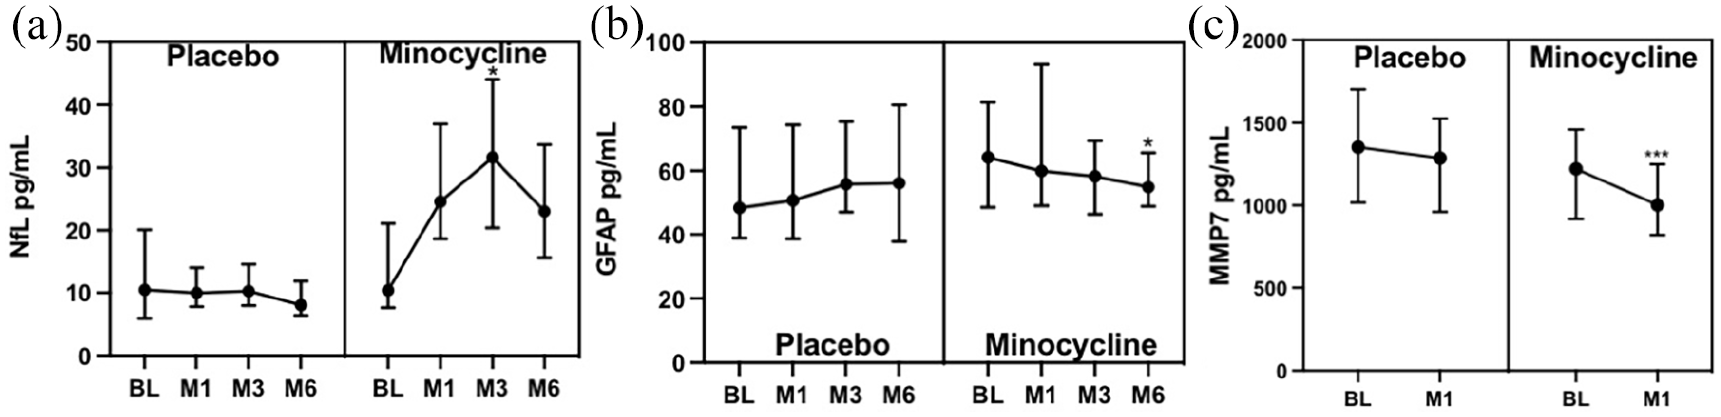
Longitudinal dynamics of NfL (a), GFAP (b), and MMP-7 (c) concentrations. Statistical tests are the Friedman test with the post hoc Wilcoxon test and Bonferroni correction. The dots represent the medians and error bars IQR.
GFAP as a predictor of conversion to CDMS and associations with clinic-radiological variables
At baseline, GFAP was significantly correlated with T2 lesion volume (r = 0.29, 95% CI = 0.09–0.47, p = 0.004) (Figure 1(a)), but not with number of enhancing lesions, EDSS, or age. GFAP concentrations were lower in those with disease onset <90 days (median 58 (33.9) vs 75.8 (42.8), p = 0.033). GFAP at baseline was not different in participants who converted to CDMS at month 6 (Figure 2(d)).
Longitudinal dynamics of serum GFAP levels
Baseline GFAP concentrations were higher in the minocycline group compared to the placebo group (Table 2). Median GFAP decreased from 64.2 (32.9) pg/mL at baseline to 59.9 (44.1) pg/mL at month 1 (−6.7%), 58.3 (67.1) pg/mL at month 3 (−9.2% vs baseline), and 56.15 (16.7) pg/mL at month 6 (−12.5% vs baseline) in the minocycline group. This decrease reached statistical significance at month 6 (Figure 3(b)). In the placebo group, GFAP concentrations remained stable over the course of the study. Treatment was not a significant predictor in the mixed model when adjusting for baseline GFAP, T2 lesion volume, and Gad+ lesion status.
MMPs as a predictor of conversion to CDMS and associations with clinic-radiological variables
None of the MMPs at baseline (Table 3) predicted conversion to CDMS at month 6 (not shown), and they were not correlated with any clinical or radiological variable (Figure 1(b)). Several MMPs were correlated with each other.
Baseline MMPs and change at month 1.
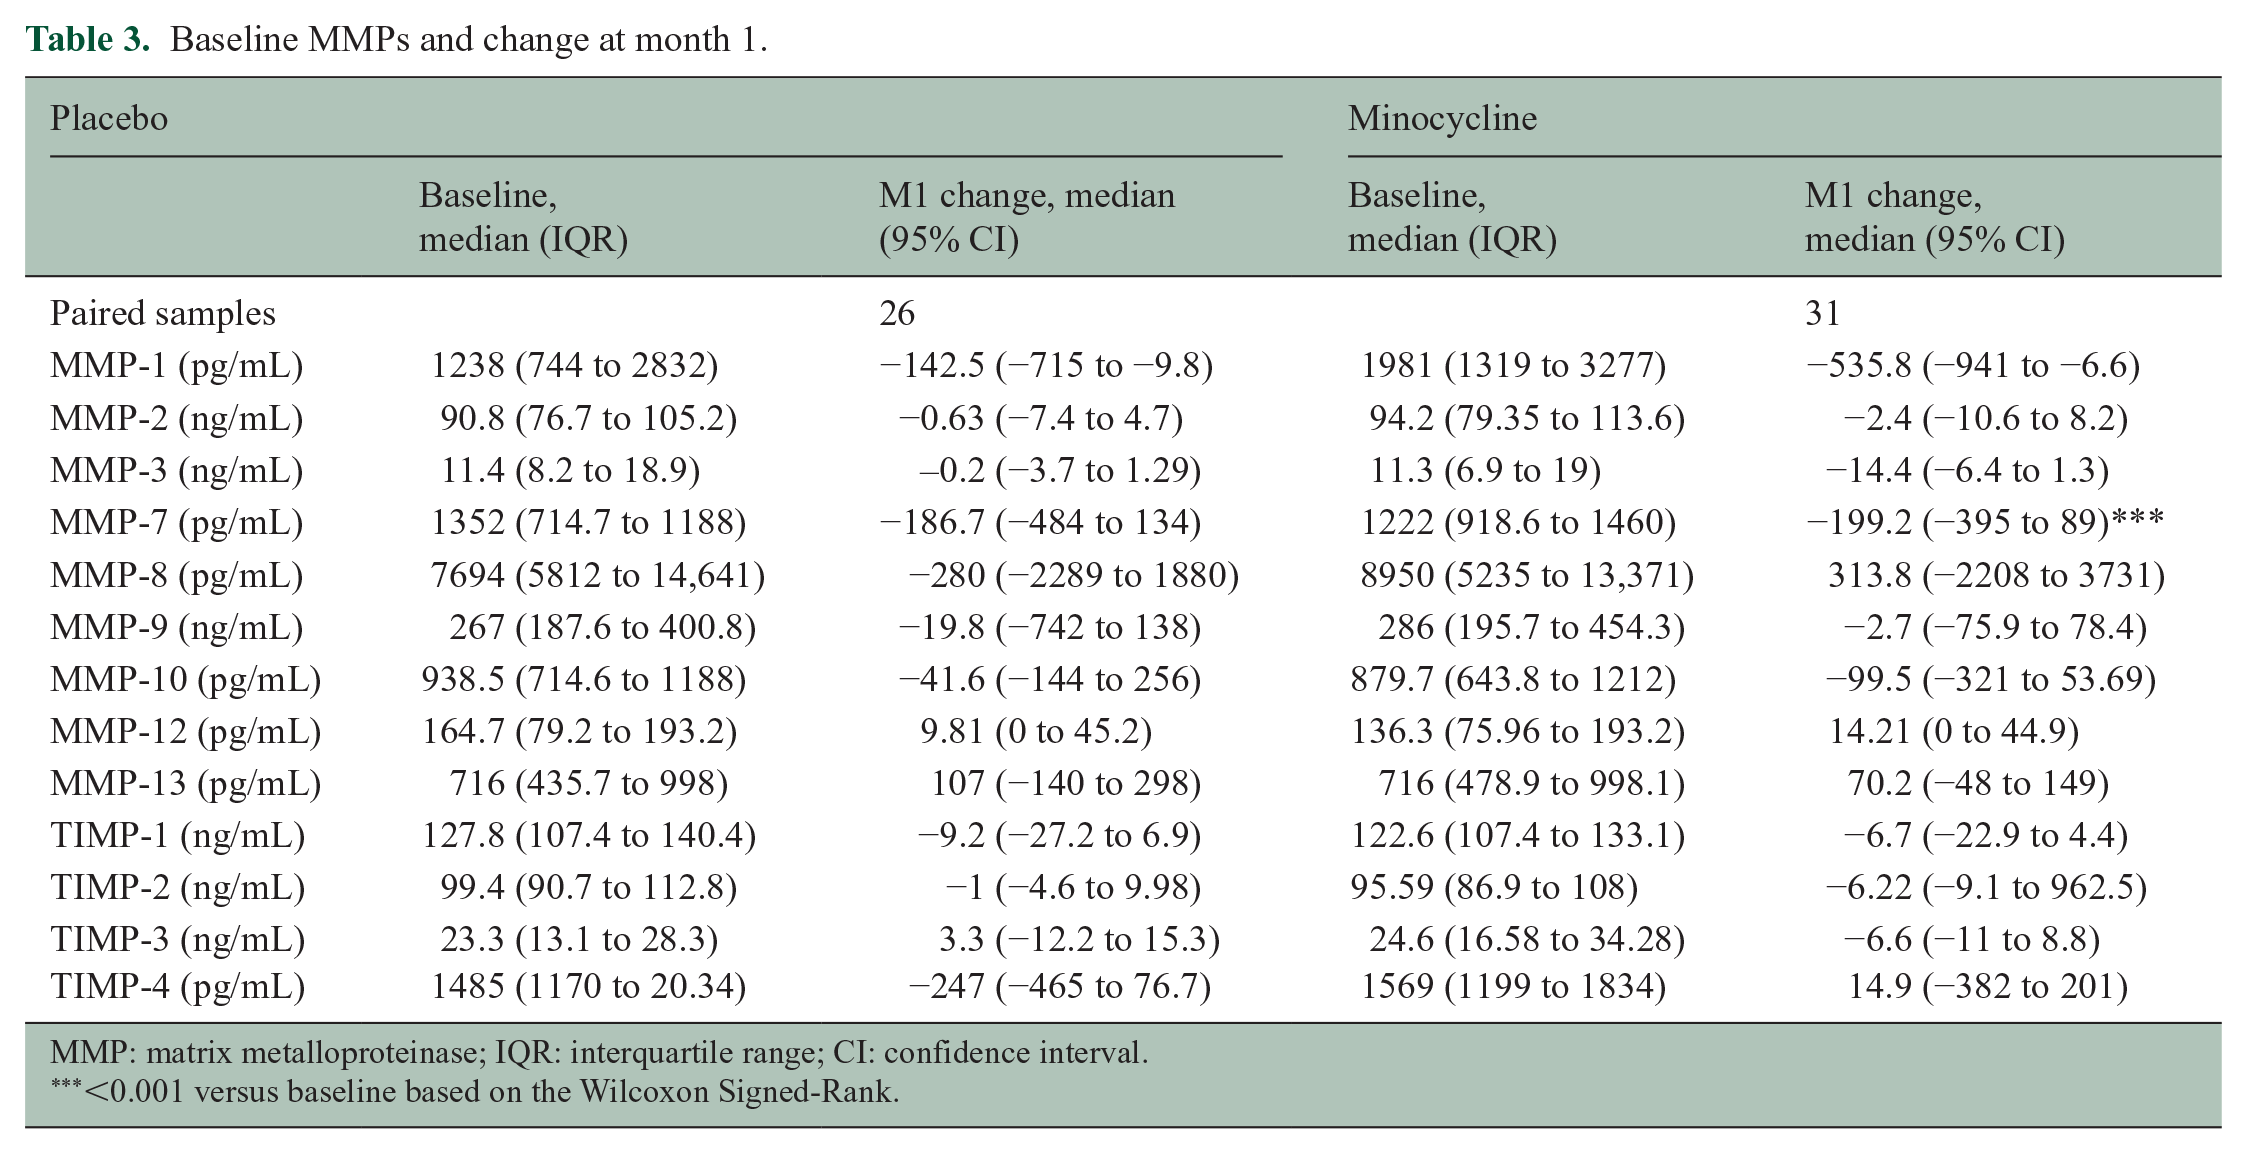
MMP: matrix metalloproteinase; IQR: interquartile range; CI: confidence interval.
<0.001 versus baseline based on the Wilcoxon Signed-Rank.
Longitudinal dynamics of serum MMPs levels
Between baseline and month 1, only MMP-7 concentrations were significantly reduced in the minocycline group, but not the placebo group (Figure 3(c) and Table 3).
Discussion
In this study, we took advantage of stored samples from a randomized placebo-controlled trial to investigate if minocycline modifies serum NfL and GFAP levels and to explore potential mechanisms. Minocycline significantly reduced the concentrations of GFAP and MMP-7. We also found that despite minocycline being effective in reducing conversion to MS, 2 it had paradoxical effects on NfL levels. Baseline NfL levels were correlated with MRI activity at baseline, and was associated with outcome, while GFAP was only modestly correlated with T2 lesion volume, but not with outcome.
In the previous studies, serum GFAP has shown good correlation with clinical and radiological activity in RRMS,10,11 but there are a few studies in CIS. In one study, cerebrospinal fluid (CSF) levels of GFAP were increased in CIS compared to controls, and the levels were higher in those who converted to MS. 14 In another small study, serum GFAP was correlated with T2 lesion load. 15 In this study, baseline serum GFAP was only moderately correlated with MRI lesion load but not with Gad-enhancing lesions. Use of DMTs has also been shown to correlate with lower serum GFAP levels in a pilot study in RRMS. 16 In contrast to NfL, GFAP levels were reduced at 6 months in the minocycline-treated group in this study. GFAP levels showed a trend toward increasing over time in the placebo group, while a reduction in GFAP was seen in the minocycline group despite higher baseline GFAP concentrations. GFAP is a marker of glia activity, and minocycline is known to inhibit astrocyte as well as microglia activity.17,18
The paradoxical increase of NfL in the minocycline-treated group stands in contrast to recent studies showing that decreasing NfL may be a marker of treatment response with DMTs, although most studies have focused on RRMS instead of CIS.4,5 In RRMS, studies have shown an NfL reduction that is proportional to the efficacy of the DMT, sustained over several months, and also dependent on baseline NfL levels.4,5 In a recent small study, initiation of any DMT resulted in decreasing NfL levels after a mean of 12 months in a mixed population of CIS and early RRMS. 9
There are several possible explanations for the NfL unexpected result. First, studies have shown that a reduction in NfL upon DMT initiation is evident after 6 months or longer,4,5 while in our study, the early increase was seen at month 3 and seemed to eventually trend downward. Unfortunately, we did not have access to enough samples at months 12 or beyond to assess this effect. Since there was no evidence of an increase in disability, cranial MRI activity or relapses after minocycline treatment it is unlikely that this increase in NfL reflects measurable neurologic impairment. Interestingly, a previous study in traumatic brain injury found that minocycline treatment increased NfL levels in the short term (3 months), despite an effect in reducing microglial activity, 19 and NfL levels returned to baseline at 6 months. These authors hypothesized that minocycline might have inhibited the normally protective roles of resident CNS microglia activity. 20 Nonetheless, a small study showed a reduction in NfL levels with minocycline treatment after spinal cord injury in patients with a motor complete spinal cord injury. 21 A mild neurotoxic effect of minocycline cannot be ruled-out. For example, NfL increases at 3 months in patients with MS who undergo hematopoietic stem cell transplantation, despite a beneficial effect on disease activity. 22 This is thought to be due to procedure-related neurotoxicity, including the use of chemotherapy. More and longer studies will be needed to resolve this unexpected finding, as our previous results suggest that minocycline reduces clinical and MRI disease activity in early MS.
Baseline NfL was associated with MRI disease activity and was predictive of conversion to MS, although there was some overlap in NfL levels between converters and non-converters. This is similar to what has been observed in several other studies of serum NfL in CIS and RRMS. In particular, the strongest association was between NfL and Gad-enhancing lesions at baseline, supporting the knowledge that acute lesions lead to most pronounced neuroaxonal injury. 23 However, in our study, longitudinal NfL levels in individual patients did not match subsequent disease activity (data not shown), likely due to small sample sizes in addition to paradoxical treatment effects. More data of NfL dynamics in association with disease activity (including understanding NfL clearance) are needed at the individual patient level. Furthermore, age, which has been associated with NfL in the RRMS literature, was not correlated with NfL in our study. Indeed, other studies focusing on CIS have also failed to find an age-NfL correlation. 7 Small sample sizes and a younger and more homogeneous group in CIS compared to other MS phenotypes could explain these results.
MMPs may be pathogenic in MS through disruption of the blood–brain barrier (BBB) and increasing inflammatory cell infiltration into the CNS.3,24 MMP-9 has been shown to be elevated in CIS, and to correlate with lesion burden. 25 Moreover, minocycline is known to inhibit MMP activity, and it is one of the possible mechanisms by which it inhibits inflammatory demyelination.3,18 In our study, MMPs were not correlated with disease activity, but minocycline did significantly decrease the concentrations of MMP-7 as early as 1 month after initiating treatment. MMP-7 is upregulated in active MS lesions 26 and is one of the several proteins present in CSF that correlate to disease severity. 27
A limitation of our study is that we did not study all participants in the original trial, as some patients did not have available serum samples. Furthermore, not all participants had samples available at every time point. However, restricting our analysis to only those participants with samples at all time points did not change our results. Another limitation is the short-term nature of the study so the trajectory of the biomarkers at longer follow-up times (12–24 months) is unknown. Finally, the MMP analysis was done in plasma, and it is unclear if this is reflective of what may be occurring in the CNS in terms of protease activity.
Footnotes
Acknowledgements
The clinical trial Minocycline in Clinically Isolated Syndromes was sponsored by the MS Society of Canada (clinical trials. gov #NCT00666887).
Declaration of Conflicting Interests
The author(s) declared the following potential conflicts of interest with respect to the research, authorship, and/or publication of this article: E.W., C.S., G.C., J.G. and L.M. report no conflict of interest related to this manuscript. C.C.-L. received consulting fees from EMD Serono. J.K. received speaker fees, research support, travel support, and served on advisory boards by the Progressive MS Alliance, Swiss MS Society, Swiss National Research Foundation (320030_189140/1), University of Basel, Biogen, Celgene, Merck, Novartis, Octave Bioscience, Roche, and Sanofi. D.L. is Chief Medical Officer of GeNeuro. D.K.B.L. has received research funding from the Multiple Sclerosis Society of Canada. He is Emeritus Director of the UBC MS/MRI Research Group that has been contracted to perform central analysis of MRI scans for therapeutic trials with Roche and Sanofi-Genzyme. The UBC MS/MRI Research Group has also received grant support for investigator-initiated studies from Genzyme, Novartis, and Roche. He has been a consultant to Vertex Pharmaceuticals and Genzyme, served on the Scientific Advisory Board for Celgene and the PML-MS Steering Committee for Biogen. He has given lectures, supported by non-restricted education grants from Academy of Health Care Learning, Consortium of MS Centers and Sanofi-Genzyme. A. Traboulsee has received research funding from MS Society of Canada, Roche, and Sanofi-Genzyme; received honoraria or travel support from Consortium of MS Centers, Biogen, Teva, Roche, Merck/EMD Serono, and Sanofi-Genzyme. W.Y. has received honoraria from Biogen, EMD Serono, Novartis, Roche, and Sanofi-Genzyme. He is the recipient of unrestricted educational grants from Biogen, EMD Serono, Novartis, Roche, Sanofi-Genzyme, and Teva to support educational activities of the Alberta MS Network, which he directs.
Funding
The author(s) disclosed receipt of the following financial support for the research, authorship, and/or publication of this article: This biomarker research study was supported by funds to the Alberta Multiple Sclerosis Collaboration from the Ministry of Economic Development, Trade and Tourism, and the Ministry of Health of the Government of Alberta.