
Abstract
Background:
Cognitive training elicits mild-to-moderate improvements in cognitive functioning in people with multiple sclerosis (PwMS), although response heterogeneity limits overall effectiveness.
Objective:
To identify patient characteristics associated with response and non-response to cognitive training.
Methods:
Eighty-two PwMS were randomized into a 7-week attention training (n = 58, age = 48.4 ± 10.2 years) or a waiting-list control group (n = 24, age = 48.5 ± 9.4 years). Structural and functional magnetic resonance imaging (MRI) was obtained at baseline and post-intervention. Twenty-one healthy controls (HCs, age = 50.27 ± 10.15 years) were included at baseline. Responders were defined with a reliable change index of 1.64 on at least 2/6 cognitive domains. General linear models and logistic regression were applied.
Results:
Responders (n = 36) and non-responders (n = 22) did not differ on demographics, clinical variables and baseline cognition and structural MRI. However, non-responders exhibited a higher baseline functional connectivity (FC) between the default-mode network (DMN) and the ventral attention network (VAN), compared with responders (p = 0.018) and HCs (p = 0.001). Conversely, responders exhibited no significant baseline differences in FC compared with HCs. Response to cognitive training was predicted by lower DMN-VAN FC (p = 0.004) and DMN-frontoparietal FC (p = 0.029) (Nagelkerke R2 = 0.25).
Conclusion:
An intact pre-intervention FC is associated with cognitive training responsivity in pwMS, suggesting a window of opportunity for successful cognitive interventions.
Keywords
Introduction
Multiple sclerosis (MS) is the most frequent demyelinating, inflammatory and neurodegenerative disease of the central nervous system (CNS) in young adults. Next to the well-known physical symptoms of the disease, cognitive impairment is present in up to 65% of the people with multiple sclerosis (PwMS). 1 Cognitive decline is characterized by a slowed information processing speed, impaired memory function as well as problems with attention and executive function, causing (severe) problems in patient’s daily lives (e.g. unemployment).1,2
Given the prevalence and impact of cognitive dysfunction in PwMS, effective cognitive training strategies are urgently needed. Restorative, non-pharmacologic interventions, especially computerized cognitive training, show potential for improvements in cognitive functioning in PwMS,3,4 although these improvements are at best mild-to-moderate on a group level (effect sizes ranging from 0.06 to 0.23 standardized mean difference). 3
The high variability in individual response to cognitive training (i.e. substantial improvements in some patients and no improvement or even decline in others) limits the overall group effect of restorative interventions. 5 This might hamper our enthusiasm for such interventions, obscuring the fact that for a subset of patients these interventions may be highly beneficial. This introduces a challenge to identify, beforehand, which patients will benefit from such interventions and which patients will not.
So far, only a few exploratory studies have hinted towards specific patient characteristics being beneficial for cognitive training, that is having a high likelihood of successful treatment response. For example, less grey and white matter atrophy, a relapsing-remitting disease course, and higher processing speed were predictive of better response to training,6,7 as were different profiles of default-mode network connectivity. 8
In this study, we investigated the effect of a restorative computerized cognitive training programme (attention training) on cognition in a large sample of PwMS. Next, we compared baseline demographic, clinical and magnetic resonance imaging (MRI) characteristics between responders and non-responders to identify clinical and MRI-based characteristics of response (and non-response).
Materials and methods
This study was approved by the Medical Ethical Committee of the VUmc. Informed consent was obtained prior to participation.
Participants
Eighty-two PwMS were included. Inclusion criteria were: MS diagnosis according to the McDonald criteria, 9 18–68 years of age, and ability to safely undergo an MRI examination. Patients were screened for motor and visual skills to ensure cognitive training participation (Figure 1). Exclusion criteria included drug abuse, neurological and psychiatric diseases, prior cognitive training participation, and relapses or steroid use 4 weeks prior to examination. To assess disease severity, a validated Expanded Disability Status Scale (EDSS)-based questionnaire was used. 10 Patients underwent visual and motor screening to ensure intervention participation. Patients were randomized (by means of computer-generated tables) into an intervention group (n = 58) or a waiting-list control group (n = 24). Treatment allocation was not concealed, and there was no blinding. Twenty-one age-, sex- and education-matched healthy controls (HCs) were included at baseline.
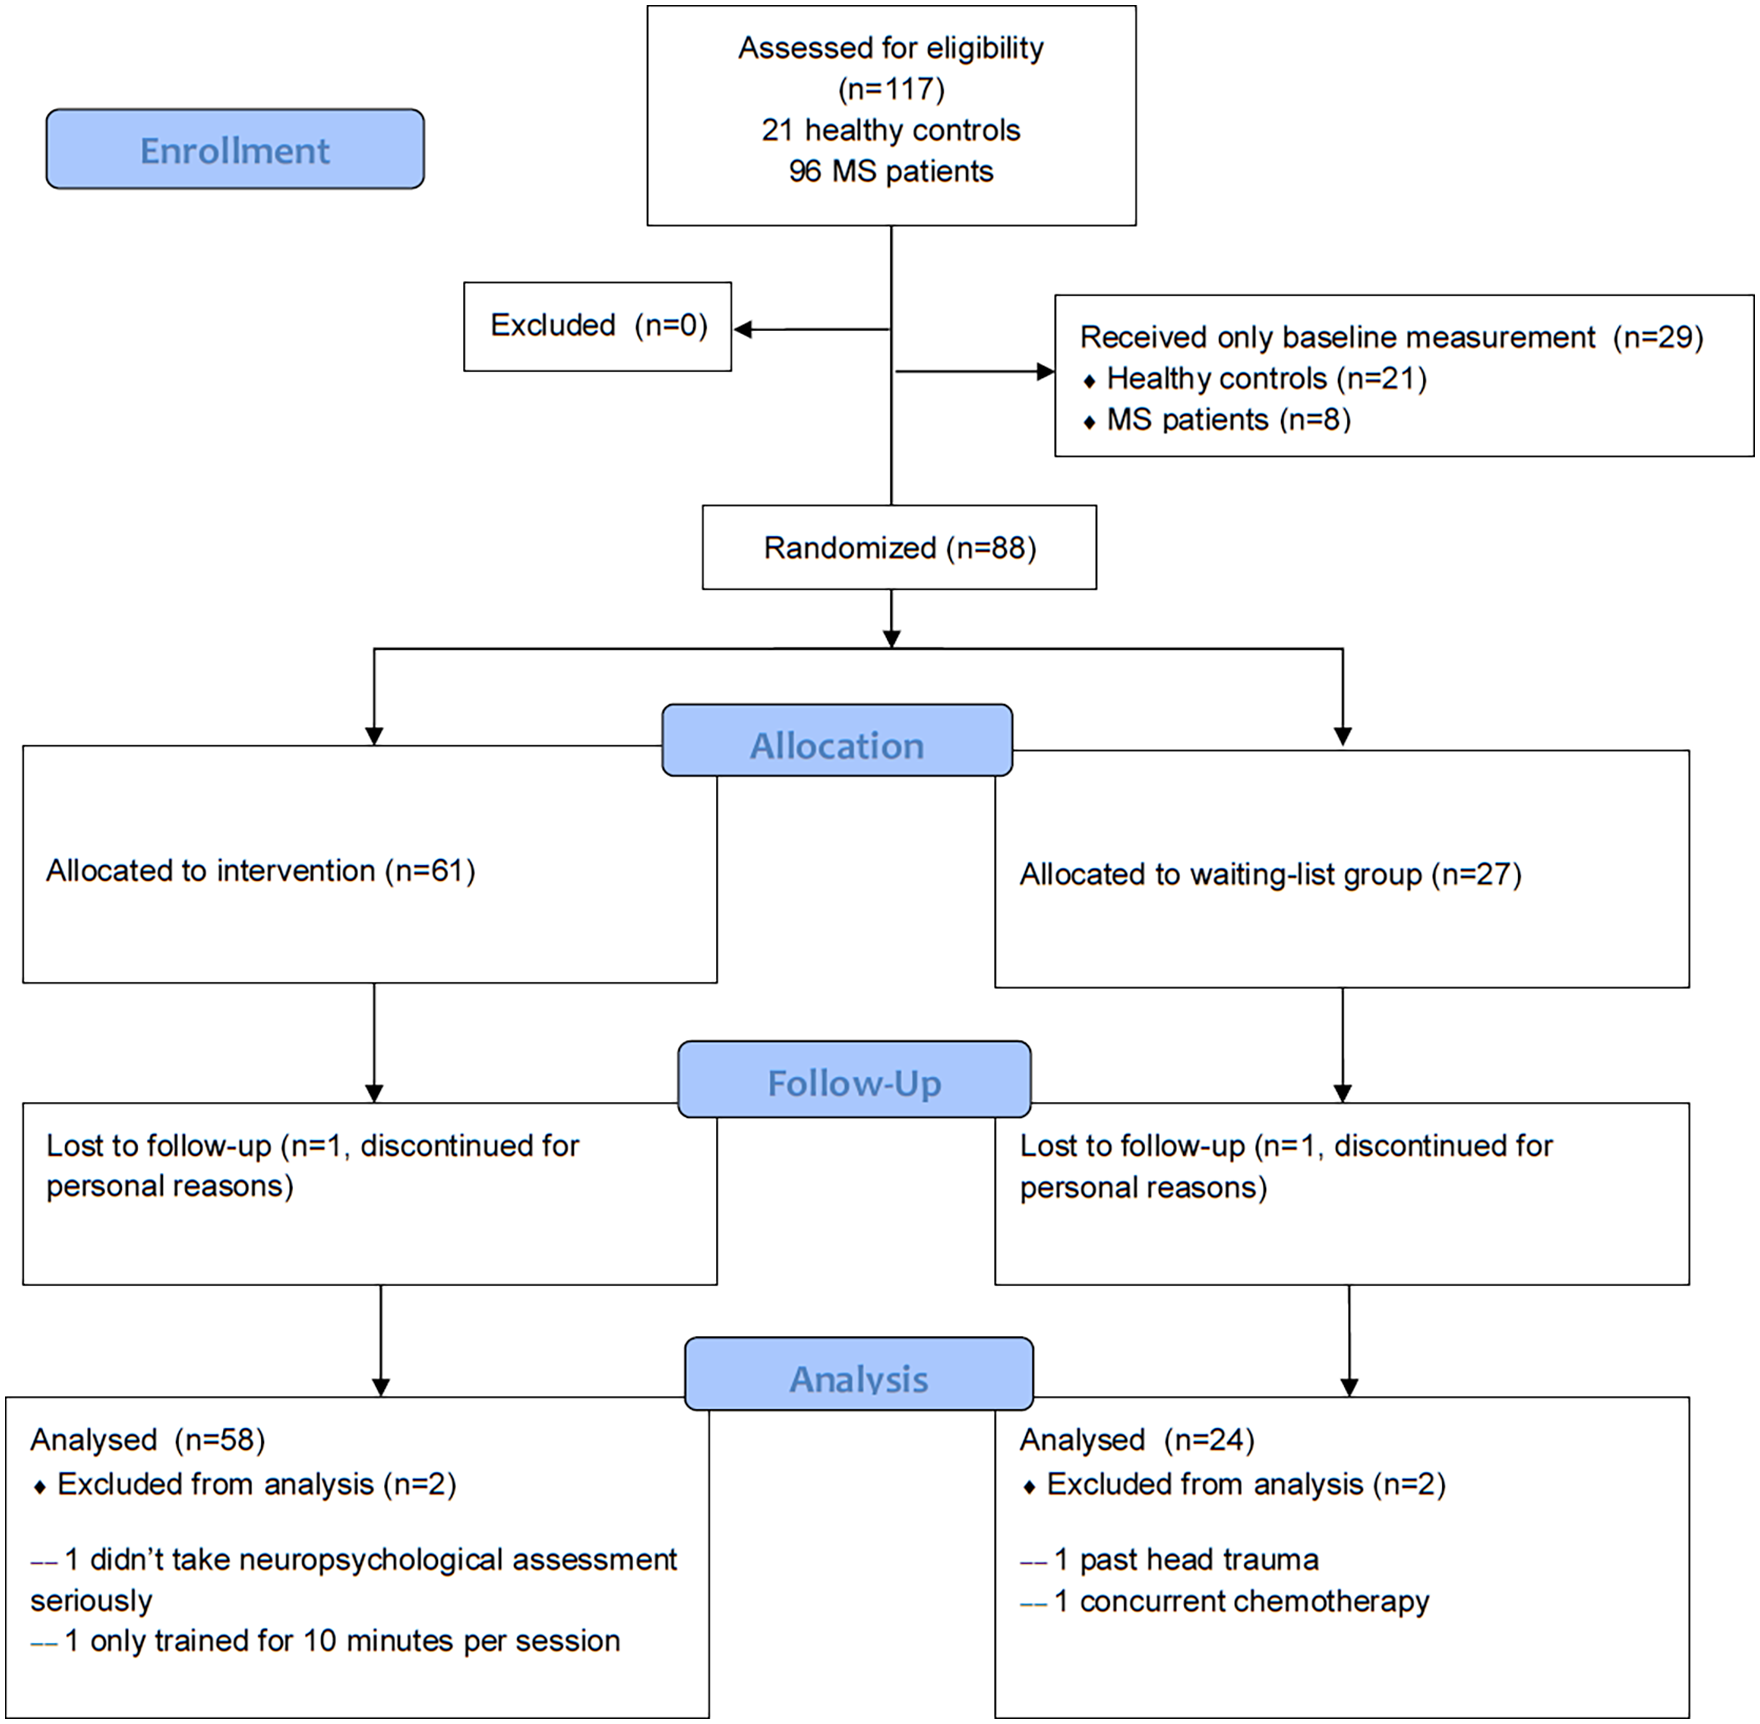
Flow diagram of patient inclusion.
Intervention
The intervention consisted of the C-Car computer programme, previously used in the field of neuro-oncology. 11 C-Car combined with compensatory training has been effective in a similarly sized glioma patient sample. 11 Glioma patients and PwMS exhibit comparable, mostly subtle cognitive impairment. The focus on attention is based on the fact that attention is key for proper functioning in other cognitive domains such as memory and information processing speed. In MS, deficits in attention have been linked to deficits both in working memory and processing speed, 12 making C-Car an interesting programme for this study.
C-Car simulates driving a car, with tasks designed to train sustained, selective, alternating and divided attention. C-Car simulates driving a car while presenting information processing tasks. Tasks include forming words out of two consecutive road signs (which each present two letters), counting the number of letters in a word, performing basic arithmetic operations (addition and subtraction), and ranking words in alphabetical order (Figure 2). With increasing difficulty, distractions are added: distracting noise to ignore, and a moving pointer of the petrol gauge to which attention should also be paid. The programme is adaptive; patients practice at their own level, and difficulty is increased throughout the sessions (e.g. faster stimulus rate and longer exercise duration, addition of aforementioned distractions). A score of at least 90% is needed to progress to the next difficulty level. Patients were provided with a laptop, and were required to train for 7 weeks (once a week, 45 minutes per session) at home. Researchers kept weekly contact with patients to ensure compliance (defined as the total time spent training being 75% or more).
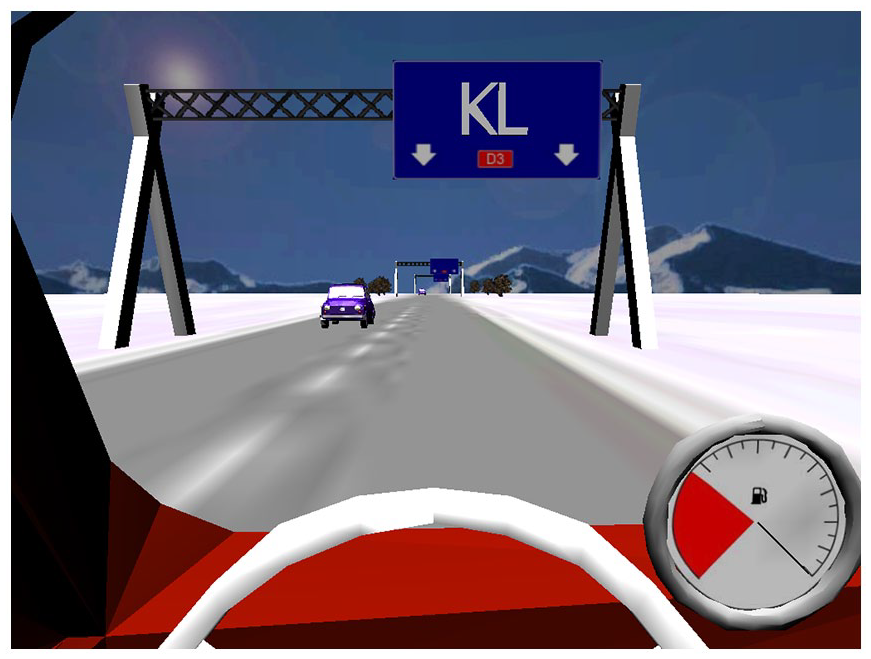
Example of the C-Car computer programme interface. In this particular task, participants are required to form words out of two consecutive road signs (which each present two letters), while at the same time pay attention to the petrol gauge that gradually empties.
Neuropsychological assessment and questionnaires
All patients underwent neuropsychological assessment at baseline (T0), post-intervention (T1) and 3 months follow-up (T2). HC underwent neuropsychological assessment only at baseline (T0). The following six cognitive domains, relevant to MS-specific cognitive decline, 4 were measured:
Verbal memory (California Verbal Learning Test – II; CVLT 13 )
Information processing speed (Oral Letter Digit Substitution Test; LDST 14 )
Visuospatial memory (Location Learning Test; LLT 15 )
Working memory (WAIS-III Digit Span; DS and WAIS-III Letter Number Sequencing test; LNS 16 )
Verbal fluency (Word List Generation; WLG 14 )
Attention (Stroop, 17 Concept Shifting Test; CST, 18 D2-test, 19 and Test of Everyday Attention; TEA 20 )
To reduce learning effects, parallel test versions were used where available (CVLT and TEA). The primary outcome was a statistically significant improvement in attention (as measured with the tests mentioned above) in the intervention group compared with the waiting-list group. Average cognition was assessed by calculating the mean of z-scores (based on the HC group) of all cognitive domains.
Questionnaires were administered to measure anxiety and depression (Hospital Anxiety and Depression Scale), 21 fatigue (Checklist Individual Strength 20-revised), 22 and subjective cognitive complaints (Cognitive Failures Questionnaire 23 ).
Defining response
To differentiate responders from non-responders, a reliable change index (RCI) from T0 to T1 was calculated for each cognitive test score. 24 To correct for practice effects, scores of the waiting-list control group were used to calculate the standard error of difference. If patients reached a post-intervention change in test score which corresponded to an RCI threshold of 1.64 (90% confidence interval), a reliable improvement (>+1.64) or decline (<−1.64) was designated. Responders were defined as scoring above the RCI threshold on at least two out of six (33%) of the cognitive domains measured (see above), on at least one test per domain.
MRI protocol
All patients underwent brain MRI scanning at baseline (T0) and post-intervention (T1). HCs underwent MRI scanning only at baseline (T0). All subjects were scanned on a 1.5 T whole-body magnetic resonance system (Siemens Magnetom Avanto Syngo, Erlangen, Germany), using an eight-channel phased-array head coil). The details of the MRI protocol are described in the Supplementary Material.
Grey matter, white matter and lesion volumes
White matter lesions were automatically segmented on the PD/T2 images using k-nearest neighbour classification with tissue-type priors, 25 which was also used to compute lesion volume. The lesion segmentations were visually inspected and manually corrected where necessary. Subsequently, white matter lesion masks were registered to the 3D T1-weighted images to enable lesion filling. 26 Whole-brain, grey and white matter volumes were calculated on the lesion-filled images using SIENAX, following previously published pipelines 27 and deep grey matter volumes were obtained using FIRST.
Diffusion-weighted imaging processing
Diffusion tensor imaging (DTI) data were pre-processed using motion and eddy current correction on images and gradient vectors followed by diffusion tensor fitting (in FMRIB Software Library FSL). To assess white matter integrity, fractional anisotropy (FA) maps were computed and non-linearly registered to the FMRIB58_FA brain. Next, FA maps were averaged across subjects and skeletonized to obtain the main white matter tracts common to the entire sample using the standard Tract-Based Spatial Statistics pipeline (part of FSL).
To obtain individual measures of whole-brain white matter integrity damage, the severity and extent of white matter damage was quantified based on FA (see Supplementary Material).
Resting-state functional connectivity
To define which resting-state network each region belonged to, the Yeo resting-state network atlas 28 was overlaid on the Brainnetome atlas, 29 after which each region was defined to one network based on maximal overlap. Based on previous literature on attention and FC, 30 networks relevant to attention were chosen, that is the dorsal attention network (DAN), ventral attention network (VAN), frontoparietal network (FPN) and default-mode network (DMN) (Figure 3). See also Supplementary Material.
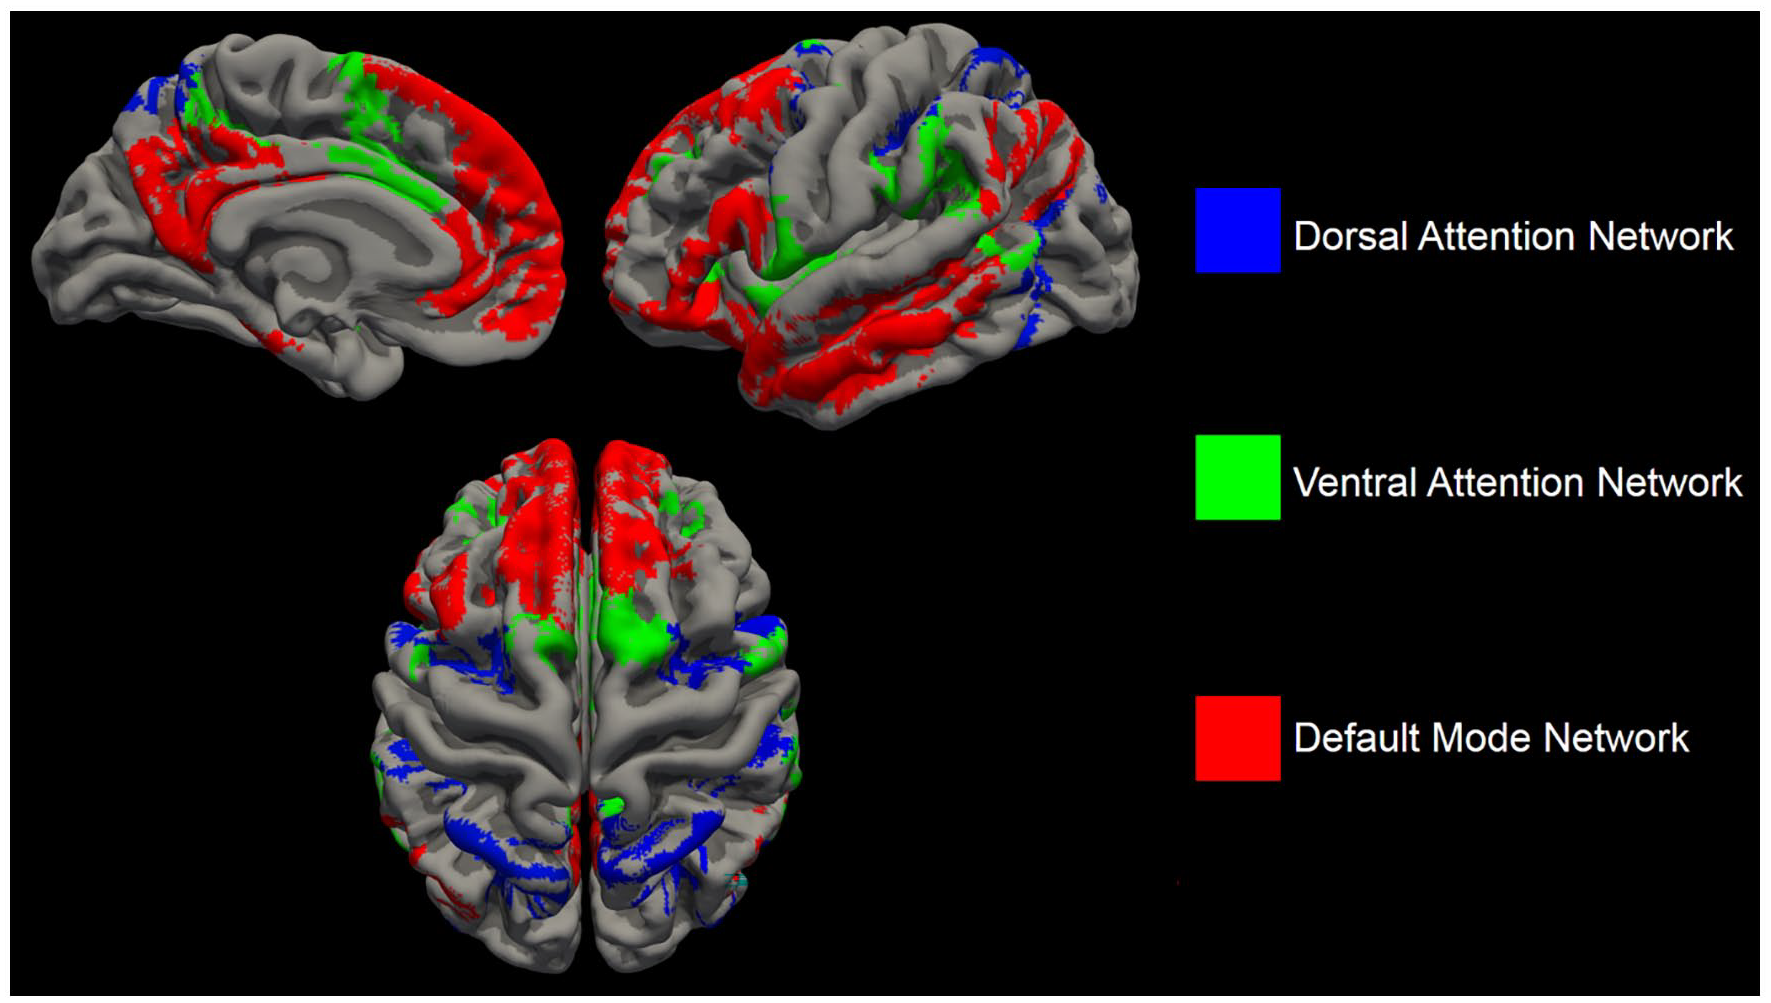
The cortical areas comprising the dorsal attention network (blue), ventral attention network (green) and default-mode network (red).
Statistical analyses
Statistical analyses were performed in SPSS, version 26. Independent samples t-tests and chi-square tests were used to assess baseline group differences, and nonparametric tests were used for variables that were non-normally distributed. To assess the effects of the intervention, linear mixed models were used with the intercept as a random factor, and group (intervention vs. waiting-list) and time (T0 vs. T1 vs. T2) as fixed factors. After the intervention group was divided into responders and non-responders, a multivariate general linear model was used to assess baseline differences in (1) demographic variables, (2) cognitive test scores, (3) structural MRI outcomes and (4) functional MRI outcomes. Finally, a backward logistic regression was performed, with responder/non-responder classification as dependent outcome, to identify the strongest independent baseline predictors of response. The Bonferroni post hoc test was used to examine differences between groups. Variables were entered in four blocks in the following order: demographics (age, sex, level of education, EDSS score), volumetric measures (cortical gray matter volume (GMV)), DTI measures (severity of microstructural white matter damage)and FC measures between the DMN and FPN, DAN and VAN. Group comparison p-values < 0.05 after correcting for multiple comparisons (Bonferroni correction) were considered statistically significant.
Results
Baseline characteristics
The sample consisted of 82 PwMS (53 female, mean age 48.46 (9.92) years, mean disease duration 13.52 (8.24) years, median EDSS = 4.0, 1 CIS, 58 RRMS, 20 SPMS, 3 unknown disease course) and 21 HC (15 female, mean age 50.27 (10.15) years) (Table 1). Patients in the intervention group trained, on average, for 138.60 minutes (SD = 54.20), that is 77.87% of the total programme duration.
Demographics and brain volumes of the entire sample..
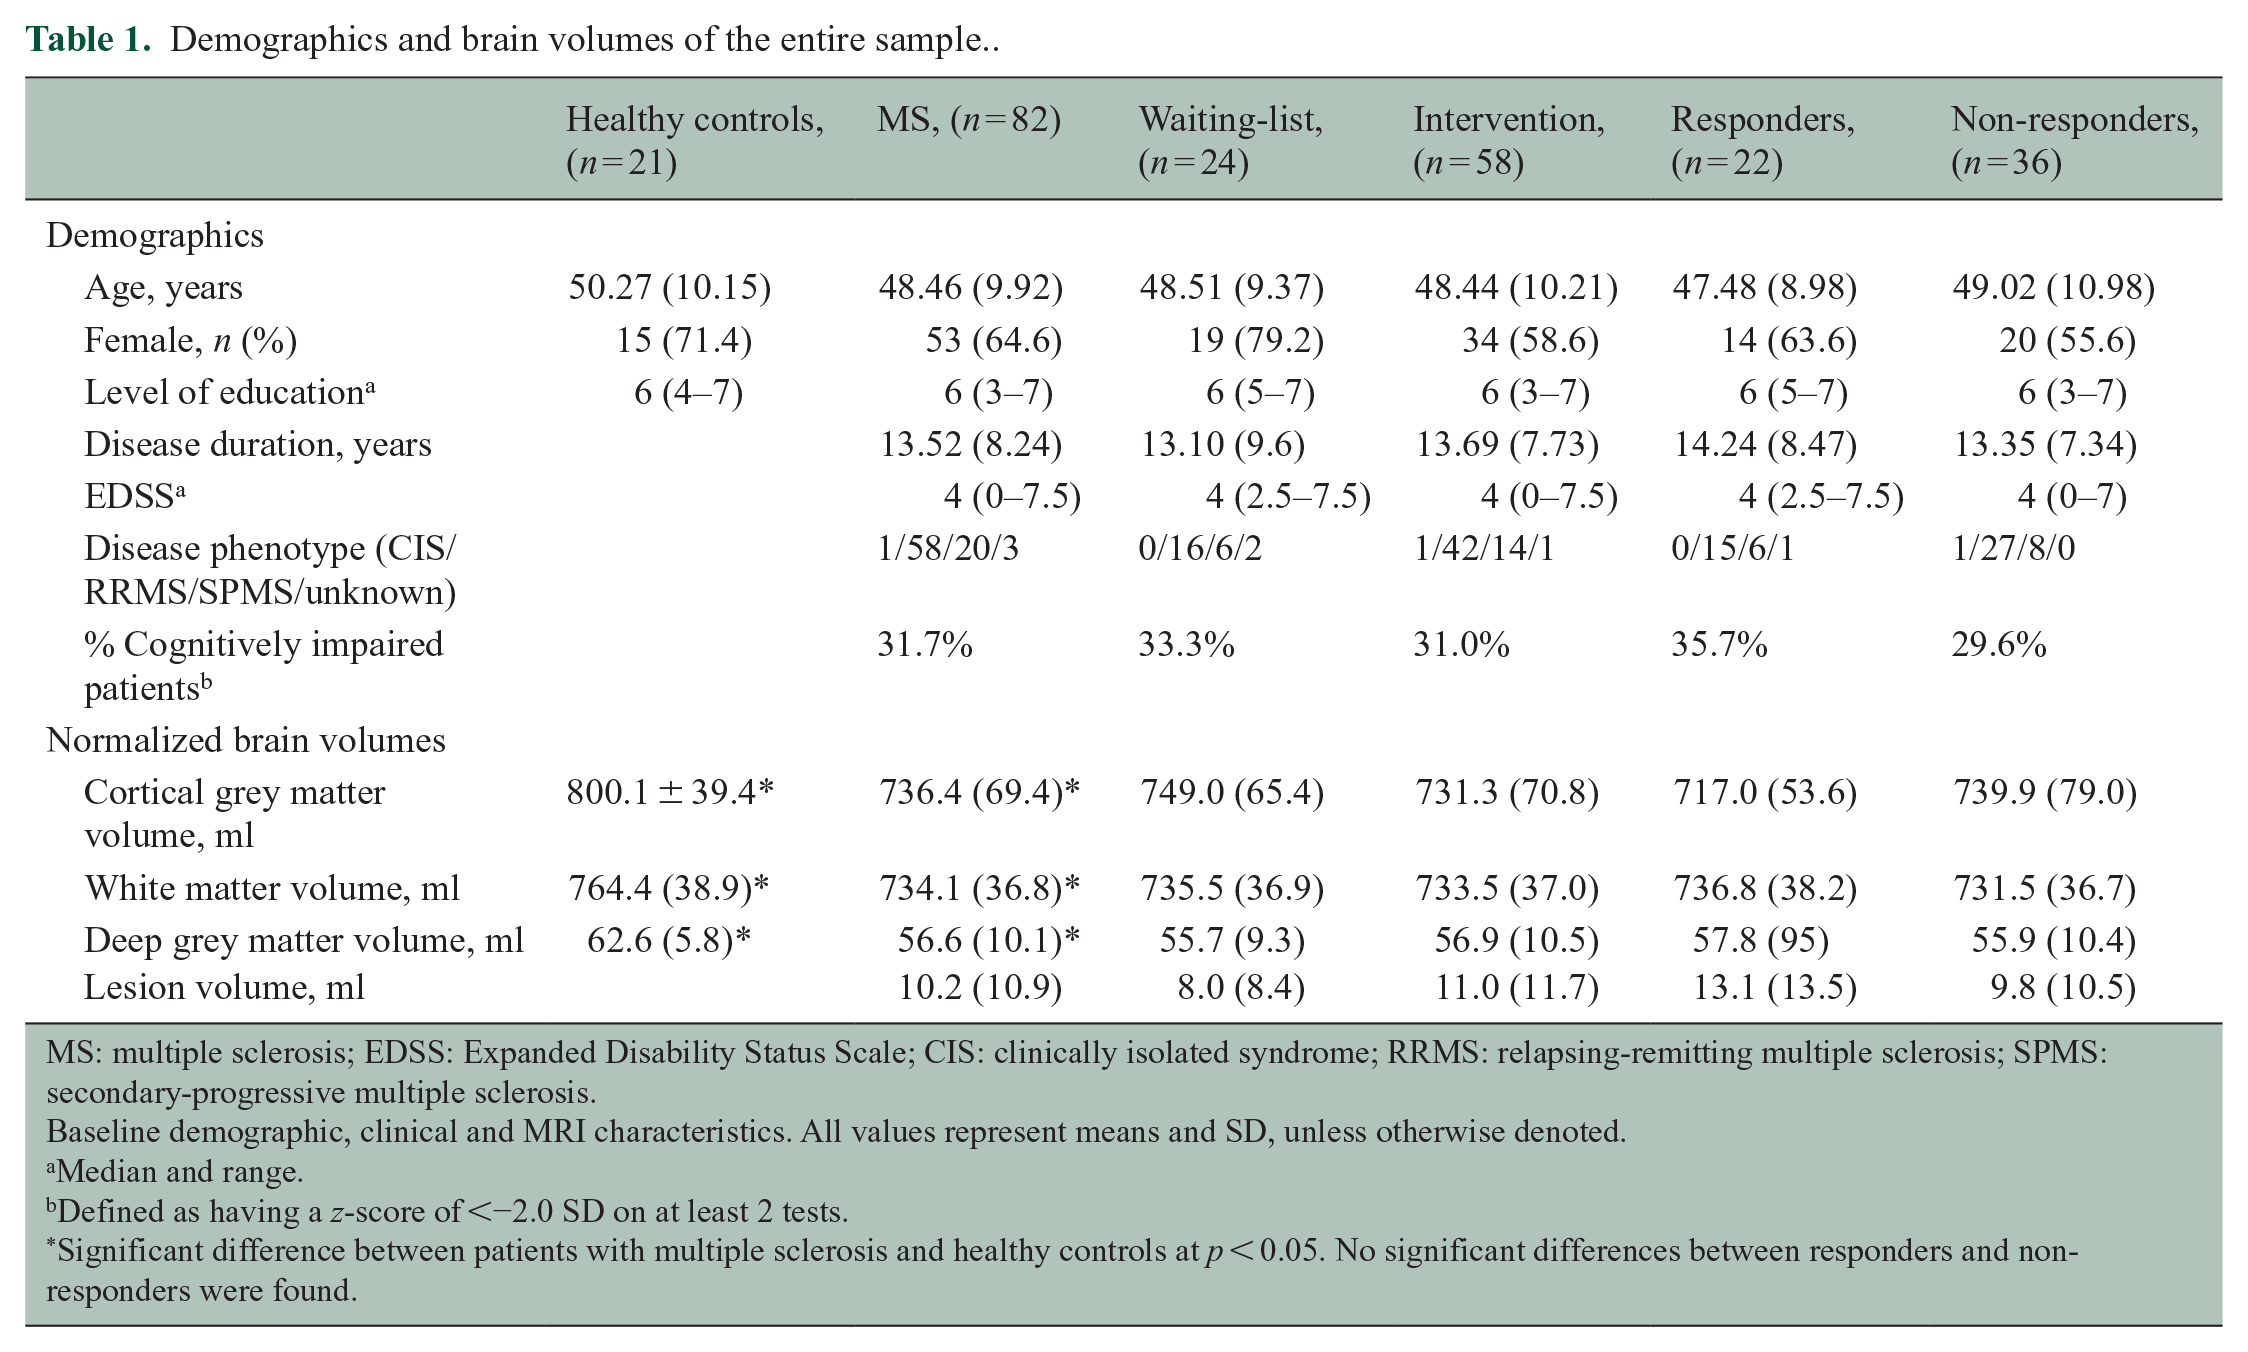
MS: multiple sclerosis; EDSS: Expanded Disability Status Scale; CIS: clinically isolated syndrome; RRMS: relapsing-remitting multiple sclerosis; SPMS: secondary-progressive multiple sclerosis.
Baseline demographic, clinical and MRI characteristics. All values represent means and SD, unless otherwise denoted.
Median and range.
Defined as having a z-score of <−2.0 SD on at least 2 tests.
Significant difference between patients with multiple sclerosis and healthy controls at p < 0.05. No significant differences between responders and non-responders were found.
Baseline differences between PwMS and HC
There were no significant differences in age, sex and education between HC and PwMS (Table 1). PwMS had significantly worse average cognition (t = −4.41, p < 0.001), reported higher levels of depression, anxiety, fatigue, subjective cognitive complaints, and had a more passive coping style on average compared with HC (see Table 2). Compared with HCs, PwMS had significantly less grey matter (GM), white matter (WM) and deep grey matter (DGM) volume, as well as significantly higher FC between DMN-DAN (p = 0.012), DMN-VAN (p = 0.011) and DMN-FPN (p = 0.03) (Table 1).
Raw scores on neuropsychological evaluation and questionnaires.
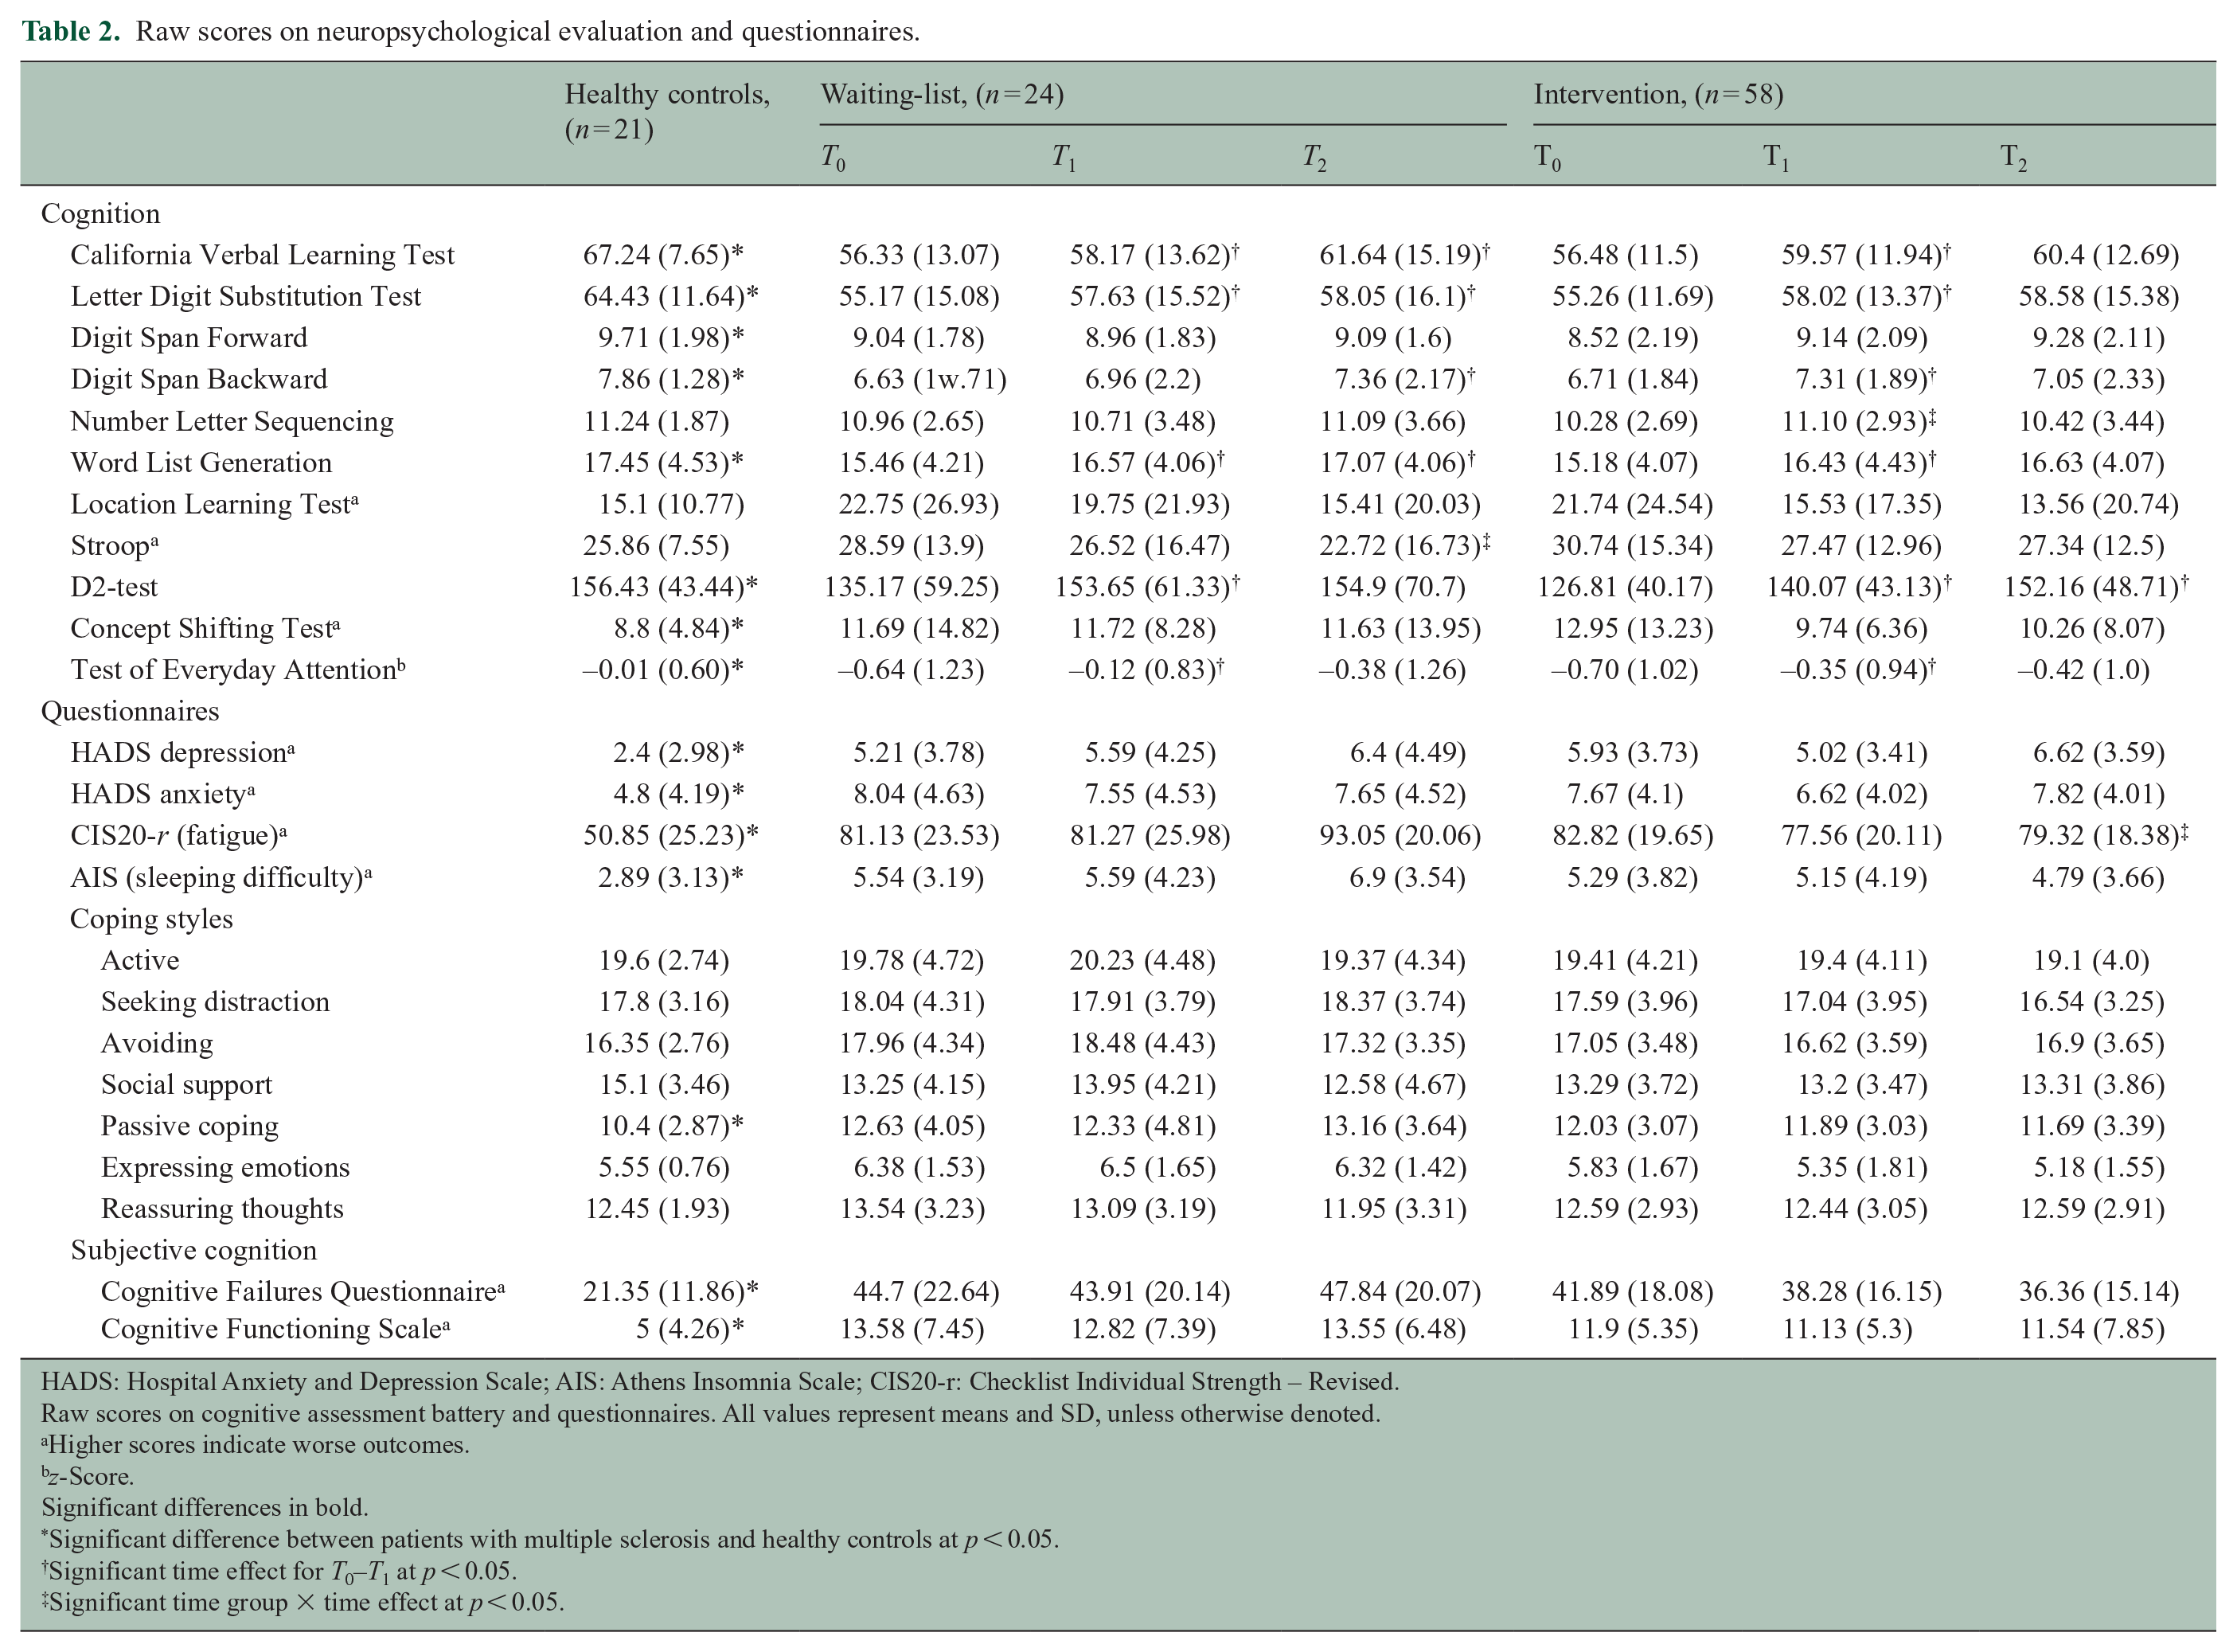
HADS: Hospital Anxiety and Depression Scale; AIS: Athens Insomnia Scale; CIS20-r: Checklist Individual Strength – Revised.
Raw scores on cognitive assessment battery and questionnaires. All values represent means and SD, unless otherwise denoted.
Higher scores indicate worse outcomes.
z-Score.
Significant differences in bold.
Significant difference between patients with multiple sclerosis and healthy controls at p < 0.05.
Significant time effect for T0–T1 at p < 0.05.
Significant time group × time effect at p < 0.05.
PwMS in the intervention group and in the waiting-list control condition did not differ in age, sex, educational level, cognitive performance and self-perceived cognition and levels of fatigue, anxiety and depression at baseline. Imaging measures were not different between the two groups (Tables 1–3).
Effects of C-Car
The pre- and post-intervention differences investigated on a group level on short- and long-term follow-up neuropsychological testing are presented here.
Immediate effects
A significant group × time effect was found for working memory (Letter-Number-Sequencing) between T0 and T1 (Figure 4). The intervention group improved (T0: 10.28 (SD = 2.69) versus T1: 11.1 (SD = 2.93)) compared to the waiting-list controls (T0: 10.96 (SD = 2.65) versus T1: 10.71 (SD = 3.48), F = 4.470, p = 0.038), with a standardized mean difference of 0.37 (effect size). No other significant effects were found for any of the other cognitive tests and questionnaires (Table 2), nor for measures of white matter damage and FC (Table 3).
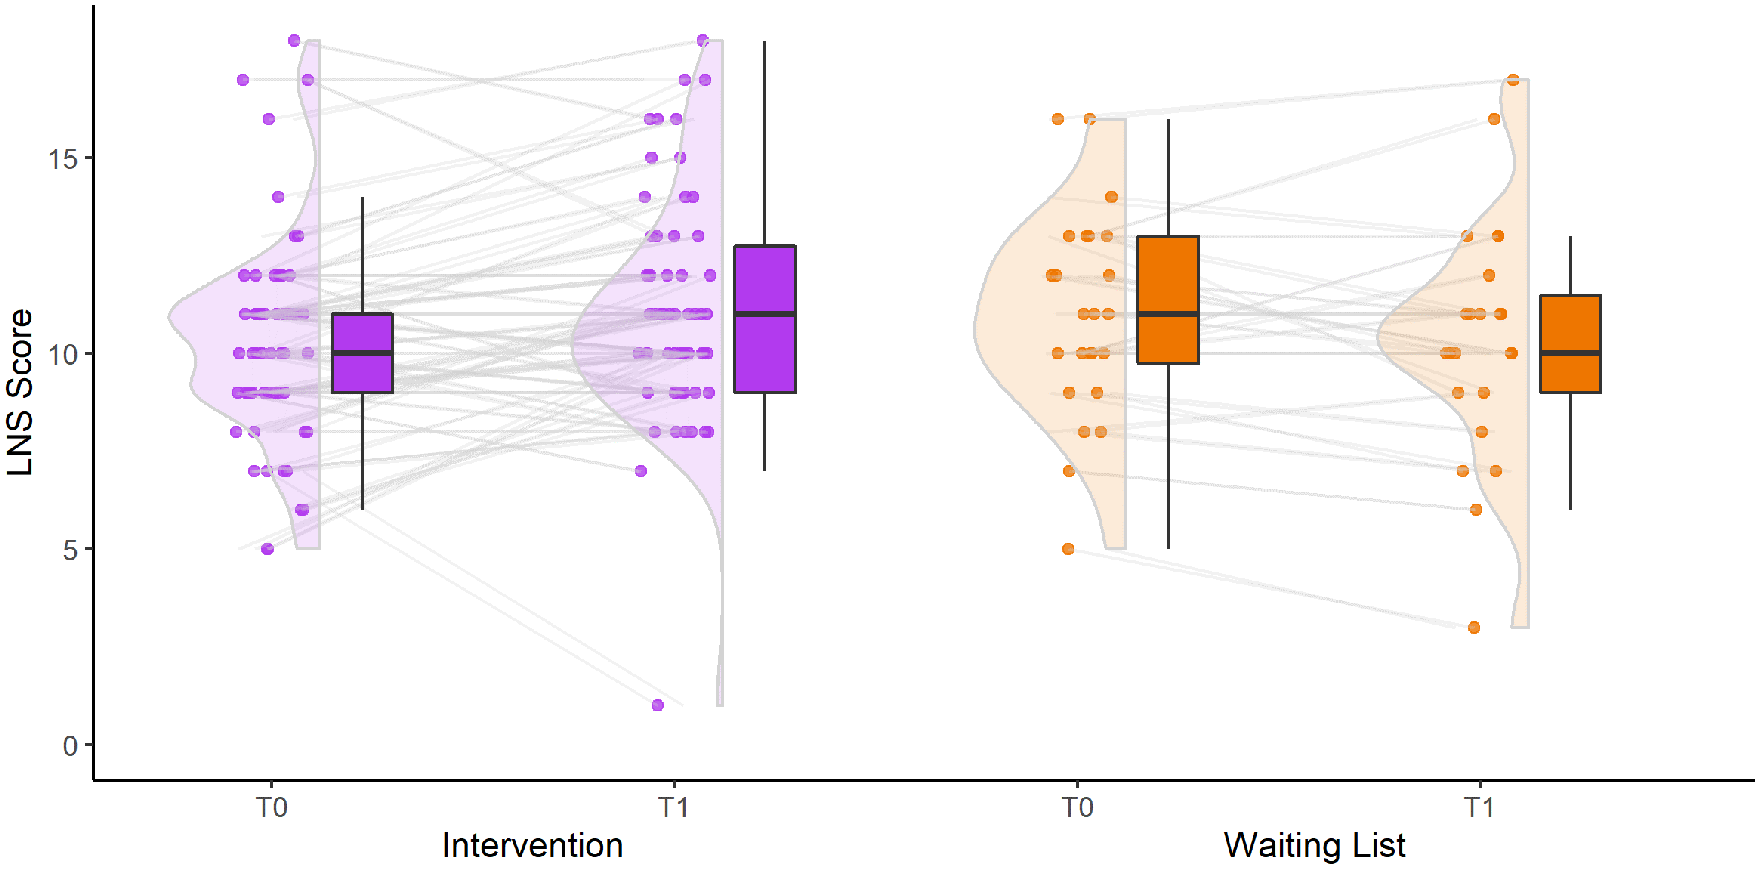
Change in working memory (measured with Letter-Number-Sequencing test) between baseline and post-intervention. Boxplots show median and quartiles, dots show individual scores, with lines connecting individual scores between timepoints.
Microstructural white matter changes and functional connectivity in the intervention group, waiting-list group, and healthy controls.
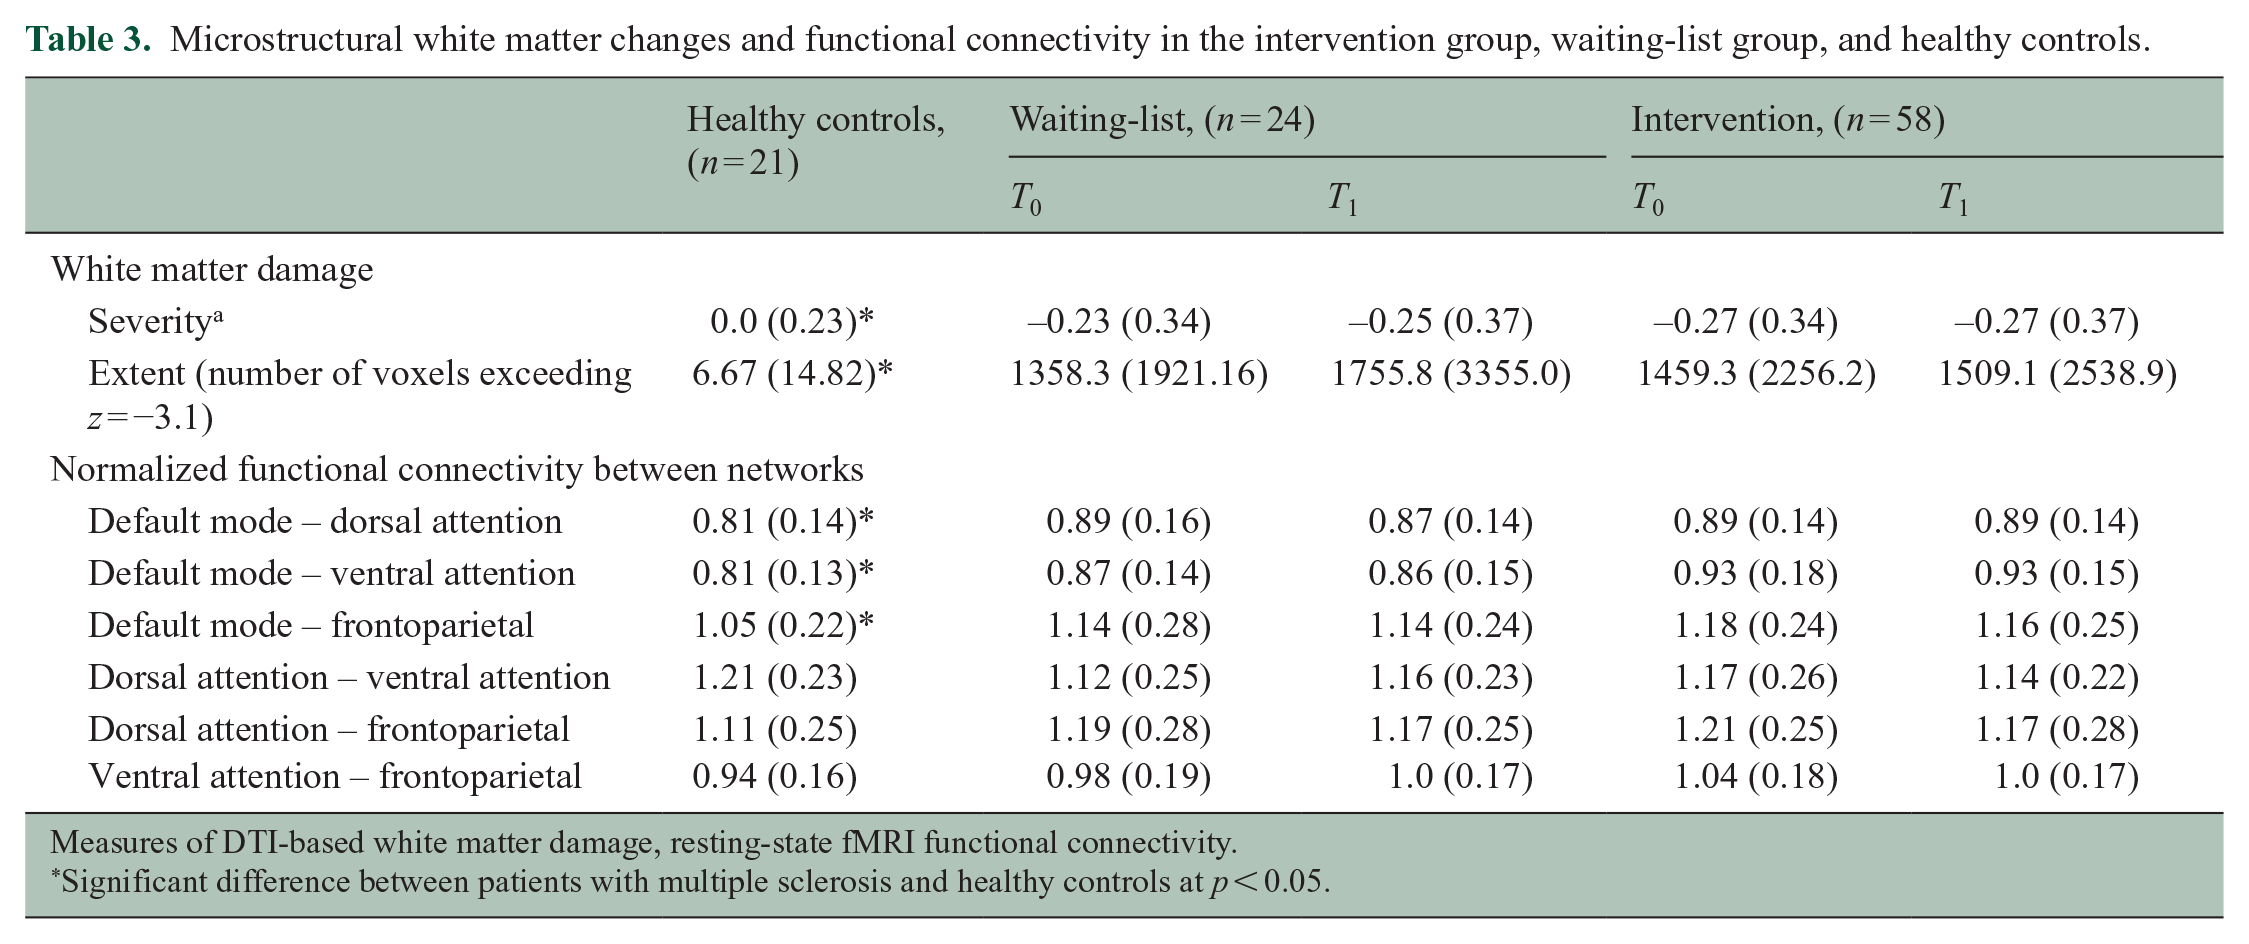
Measures of DTI-based white matter damage, resting-state fMRI functional connectivity.
Significant difference between patients with multiple sclerosis and healthy controls at p < 0.05.
Three-month follow-up effects
For group differences between T0, T1 and T2, no significant effects were found for any of the cognitive measures. A significant group × time effect was found for fatigue (CIS-20r, F = 5.177, p = 0.007), with patients in the waiting-list control group experiencing increased fatigue at 3 months follow-up compared with patients in the intervention group (intervention: T0 = 81.13 (SD = 23.53), T1 = 81.27 (SD = 25.98), and T2 = 93.05 (SD = 20.06) versus waiting-list: T0 = 82.82 (SD = 19.65), T1 = 77.56 (SD = 20.11) and T2 = 79.32 (SD = 18.38)). No significant effects were found for any of the other questionnaires, nor for the MRI measures.
Baseline differences between responders and non-responders
Cognitive characteristics
Patients in the intervention group were divided into responders (n = 22; 38%) and non-responders (n = 36, 62%) based on immediate post-intervention improvement compared with baseline. Training duration did not significantly differ between responders and non-responders (131.31 (SD = 58.24) vs. 142.11 (SD = 52.93), p = 0.562). Two responders (9.1%) improved on four out of six cognitive domains, seven responders (31.9%) improved on three out of six cognitive domains, and 13 responders (59%) improved on two out of six cognitive domains. Of the cognitive domains for which improvement was found, 19 patients (84.6%) improved on one or more measures of working memory (Digit Span Forward and Backward, Letter-Number-Sequencing), 11 patients (50%) improved on verbal memory (CVLT-II), 10 patients (45.5%) improved on information processing speed (LDST), six patients (27.3%) improved on verbal fluency (WLG), six patients (31.8%) improved on measures of attention (Stroop, D2-test, CST, TEA), and one patient (4.5%) improved on visuospatial memory (LLT). For the non-responders, 18 patients (50%) improved on one cognitive domain, and the remaining 18 did not improve on any cognitive domain.
Clinical characteristics
Responders and non-responders did not differ on demographic variables (age, sex, level of education), clinical variables (disease duration, EDSS score, disease phenotype), baseline cognition, and any of the questionnaires (depression, anxiety, fatigue, sleeping difficulty, coping style, subjective cognition).
Imaging
There were no differences between responders and non-responders in baseline cortical GMV (731.3 (70.8) vs. 739.94), white matter volume (WMV; 736.78 vs. 731.45), deep grey matter volume (DGMV; 57.79 vs. 55.72) and lesion volume (13.11 vs. 9.83). In addition, no differences were seen for DTI-based measures of extent (1157.9 vs. 1643.5) and severity (−0.17 vs. −0.32) of white matter damage (Tables 1 and 4). Responders had a significantly lower FC between DMN-VAN compared with non-responders (0.87 vs. 0.98, p = 0.018) (Figure 5).
Microstructural white matter damage and functional connectivity in responders, non-responders and healthy controls.
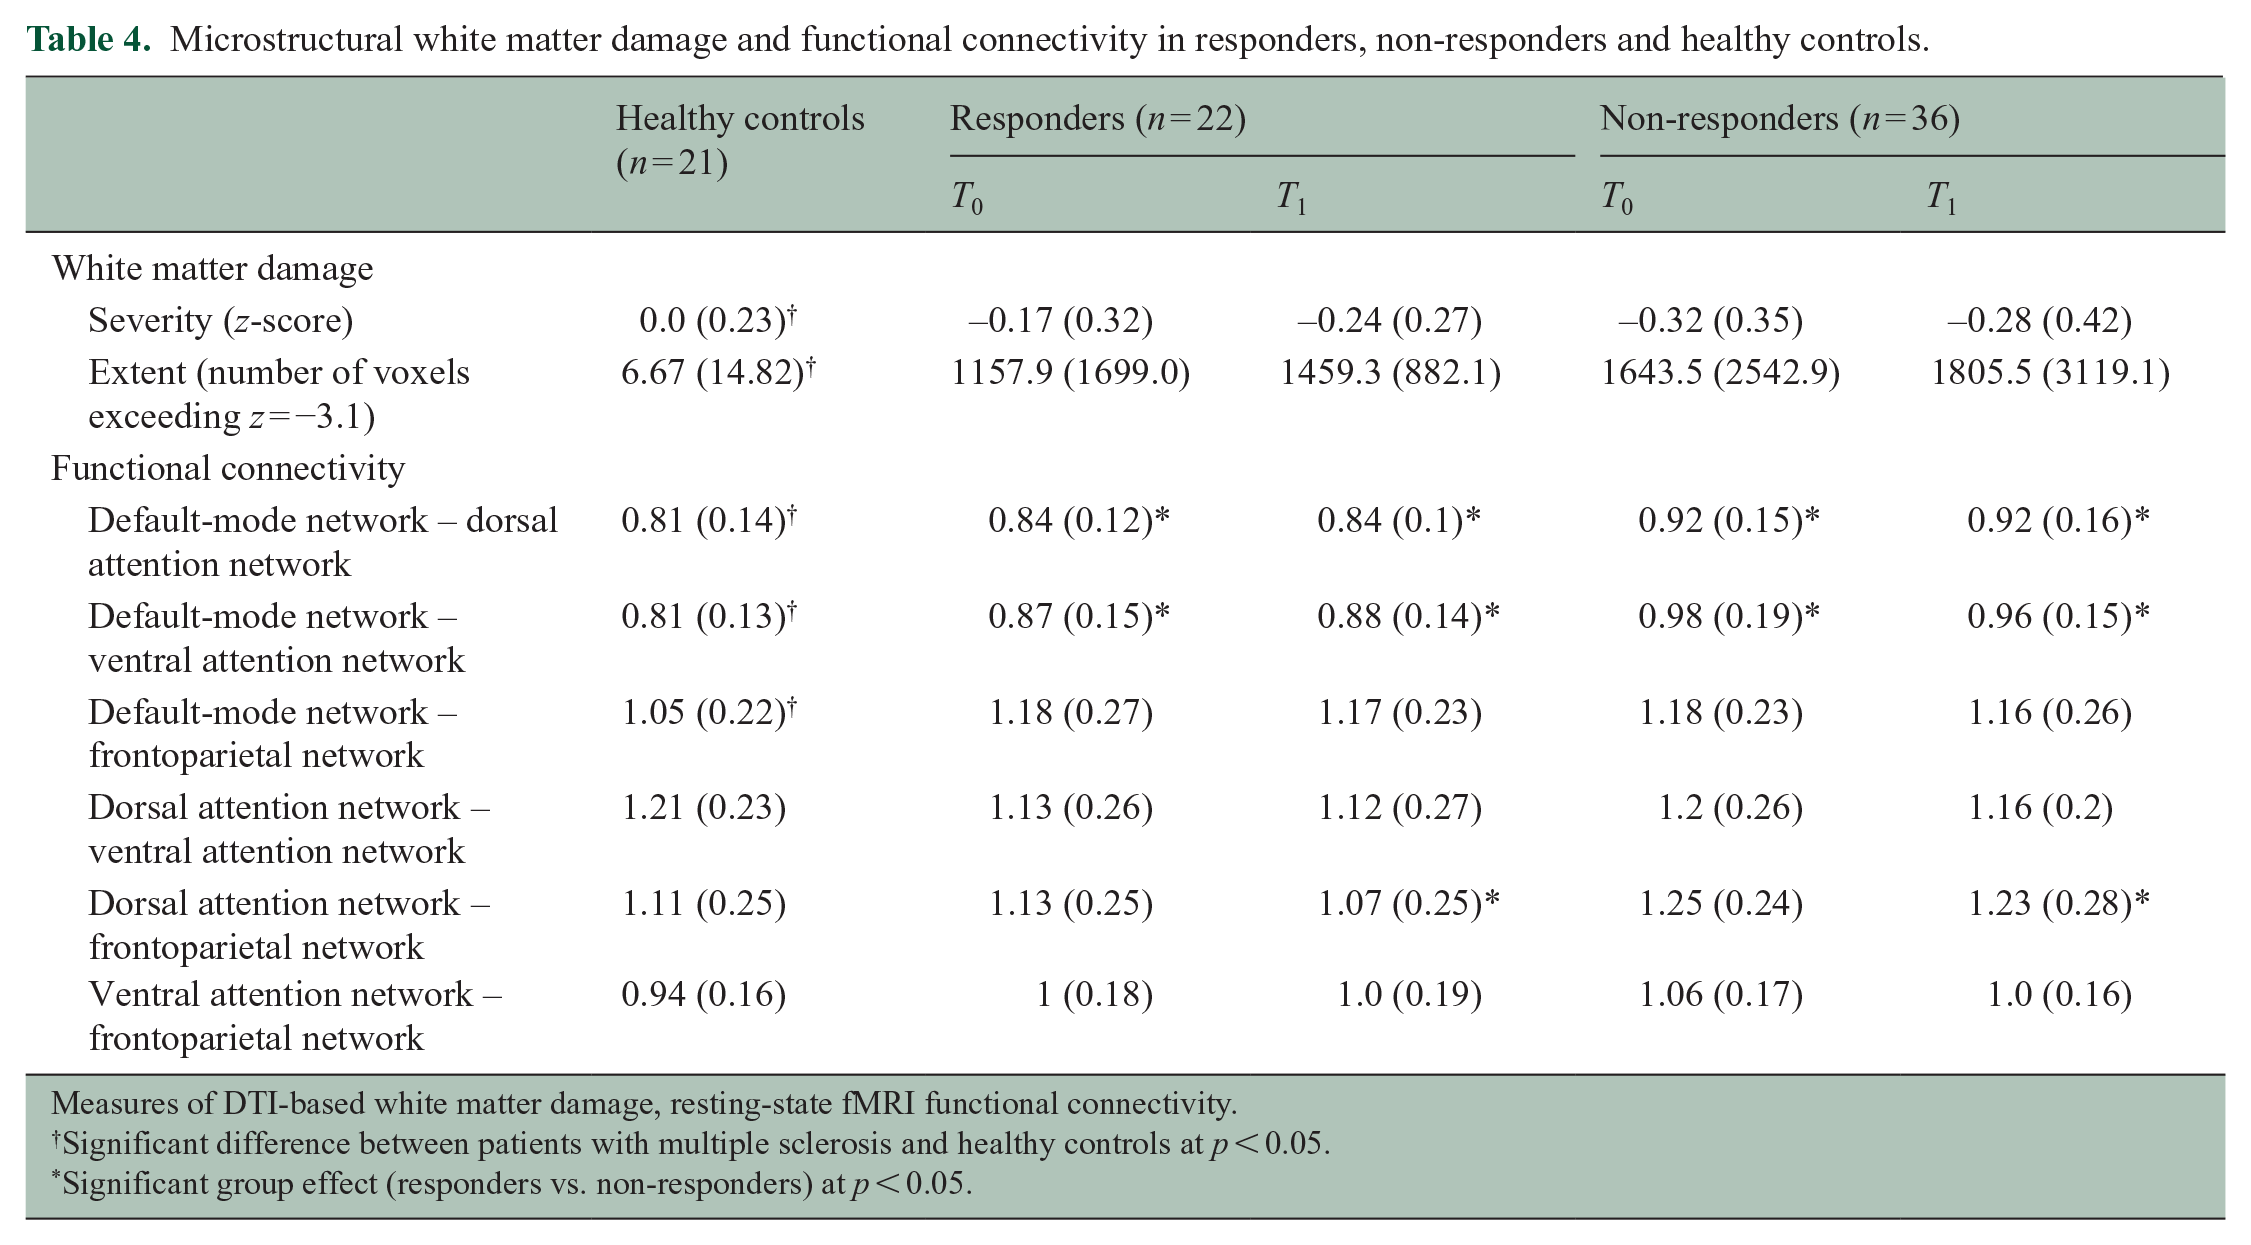
Measures of DTI-based white matter damage, resting-state fMRI functional connectivity.
Significant difference between patients with multiple sclerosis and healthy controls at p < 0.05.
Significant group effect (responders vs. non-responders) at p < 0.05.
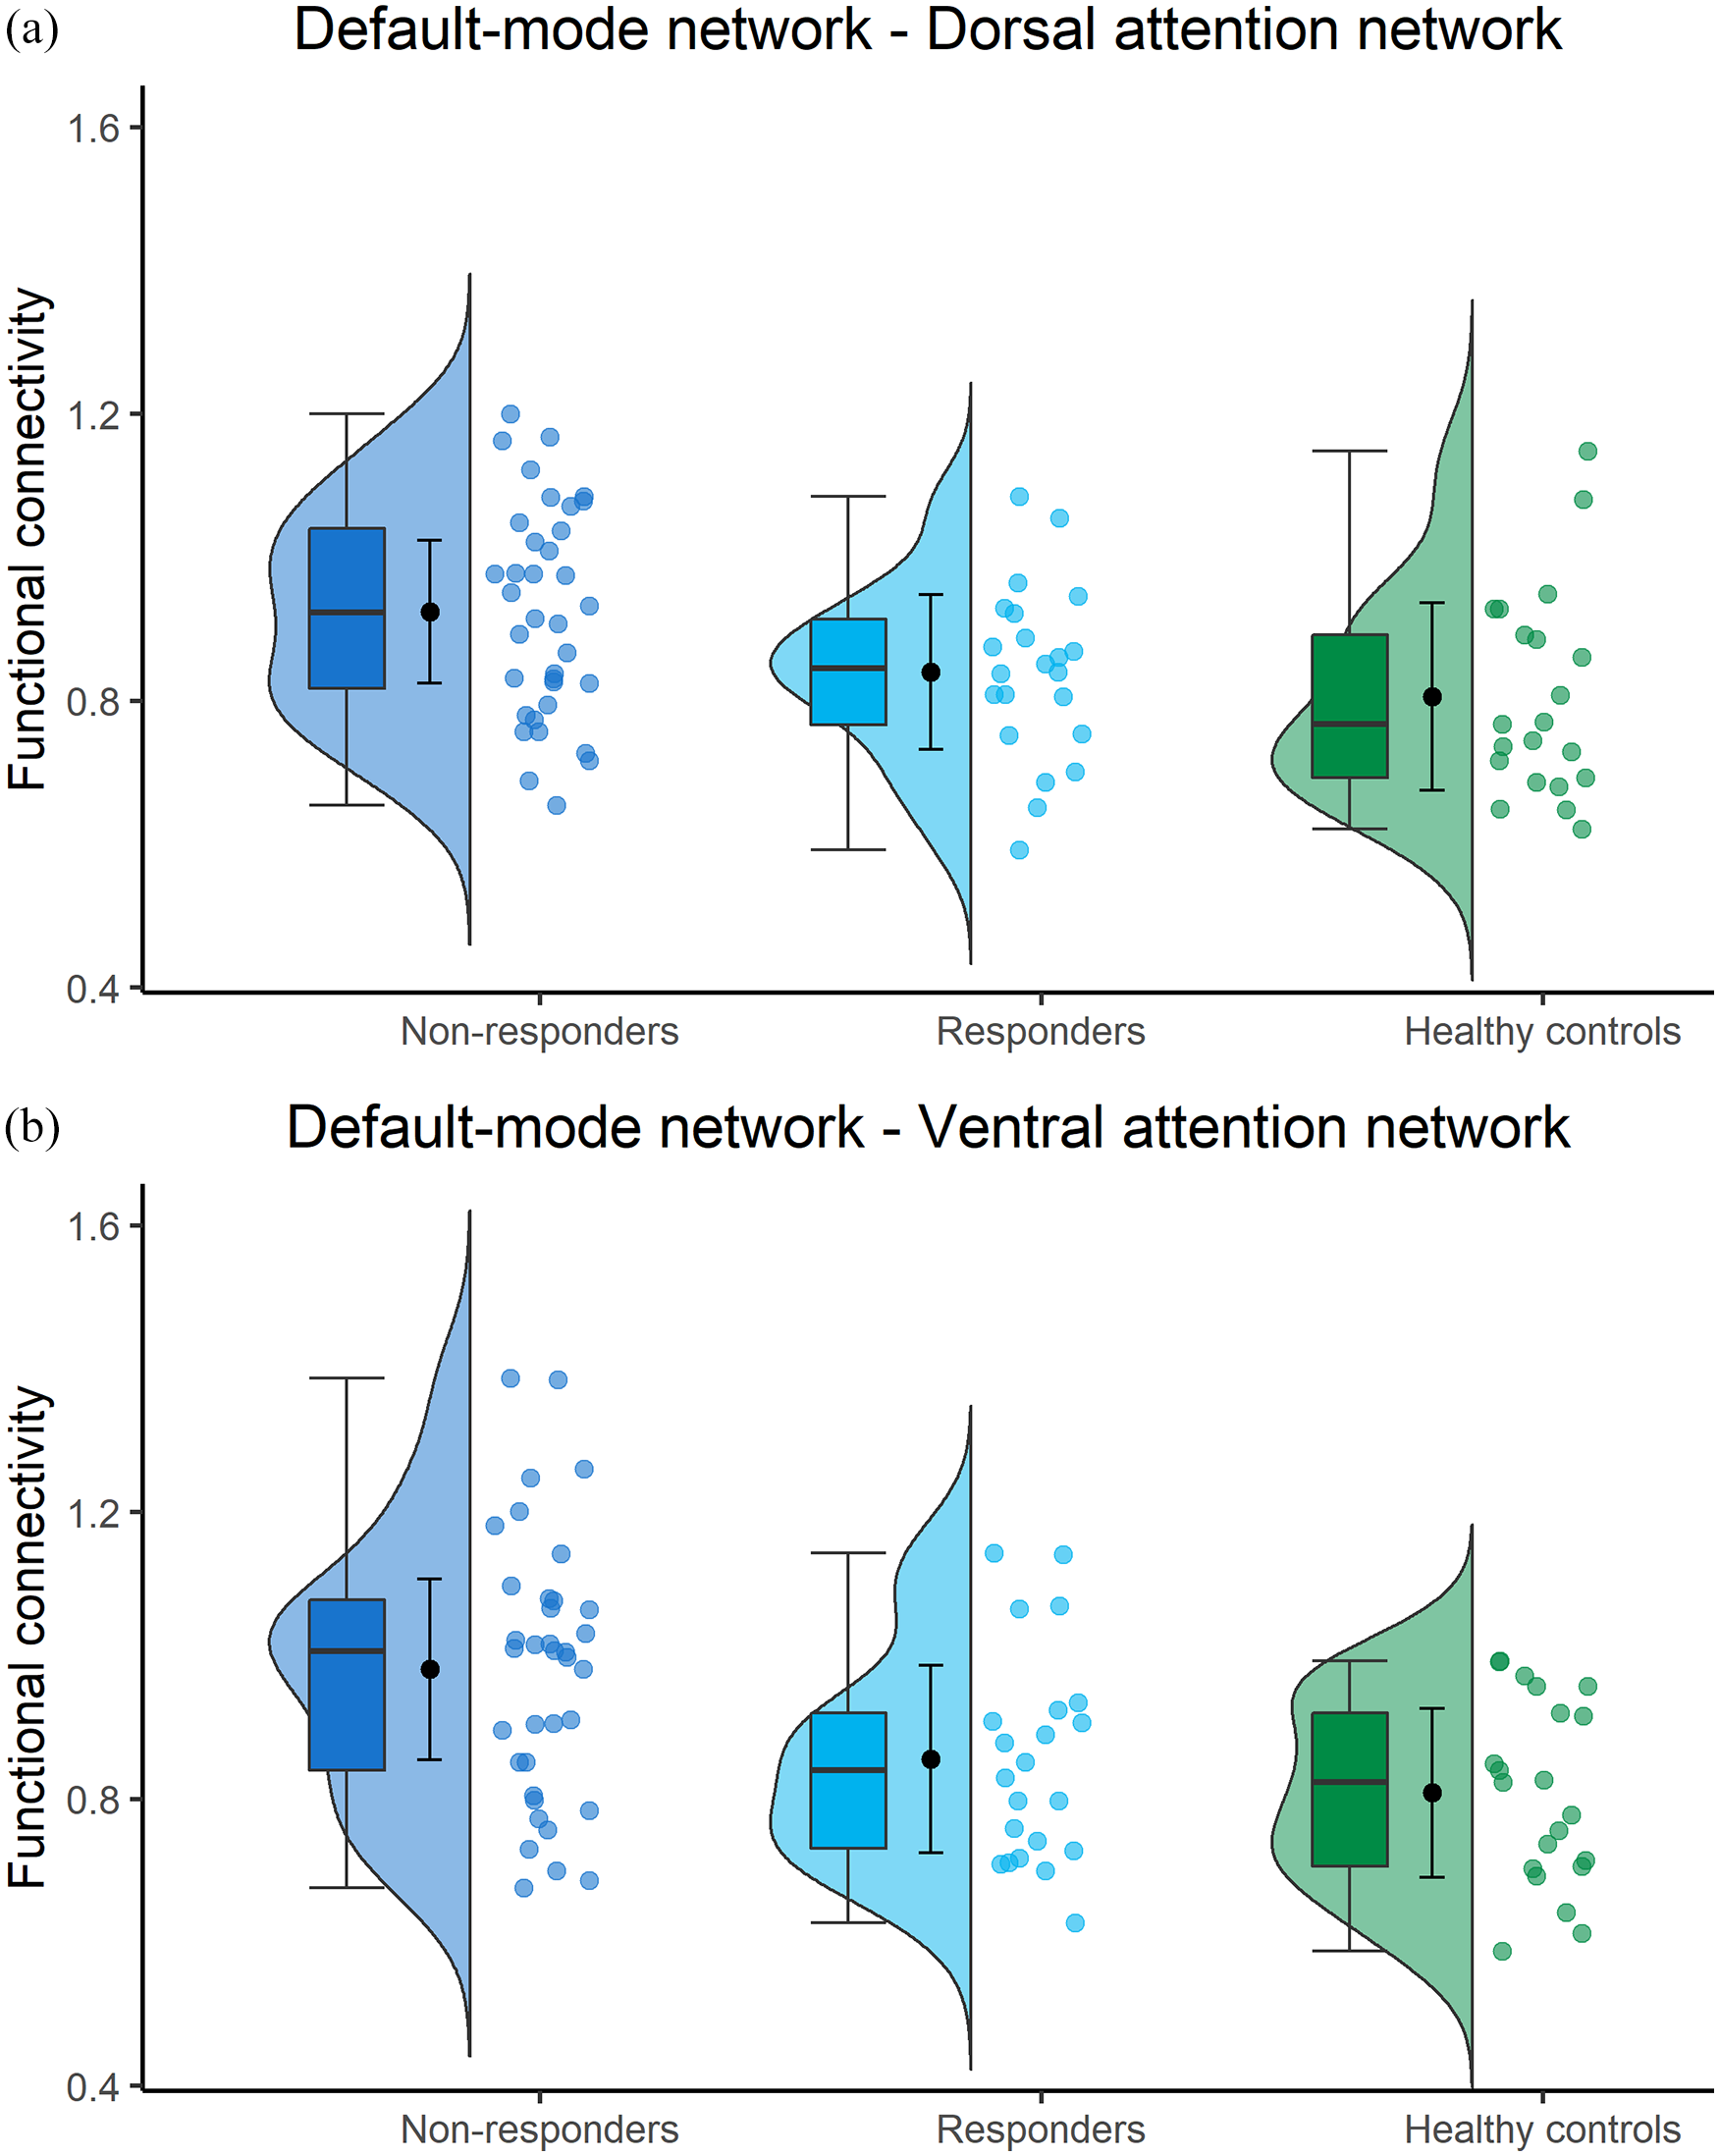
(a) Functional connectivity between the default-mode network and dorsal attention network, (corrected by dividing with average brain connectivity). Boxplots show median and quartiles, dot with whiskers represent mean and standard deviation. (b) Functional connectivity between the default-mode network and ventral attention network, (corrected by dividing with average brain connectivity). Boxplots show median and quartiles, dot with whiskers represent mean and standard deviation.
Finally, responders did not show significantly different FC compared with HC, while non-responders showed significantly higher FC between DMN-DAN (0.92 vs. 0.81, p = 0.009) and DMN-VAN (0.98 vs. 0.81, p = 0.001), compared with both responders and HC (Figure 5).
Predicting response
The backward logistic regression identified two independent predictors for response: lower FC between DMN-VAN (p = 0.004), and lower FC between DMN-FPN (p = 0.029). The model accurately predicted 81.8% of non-responders, and 54.5% of responders (Nagelkerke R2 = 0.25).
Discussion
The main aim of this study was to gain insight into the effectiveness of computerized attention training in PwMS and into the clinical and MRI-based characteristics that are associated with successful cognitive training response. Therefore, we performed the conventional analysis of pre–post effects of C-Car on a group level, which yielded results and effect sizes similar to those found in previous cognitive training studies. 3 Unexpectedly, we saw no significant post-intervention improvement in attention. However, patients in the intervention group showed a modest immediate improvement in working memory (standardized mean difference = 0.37, p = 0.038) with no sustained effects on cognitive performance at 3 months follow-up, which is in line with previous results5,31 and might indicate the need for a longer duration of cognitive training programmes. Interestingly, we observed a long-term effect for fatigue, with patients in the intervention group showing stable fatigue at the 3 month follow-up compared with the increased fatigue of the waiting-list control group, consistent with previous findings of the C-Car intervention in glioma patients. 11
Comparing responders and non-responders provided important information. Responders and non-responders did not differ in demographic and clinical variables, baseline cognitive performance, nor in the amount of atrophy and microstructural damage. In previous work, lower grey and white matter volume and a relapsing-remitting disease course were predictive of better response. 6 The fact that we were unable to reproduce these results might be explained by sample differences. Specifically, patients in our study had a higher cortical GM volume and shorter disease duration (13.52 vs. 21.6 years) compared with patients in the study of Fuchs et al. 6
Interestingly, regarding fMRI findings, non-responders exhibited higher FC between the DMN and attention networks compared with responders and HC. More precisely, responders showed no differences in FC compared with HC, suggesting an intact connectivity (Figure 5). This relationship between alterations in DMN connectivity and treatment response is in line with previous results 8 and may be explained by the anti-correlation between DMN and attention networks both in tasks and during rest. 32 The similarity of our results to those of previous studies with different patient cohorts and interventions, 8 might suggest that our results are generalizable to other cognitive rehabilitation approaches. This should be further investigated in future studies; if it is indeed the case, this could indicate a mechanism that affects response regardless of cognitive domains affected. Perhaps in non-responders, the DMN insufficiently deactivates when needed, and as such shows an increased connectivity with attention networks. Indeed, in healthy individuals, an increased FC between the DMN and attention networks has been related to poorer attention. 30 In addition, alterations in DMN connectivity and network dynamics are rather common in PwMS and relate to cognitive impairment.33,34 As such, it may well be that an intact FC of the DMN is a prerequisite for successful cognitive training response, regardless of the intervention used. In our multivariate prediction model, lower FC between DMN-VAN and between DMN-FPN (i.e. ‘normal FC’) were both identified as predictors of response. This indicates that the fewer deviations there are from HC-like FC, the higher the chance for successful cognitive training.
Consequently, it seems that the timing of cognitive training in PwMS is of utmost importance. One could argue that a mind-set shift from symptom management towards preventive intervention aimed at preserving cognition is needed (i.e. enhancement of network functioning rather than restoring it, since the latter might be impossible).
Our study is not without limitations. The use of a waiting-list control group is not as optimal as an active control condition. 35 Also, cognitive impairment was not an inclusion criterion. As a result, the group is heterogeneous in terms of cognitive performance at baseline. That being said, 57.3% of all PwMS were impaired (z < −2.0SD) at baseline on at least one test. Moreover, although the definition of cognitive decline is well-established in the literature, the definition for response is less clear. We thus decided to rely on a conservative statistical approach (reliable change index). Another limitation of our RCI approach is that multiple tests were included in the domains of attention and working memory. Response in at least one test was calculated as response in the cognitive domain, hence making response in working memory and attention perhaps slightly more likely.
To conclude, our results demonstrated a mild-to-moderate overall short-term working memory effect of a computerized attention training for PwMS. Despite the lack of significant improvement in attention on a group level, we demonstrated that by investigating individual responses to treatment almost 40% of PwMS do improve after training, an effect that would have gone unnoticed in group-level statistics. Response seems to depend on a window of opportunity defined by an intact FC between the DMN and attention networks, allowing the brain to be receptive for the effects of cognitive training. Given the heterogeneity of MS progression, disease course and observed differential response to cognitive training, 5 it is evident that future studies in the field now need to start exploring individualized (selection) approaches to maximize the effectiveness of cognitive training programmes.6,8
Supplemental Material
sj-docx-1-msj-10.1177_13524585221103134 – Supplemental material for A randomized trial predicting response to cognitive rehabilitation in multiple sclerosis: Is there a window of opportunity?
Supplemental material, sj-docx-1-msj-10.1177_13524585221103134 for A randomized trial predicting response to cognitive rehabilitation in multiple sclerosis: Is there a window of opportunity? by Stefanos E Prouskas, Menno M Schoonheim, Marijn Huiskamp, Martijn D Steenwijk, Karin Gehring, Frederik Barkhof, Brigit A de Jong, Margriet M Sitskoorn, Jeroen JG Geurts and Hanneke E Hulst in Multiple Sclerosis Journal
Footnotes
Acknowledgements
The authors thank Heleen Geubels, Quinten van Geest, Benthe Westerik, Denise Visser, Marike van Lingen, Noor Braaksma, Matthijs Keijzer, Wietske Babeliowsky, Julia Jelgerhuis, Lieke van Dongen, Hannah de Bruin, Rosanne Heijstek and Eileen Stalman for their extensive assistance with neuropsychological testing, and MRI scanning.
Declaration of Conflicting Interests
The author(s) declared the following potential conflicts of interest with respect to the research, authorship, and/or publication of this article: M.M.S. serves on the editorial board of Frontiers in Neurology, receives research support from the Dutch MS Research Foundation and has served as a consultant for or received research support from Biogen, Celgene, Genzyme, MedDay and Merck. F.B. is a steering committee member and iDMC member for Biogen, Merck, Roche and EISAI; consultant for Roche, Biogen, Merck, IXICO, Jansen and Combinostics; has research agreements with Novartis, Merck, Biogen, GE and Roche; is the co-founder and shareholder of Queen Square Analytics LTD and is supported by the NIHR biomedical research centre at UCLH. B.A.d.J. has received speaker and consulting fees from Merck-Serono, Biogen, TEVA, Genzyme and Novartis. J.J.G.G. is an editor of Multiple Sclerosis Journal. He serves on the editorial boards of Neurology and Frontiers in Neurology and is the president of the Netherlands Organization for Health Research And Innovation. He has served as a consultant for or received research support from Biogen, Celgene, Genzyme, MedDay, Merck, Novartis and Teva. H.E.H. serves on the editorial board of Multiple Sclerosis Journal, receives research support from the Dutch MS Research Foundation and has served as a consultant for or received research support from Biogen, Celgene, Genzyme, MedDay, Merck and Novartis. The remaining authors have no conflicts to declare.
Funding
The author(s) disclosed receipt of the following financial support for the research, authorship, and/or publication of this article: This study was supported by the Dutch MS Research foundation (grant no. 12-799 MS).
Supplemental Material
Supplemental material for this article is available online.
References
Supplementary Material
Please find the following supplemental material available below.
For Open Access articles published under a Creative Commons License, all supplemental material carries the same license as the article it is associated with.
For non-Open Access articles published, all supplemental material carries a non-exclusive license, and permission requests for re-use of supplemental material or any part of supplemental material shall be sent directly to the copyright owner as specified in the copyright notice associated with the article.