
Abstract
Background:
Advanced magnetic resonance imaging (MRI) methods can provide more specific information about various microstructural tissue changes in multiple sclerosis (MS) brain. Quantitative measurement of T1 and T2 relaxation, and diffusion basis spectrum imaging (DBSI) yield metrics related to the pathology of neuroinflammation and neurodegeneration that occurs across the spectrum of MS.
Objective:
To use relaxation and DBSI MRI metrics to describe measures of neuroinflammation, myelin and axons in different MS subtypes.
Methods:
103 participants (20 clinically isolated syndrome (CIS), 33 relapsing-remitting MS (RRMS), 30 secondary progressive MS and 20 primary progressive MS) underwent quantitative T1, T2, DBSI and conventional 3T MRI. Whole brain, normal-appearing white matter, lesion and corpus callosum MRI metrics were compared across MS subtypes.
Results:
A gradation of MRI metric values was seen from CIS to RRMS to progressive MS. RRMS demonstrated large oedema-related differences, while progressive MS had the most extensive abnormalities in myelin and axonal measures.
Conclusion:
Relaxation and DBSI-derived MRI measures show differences between MS subtypes related to the severity and composition of underlying tissue damage. RRMS showed oedema, demyelination and axonal loss compared with CIS. Progressive MS had even more evidence of increased oedema, demyelination and axonal loss compared with CIS and RRMS.
Introduction
Magnetic resonance imaging (MRI) has become an indispensable tool for diagnosing and monitoring multiple sclerosis (MS). Conventional MRI is able to detect obvious areas of damage in the central nervous system, but it does not have the specificity to differentiate between the underlying tissue pathologies such as demyelination, axonal loss and gliosis. 1 Advanced MRI techniques are sensitive and specific to tissue microstructure changes, and give more information about the actual tissue damage in MS. There is an extensive literature on metrics derived from diffusion tensor imaging (DTI) and magnetization transfer imaging, which can quantify abnormalities in MS lesions and normal-appearing white matter (NAWM), and detect differences between MS subtypes with high sensitivity, but with low pathological specificity. 2
Other advanced MRI approaches may provide more specific information about tissue components, but have not, as of yet, been as widely applied in large studies or MS subtype analysis. Quantitative measurement of T2 relaxation 3 can determine the myelin water fraction (MWF), a histopathologically validated marker for myelin 4 which reflects the fraction of water between myelin layers, and the geometric mean T2 (GMT2), which reflects the T2 of intracellular and extracellular water and is related to tissue structure. T1 relaxation reflects overall water mobility and is closely related to water content (WC), which can be derived from T1 and T2 experiments. 5 Diffusion basis spectrum imaging (DBSI) employs a more sophisticated model than DTI to define anisotropic diffusion tensors (myelinated and unmyelinated axons) and isotropic diffusion tensors (cells and extracellular space) to quantify axonal injury, myelination, inflammation and oedema. 6 DBSI-derived metrics are proposed to more accurately describe MS pathology than DTI and include axial diffusivity (AD, axonal integrity),6,7 radial diffusivity (RD, modulated by myelin),6–8 fibre fraction (FF, density of axons), 8 isotropic restricted diffusion fraction (RF, changes in cellularity due to inflammation)6–9 and isotropic non-restricted diffusion fraction (non-RF, increases with vasogenic oedema). 9
The aforementioned more specific MRI approaches have been used to characterize MS pathology, reporting reduced MWF, 10 increased T1 11 and T2, 12 and abnormalities in DBSI-related metrics13–15 in lesions and NAWM. However, the majority of MWF reports are from relapsing–remitting MS (RRMS) subjects, and a comprehensive comparison between the different MS subtypes has not been reported. Furthermore, while DBSI has been applied to MS, the literature is very small.8,13–15 There are no studies examining DBSI and MWF in the same cohort.
We used quantitative metrics derived from relaxation and DBSI MRI to describe measures of neuroinflammation, myelin and axons in different MS subtypes. We quantified measures from whole brain (WB), NAWM, lesions and the corpus callosum (CC), a structure where damage is often detected in MS. 16 Also, the smaller CC size and more uniform tissue composition compared with NAWM and WB may make assessment of the CC more sensitive to tissue damage detection and differentiation between MS subtypes. Our observations report relative subtype differences, and we expected that, in comparison with participants with clinically isolated syndrome (CIS), MR metrics from progressive MS will show larger differences than the relapsing–remitting form of the disease. This is the largest MS-focused DBSI study to date, and we present our findings in comparison with literature established measures reflecting disease severity of lesion volume (LV), normalized brain volume (NBV) and cortical thickness (CTh).17,18
Methods
Participants
103 participants (20 CIS, 33 RRMS, 30 secondary progressive MS (SPMS) and 20 primary progressive MS (PPMS)) were studied (demographics in Table 1). The clinical research ethics board at our institution approved the study and all participants gave written informed consent. Due to funding constraints, healthy controls were not recruited for this study.
Participant demographics. Mean (range) for age and disease duration, and median (range) for EDSS are listed.
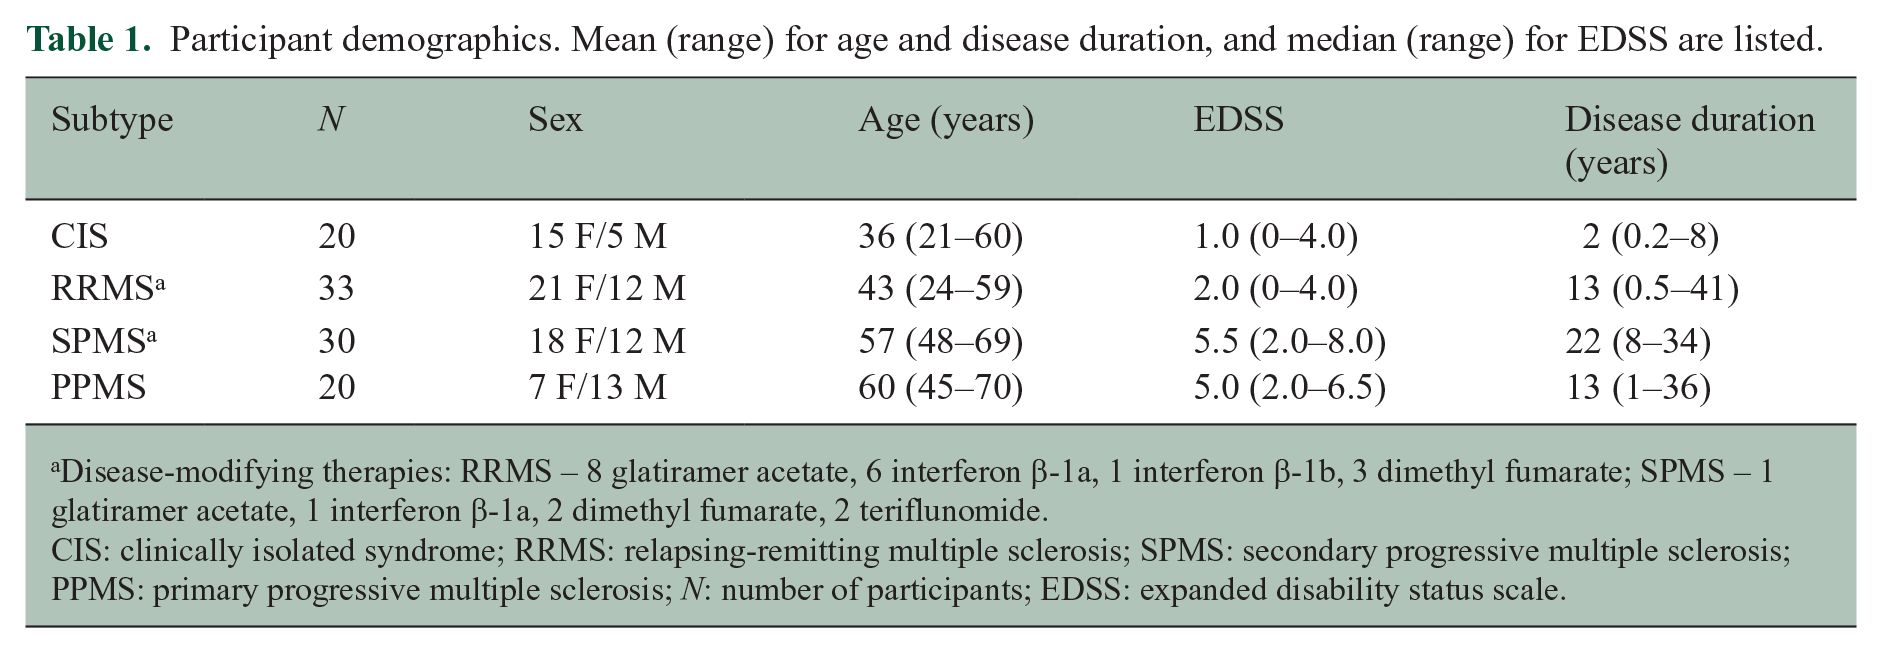
Disease-modifying therapies: RRMS – 8 glatiramer acetate, 6 interferon β-1a, 1 interferon β-1b, 3 dimethyl fumarate; SPMS – 1 glatiramer acetate, 1 interferon β-1a, 2 dimethyl fumarate, 2 teriflunomide.
CIS: clinically isolated syndrome; RRMS: relapsing-remitting multiple sclerosis; SPMS: secondary progressive multiple sclerosis; PPMS: primary progressive multiple sclerosis; N: number of participants; EDSS: expanded disability status scale.
MR Experiments
MRI data were acquired at 3.0T (Philips Achieva, The Netherlands). Scanning sequences included 48-echo GRAdient and Spin-Echo (GRASE) T2 relaxation (TR/TE = 1073/8 ms, acquired voxel size = 1 × 1 × 5 mm3 with slices = 20, reconstructed voxel size = 1 × 1 × 2.5 mm3 with slices = 40, SENSE factor = 2), inversion recovery T1 relaxation (TIs = 150, 400, 750, 1200, 2100 ms, TR/TE = 3000/3.2 ms, voxel size = 1 × 1 × 2.5 mm3, slices = 40), DBSI (99 directions, b values = 0–1500, TR/TE = 4798/79 ms, voxel size = 2 × 2 × 2 mm3, slices = 40), 6 structural proton density (PD)/T2-weighted (TR/TE = 2900/8.42/80 ms, voxel size = 1 × 1 × 3 mm3, slices = 54) and 3D T1-MPRAGE (TR/TE = 3000/3.5 ms, TI = 926ms, voxel size = 1 × 1 × 1 mm3, slices = 150).
Data Analysis
Voxel-wise T2 distributions were calculated using a modified extended phase graph algorithm combined with regularized non-negative least squares and flip angle optimization (https://mriresearch.med.ubc.ca/news-projects/myelin-water-fraction/).19,20 MWF was the fraction of signal with T2 <40 ms. GMT2 of the intra/extracellular water pool was calculated for T2 values between 40 and 200 ms. T1 was fit to a single exponential using in-house software. WC was calculated using the reference method. 21 DBSI data were analysed with in-house software (MATLAB, The MathWorks, Inc., Natick, MA) to calculate FF, AD, RD, RF and non-RF maps. 6 For each participant, the 15th echo of the GRASE and the B0 image of the DBSI scans were registered to the T2-weighted image using the correlation ratio cost function with 9 degrees of freedom (FLIRT, FSL toolbox). 22 The 3DT1 and TI = 150 ms inversion recovery images were registered to the PD-weighted image using the correlation ratio cost function with 9 degrees of freedom (FLIRT, FSL toolbox). 22 Each registration was manually checked for quality. Registration matrices were then applied to the quantitative MR images (MWF, T1 relaxation, WC, GMT2 and DBSI-derived metrics) to bring them into PD/T2-weighted space.
Regions of interest
WB masks were created from the registered 3DT1 images using brain extraction from the advanced normalization tools (ANTs). 23 NAWM masks were created using FSL FAST 24 on the registered 3DT1. NAWM masks were eroded using a 2D kernel with a 3 × 3 box (fslmaths, FSL toolbox) 22 to account for partial volume. Lesions were identified on the PD/T2 images by an experienced radiologist, labelled with seed points and then automatically segmented. 25 Cerebrospinal fluid (CSF) masks were generated from segmenting the T2-weighted images with FAST. 24 These CSF masks were then subtracted from the NAWM masks to remove voxels with CSF contamination. Lesion masks were also subtracted from the NAWM masks. The registered 3DT1 images were registered to the Montreal Neurological Institute (MNI) atlas using FMRIB’s nonlinear image registration tool (FNIRT) 22 and then the inverse registration matrix was applied to the Johns Hopkins University (JHU) atlas CC regions of interest (ROI) in PD/T2-weighted space. Because the CC is located next to the ventricles, a CSF mask created with the B0 DBSI image was also subtracted from the CC mask. The DBSI image was used to account for echo planar imaging (EPI) distortions which may slightly shift the boundaries of the CSF. Masks were overlaid onto registered MWF, GMT2, T1, WC and DBSI-derived metric maps to obtain mean measurements.
Volumetrics
NBV was determined by a combination of the FSL tools FAST and FIRST applied to the 3DT1 images.22,24 CTh was calculated from the 3DT1 images using antsCorticalThickness (ANTs). 23 LV was defined as the summation of all lesion mask voxels. Due to large differences between subtypes, the log of the LV was used in the comparison analysis
Statistics
For each MR measurement, differences between CIS, RRMS, SPMS and PPMS were calculated using an analysis of covariance (ANCOVA) with age as a covariate. Subsequent pair-wise comparisons were done with a post hoc Bonferroni correction. Adjusted p-values <0.05 were considered significant.
Results
Example images of each MRI metric are shown in Figure 1. Boxplots for different regions divided by MS subtype are displayed in Figure 2 with significant differences between subtypes indicated. Mean metric values for different MS subtypes from WB, NAWM, lesions and CC are included as supplemental material (Supplemental Tables 1–4). Volumetric measurements for each subtype are shown in Figure 3 and volume metrics are included as supplemental material (Supplemental Table 5). Advanced imaging results are presented based on metric interpretation into neuroinflammation (GMT2, T1, WC, RF and non-RF), myelin (MWF and RD) and axons (FF and AD).
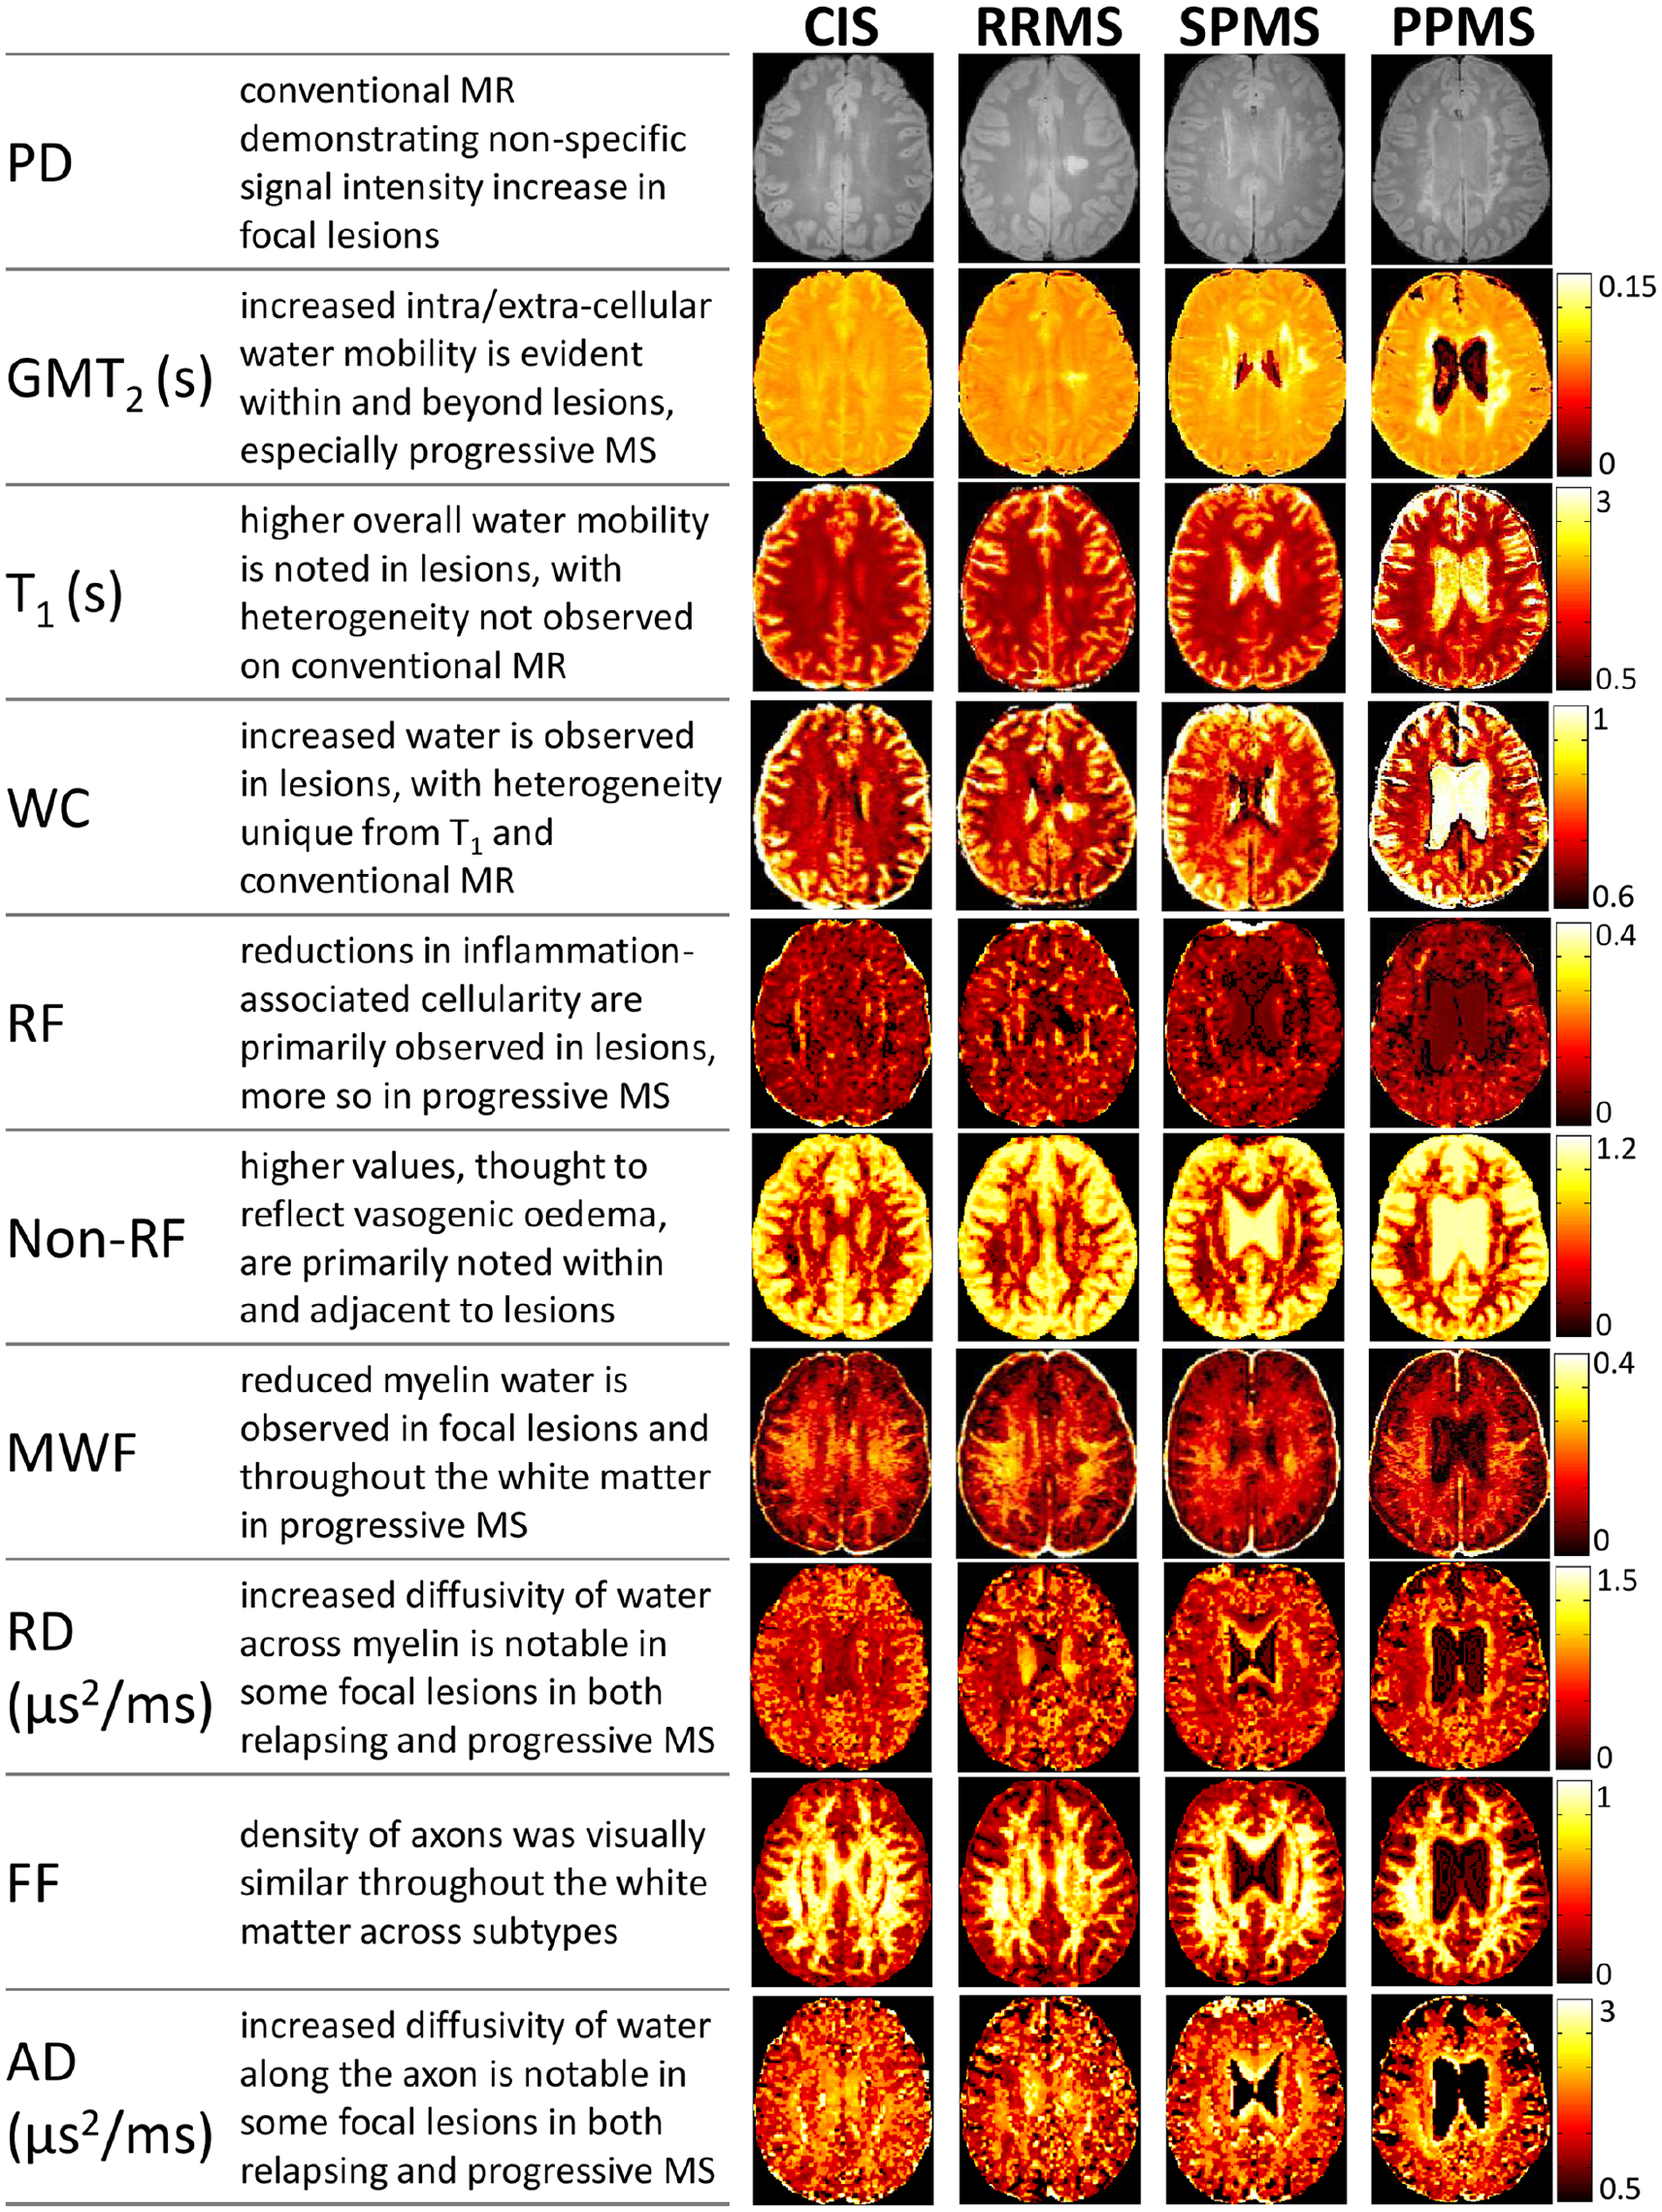
Example images of the MR measures (proton density (PD), geometric mean T2 (GMT2), T1, water content (WC), restricted fraction (RF), non-restricted fraction (non-RF), myelin water fraction (MWF), radial diffusivity (RD), fibre fraction (FF), and axial diffusivity (AD)) for each subtype (clinically isolated syndrome (CIS), relapsing-remitting MS (RRMS), secondary progressive MS (SPMS) and primary progressive MS (PPMS)).
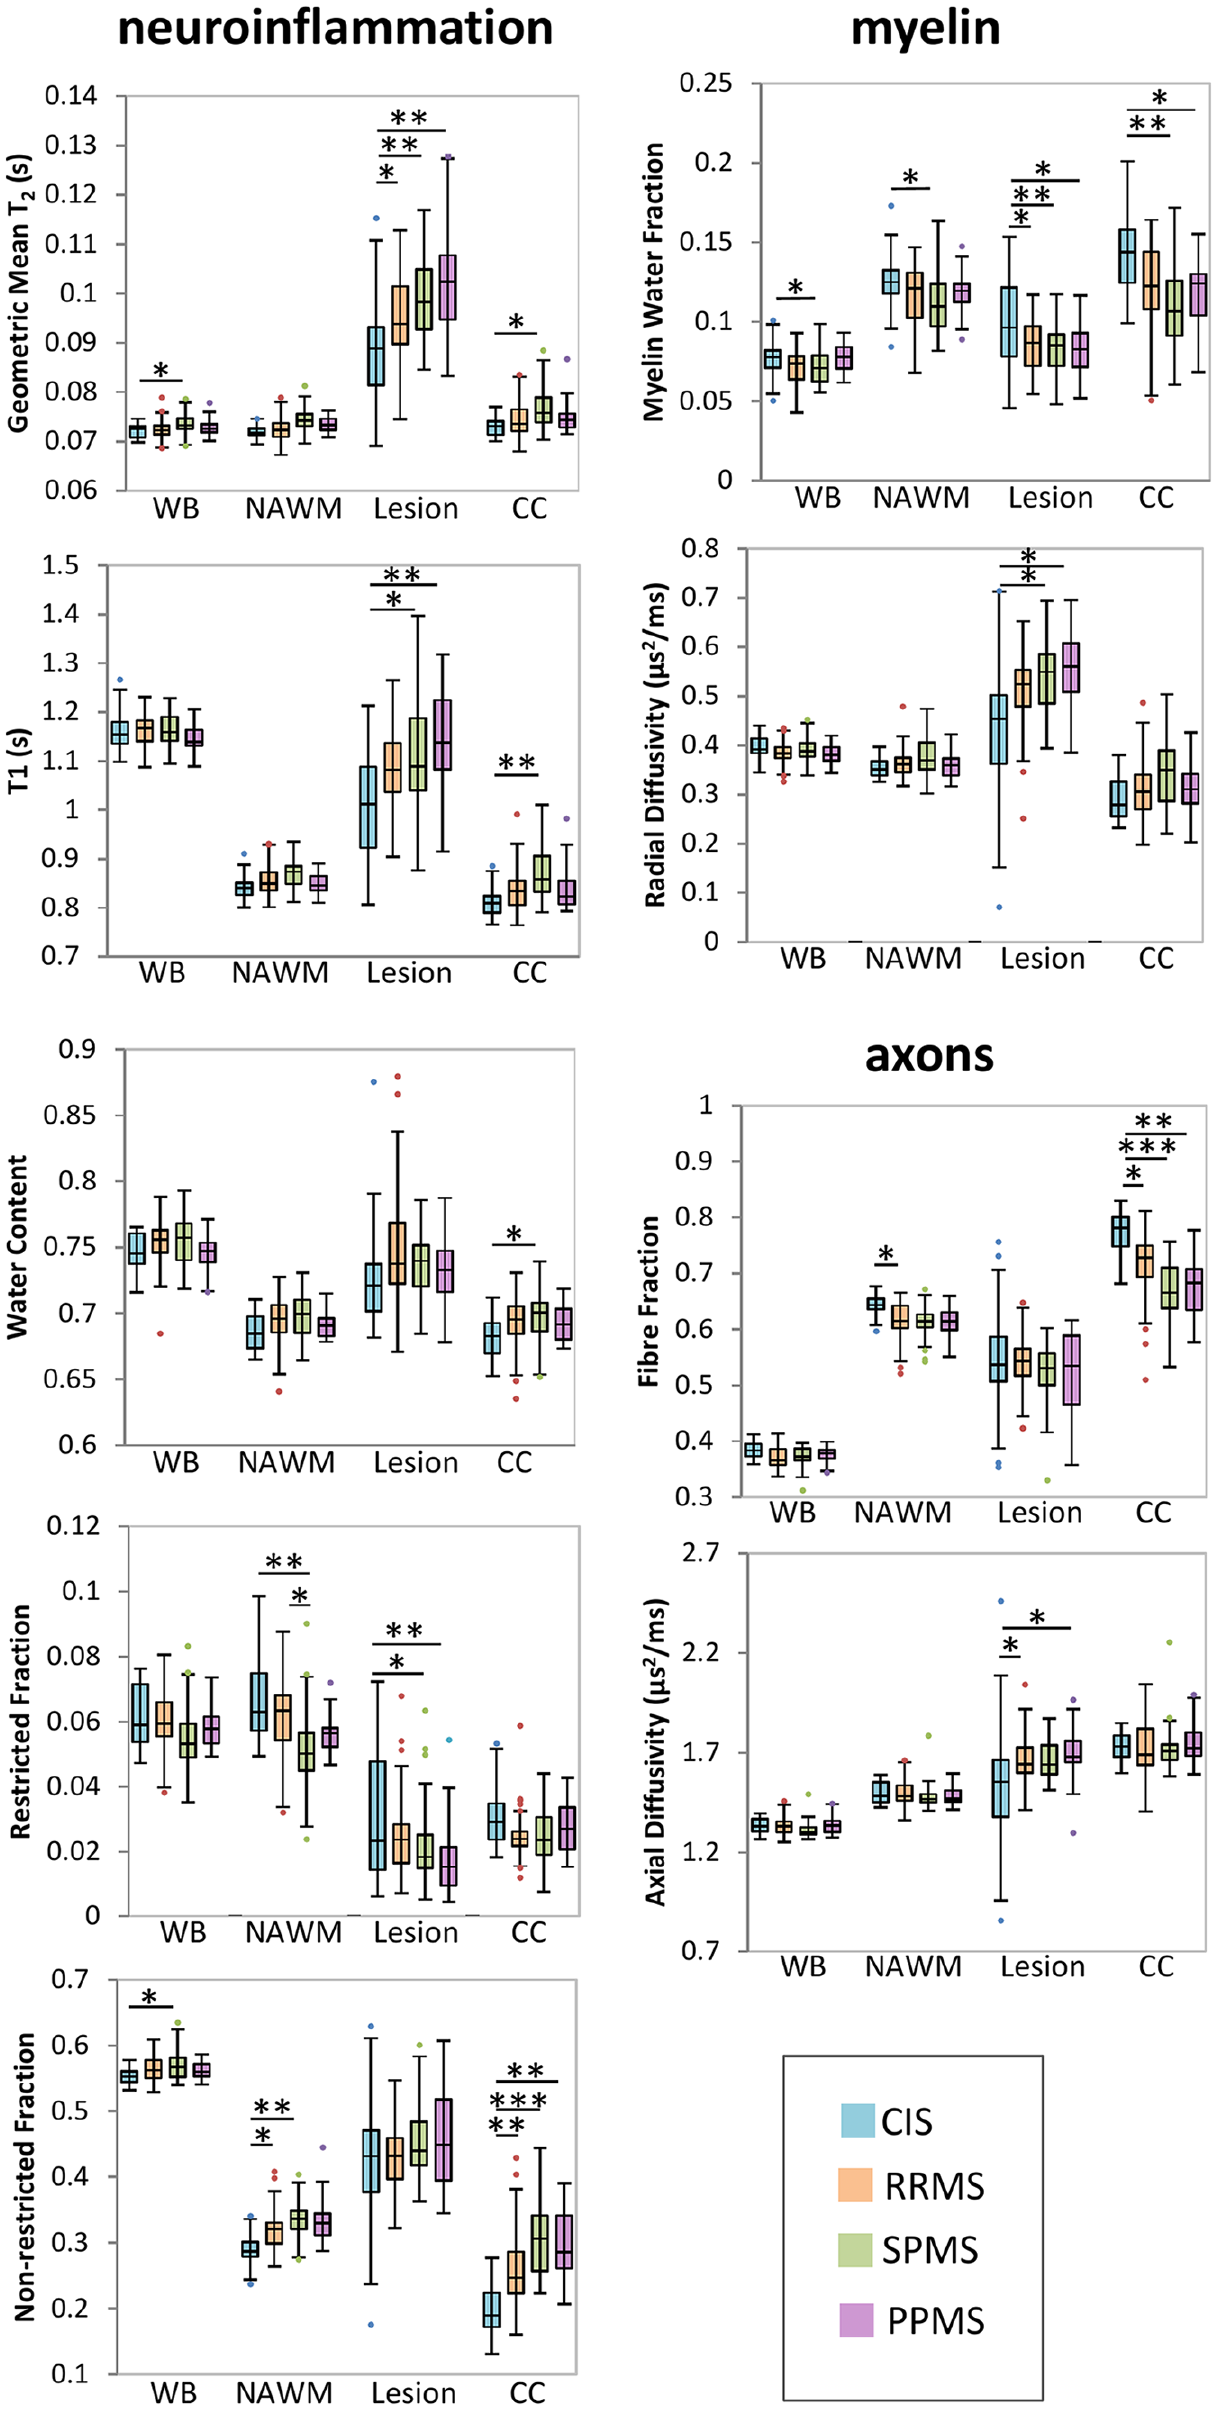
Boxplots of each measurement over four regions of interest (whole brain (WB), normal appearing white matter (NAWM), lesions and corpus callosum (CC)) for the different subtypes (clinically isolated syndrome (CIS), relapsing-remitting MS (RRMS), secondary progressive MS (SPMS) and primary progressive MS (PPMS)). Lines connecting boxplots indicate significant differences with p-values of *<0.05, **<0.005 and ***<0.0005.
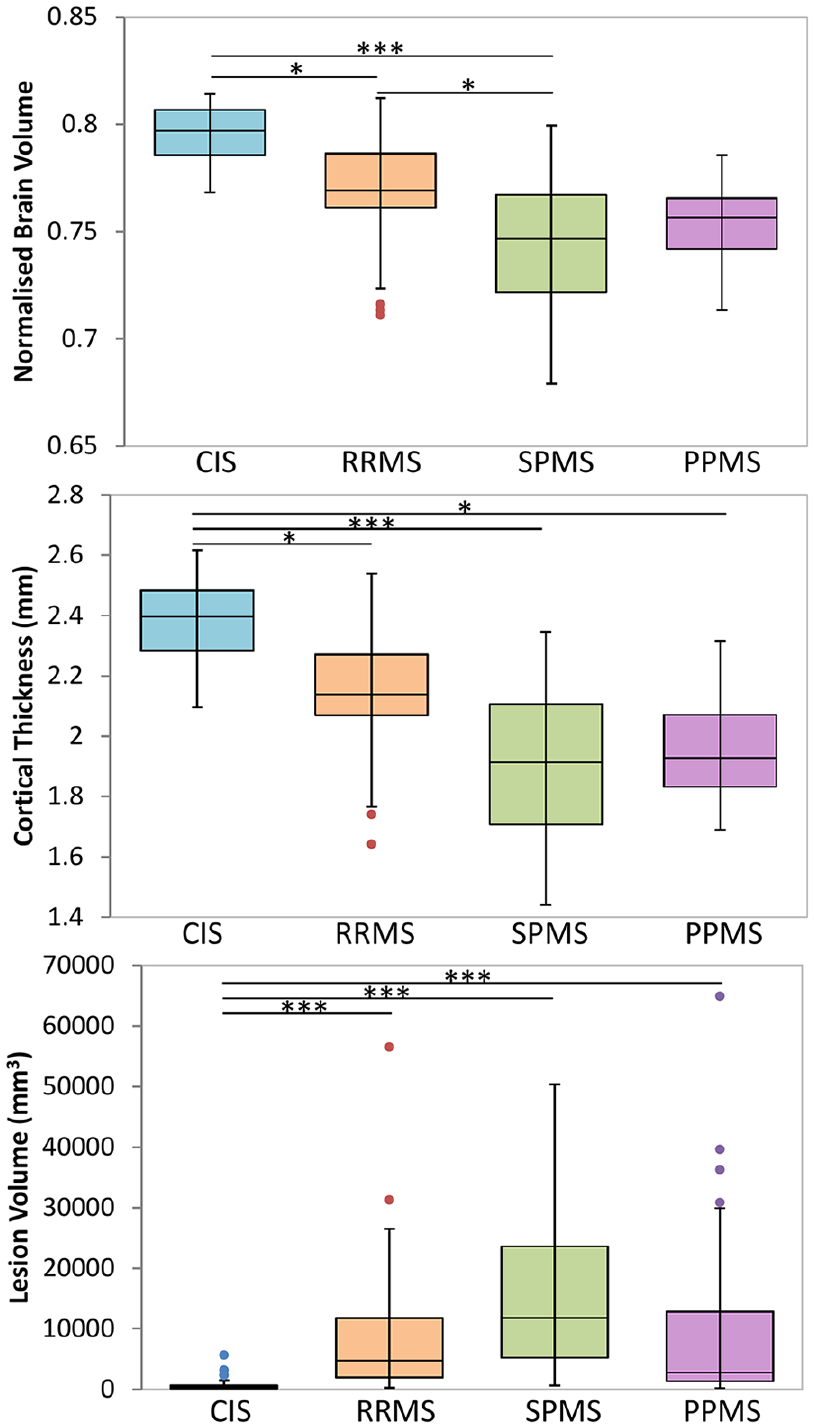
Boxplots of volumetric measurements for the different subtypes (clinically isolated syndrome (CIS), relapsing-remitting MS (RRMS), secondary progressive MS (SPMS) and primary progressive MS (PPMS)). Lines connecting boxplots indicate significant differences with p-values of *<0.05, **<0.005 and ***<0.0005.
In general, a gradation of values was seen from CIS to RRMS to progressive MS (SPMS and PPMS) with numerous significant differences between CIS and progressive MS and fewer differences between CIS and RRMS, and RRMS and progressive MS.
CIS versus RRMS
Relative to CIS, increases were found in neuroinflammation-related markers within white matter, WC within the CC and water mobility within lesions. The neuroinflammation-related marker non-RF was increased in RRMS NAWM (+11%) and CC (+33%) and trending in RRMS WB (+2.4%, p = 0.09). Water mobility in RRMS lesions was also higher with increased GMT2 (+8.0%) and trending T1 (+6.6%, p = 0.09). Water content showed an increasing trend in RRMS CC (+1.6%, p = 0.10).
RRMS CC and lesions demonstrated greater myelin damage and NAWM, CC and lesions showed more axonal damage than CIS. Lesions had reduced MWF (–14.0%), and a trend for increased RD (+14.0%, p = 0.08). RRMS CC MWF also showed a trend-level reduction in MWF (–14.6%, p = 0.06). Evidence of axonal damage was characterized by reduced FF in NAWM (–4.2%) and the CC (–7.8%), and increased AD in RRMS lesions (+8.5%).
Volumetric analysis revealed that, relative to CIS, RRMS showed reduced NBV (–3.3%), CTh (–9.7%) and increased LV (+900%).
CIS versus PPMS
Numerous neuroinflammation and myelin- and axonal-related differences were found between CIS and PPMS. Water mobility was increased and cellularity decreased in PPMS lesions. In PPMS, oedema was increased in both NAWM and CC. GMT2, reflecting water mobility, was increased in PPMS lesions (+14.8%). T1, also related to water mobility, was higher in PPMS lesions (+12.9%). DBSI-derived RF, a measure of cellularity due to inflammation, was decreased in PPMS lesions (–40.6%). Non-RF, linked to oedema, was higher in PPMS CC (+49%) and trending in PPMS NAWM (+14.2%, p = 0.05).
In CC and lesions, MR measures suggested increased myelin and axonal damage in PPMS. MWF was lower in PPMS CC (–18%) and PPMS lesions (–18%), relative to matched CIS tissue. RD, the other myelin-related metric, was increased in PPMS lesions (+23%). FF was lower in PPMS CC (–12%), while AD, linked to residual axonal integrity, was higher in PPMS lesions (+11%).
Volumetric analysis revealed that PPMS showed reduced CTh (–7.1%) and trended for reduced NBV (–3.5%, p = 0.06). LV was increased by more than 100% in PPMS compared with CIS.
RRMS versus SPMS
Relative to RRMS, SPMS showed reduced cellularity due to inflammation and increased water mobility. Reduced NAWM RF (–17%), and trends for increased CC GMT2 (+3.0%, p = 0.09) and CC T1 (+3.8%, p = 0.07) were measured in SPMS.
Volumetric analysis found that relative to RRMS, SPMS showed reduced NBV (–3.6%) and trended towards a reduced CTh (–11.2%, p = 0.07).
SPMS versus PPMS
Only one trend was found, namely, an increase in water mobility in NAWM. NAWM T1 in SPMS was increased compared with PPMS (+2.6%, p = 0.09).
Discussion
Advanced MRI approaches with improved specificity for different aspects of tissue microstructure may help in differentiating damage due to neuroinflammation, more prominent in RRMS, from neurodegeneration, believed to be a larger contributor in progressive forms of the disease. 26 Some RRMS treatments are highly efficacious in reducing relapse risk and new MRI lesions, but existing treatments for reducing confirmed disability progression in inactive progressive MS have demonstrated underwhelming efficacy. Biomarkers of neurodegeneration will aid in the discovery and validation of future MS therapies needed to halt disease progression. Volumetric analysis can provide some information about tissue changes, and our findings were as expected17,18 with more atrophy, smaller CTh and higher LV in the later stages of disease. The ranking of subtypes from largest to smallest brain volume and CTh was CIS → RRMS → progressive MS, with similar NBV and CTh for SPMS and PPMS. However, volume measures lack specificity to the underlying tissue loss responsible for reductions in tissue size. Our study provides evidence that non-invasive measurement of inflammation, myelin and axons can detect different degrees of damage across MS subtypes. In this study, MWF, a marker of myelin content, was able to discern the largest number of subtype tissue differences (7), followed closely by the neuroinflammation-related marker non-RF (6), although these metrics provided complementary, rather than overlapping information.
Neuroinflammation, oedema and WC
Neuroinflammatory-related MR metrics included GMT2, T1, WC and DBSI-derived isotropic RF (inflammatory cells) and isotropic non-RF (oedema). Relative to CIS, abnormal levels of all markers were observed to some extent for the tissue and MS subtypes examined. Non-RF provided MS subtype differentiation for NAWM and the CC, suggesting a global, increasing level of oedema from CIS to RRMS to SPMS in alignment with previous work showing increased non-RF in SPMS CC relative to RRMS. 27 Increased non-RF has been reported in MS lesions, 8 but no subtype differences were observed in our study. GMT2, reflecting general water mobility in intracellular and extracellular spaces, was, however, sensitive to differences in lesion pathology between MS subtypes, with the highest values in progressive MS. This work supports previous work in RRMS and SPMS reporting increased GMT2 in MS NAWM and lesions, but differences between subtypes were not described. 12 Detection of differences in neuroinflammation between subtypes was most frequent with non-RF in the WB and NAWM. In lesions, non-RF was not different between subtypes and instead GMT2 and T1 were the best discriminators. The large variation in CIS lesion non-RF was likely a factor in this lack of difference between subtypes.
T1 relaxation highlighted differences in NAWM between CIS and SPMS, but not RRMS, in alignment with Castriota-Scanderbeg et al., 28 who reported higher T1 in SPMS, but not in RRMS, compared with healthy controls. In brain, 1/T1 is linearly proportional to 1/WC.5,29 Our measure of WC agreed with T1 in highlighting differences between CIS and SPMS WB, NAWM and CC. Interestingly, lesion T1 increased from CIS to RRMS to SPMS, but this pattern was not observed for WC, suggesting that an upper limit of WC may be reached for lesions, but T1-related increases may continue with MS progression in lesions. PPMS NAWM showed trends for increased non-RF compared with CIS, but decreased T1 compared with SPMS; these trends indicate that the extent of oedema in PPMS is worse than in CIS, but less than in SPMS.
The RF highlighted differences between subtype NAWM with a gradation from CIS to RRMS to progressive MS. RF reflects water molecules residing inside or between inflammatory cells exhibiting limited movement that appears as isotropic restricted diffusion. Thus, an RF increase can reflect activation of endogenous macrophages and/or microglia, as well as infiltration of peripheral macrophages, in white matter tracts. Studies in preclinical models6,7,9 and autopsied spinal cord 8 found RF correlated positively with increased cellularity. Previous work suggests that lesion RF was one of the most important DBSI metrics for separating MS subtypes. 14 Our study showed significant differences in lesion RF between CIS and both progressive MS subtypes, possibly related to the inflammatory nature of early lesions compared to chronic lesions. 30 In lesions, the sensitivity of RF to inflammation is confounded by the increase in free diffusing water content resulting from vasogenic oedema or axonal loss. However, from previous studies, RF is more sensitive to acute inflammation,6–9 although an exact underlying mechanism remains to be determined. Unlike a previous post-mortem study which found increased inflammation in progressive MS NAWM, 31 we found a lower RF in SPMS compared with RRMS. Differences in the number of study participants, range of EDSS and age from previous studies may contribute to these discrepancies.
Myelin
Myelin-related metrics examined were MWF and DBSI-determined RD. MWF was particularly sensitive to subtype differences in lesion and CC myelin, and was able to detect more differences than RD. MWF and RD both demonstrated differences in CIS versus SPMS NAWM, and CIS versus progressive MS lesions. These observations are supported by previous studies which report reduced MWF in MS NAWM and lesions10,32,33 as well as reduced NAWM myelin content in histopathological studies.1,26 Our findings are also in line with reports that SPMS and RRMS with >5 years of disease duration showed lower NAWM MWF compared with CIS and RRMS with < 5 years of disease duration. 32 We did not detect any MWF difference between RRMS and SPMS, in contrast to work reporting lower WB MWF in SPMS (n = 23) versus RRMS (n = 134); 34 this discrepancy may be due to the much larger RRMS study population in the previous study. Although only a trend for CC RD subtype differences were found, previous work using a nonparametric decision tree-based regression and classification method suggests that RD (as well as FF and non-RF) in CC NAWM may be important in distinguishing MS subtypes. 14 Lesions from all MS subtypes showed lower myelin content than CIS lesions. A histology study comparing lesion remyelination in different MS subtypes showed that RRMS had the largest fraction of remyelinated lesions, 35 which may indicate a greater capacity for repair in earlier stages of MS.
The relationship between both proposed myelin markers and myelin content are supported by pathological studies. MWF is correlated with histological staining of myelin,4,36 providing evidence that MWF is a measure for myelin content. Correlations between DBSI-derived RD and demyelination were found in preclinical studies,6,7,9 post-mortem spinal cord 8 and biopsied MS lesion, 15 also supporting the relationship between RD and myelin. In the present study, both MWF and RD were sensitive to severe myelin loss as found in lesions; however, in more subtle areas of demyelination, such as NAWM, MWF was better able to detect differences.
Axons
Axonal descriptors stem from DBSI modelling which yielded FF and AD. FF was particularly sensitive to subtype differences in the CC, highlighting this measure for detection of subtle variations related to axonal density. This observation is in alignment with studies showing more progressive MS has greater axonal loss 26 and that CC FF (along with non-RF and RD) helps differentiate subtypes. 14 FF in lesions was also demonstrated to differentiate MS subtypes, particularly PPMS and RRMS; 14 however, our study found no difference in lesion FF between subtypes (although there was a non-significant decrease in FF for all MS subtypes compared with CIS). The large variation in FF within CIS lesions may have prevented the detection of differences with MS lesions. Lesion differences in AD were, however, demonstrated between CIS and PPMS, and CIS and RRMS, as well as a trend between CIS and SPMS, with progressive MS lesions showing greater axonal abnormality than RRMS lesions. The interpretation of both FF and AD as axonal-related measures have some histological validation support, with previous DBSI studies reporting decreased AD with acute axonal injury 37 and a positive correlation between FF and axonal density.9,15 Characterizing axon content differences seems best done with FF, unless there is a large tissue variation between participants, such as within lesions.
Limitations
By including a control group, the results could determine at which point in the disease course abnormalities of each metric are starting to occur and which metric is best at monitoring the progressive changes. To surmount this shortcoming, our findings are instead presented in the context of the gradation across the MS spectrum with CIS, the earliest stage of MS, serving as the baseline. Comparison of differences in MWF and DBSI-derived metrics between MS subtypes has not previously been described so even without a healthy control cohort, this dataset is valuable. This is the largest MS DBSI study to date, and one of the largest T2-based myelin water imaging reports in MS, however, the smaller number of participants with CIS and PPMS may have made it more difficult to detect differences in those subtypes. The different subtypes will also differ in age which is intrinsically linked to the different MS phenotypes. Although we have not found large changes in MWF with age in healthy adults, 38 we did account for the effect of age in our study.
Seventeen of our 33 RRMS and six of our 30 SPMS participants were on first-line disease-modifying therapies which can have an effect on neuroinflammation. This suppression of inflammation may have resulted in fewer detected differences between RRMS and CIS as well as increasing the variability in neuroinflammation-related MR measures within the RRMS and SPMS cohorts.
Our inclusion of the CC ROI was intended to examine a significant white matter structure known to be affected in MS. 16 Lesions were not excluded in the CC ROI as we wanted to compare measurements taken from the whole structure regardless of the presence of lesions or any other subtle abnormalities. The integrity of the whole structure, including both normal-appearing and lesional tissue should impact CC function which will be tied to clinical performance.
For DBSI metrics, EPI distortions affected the quality of the registration. The CC mask was most affected since the CC is both close to the ventricles and has a small size. To help mitigate this problem, a CSF mask generated from the DBSI B0 image was subtracted from the CC mask to make sure that CSF contamination was removed even with DBSI distortions.
Finally, it is also worth noting that while the quantitative MR measures reported are classified based on metric assignments to neuroinflammation, myelin and axons, these metrics may be influenced by numerous factors which can confound results and interpretation. Brain tissue microstructure and alterations with MS pathology are highly complex; a multi-modality approach like the one used here, where several different quantitative MR methods are used to assess the same tissue component (e.g. myelin with both T2 relaxation and diffusion), is recommended to increase confidence in results and highlight discrepancies due to confounding factors. The MR measurements themselves can also be correlated39–41 and also be sensitive to more than one pathology. Therefore, it is possible that the interpretation of MR differences could be biased due to a change in pathology causing a secondary change to an MR measurement (e.g. an increase in WC will directly affect T1 and WC and may also dilute the number of axons in a voxel causing FF to seemingly decrease).
In summary, advanced imaging can show differences between MS subtypes related to underlying tissue damage. This is the first study to use both T2 relaxation and DBSI in MS, and the largest MS DBSI study to date. An increasing gradation of neuroinflammation- and neurodegenerative-related metrics was seen from CIS to RRMS to progressive MS. A multi-modality approach using T1, T2 and DBSI can provide information about inflammatory and neurodegenerative processes across the spectrum of MS which may be useful for assessing therapies targeting specific types of damage occurring in the disease.
Supplemental Material
sj-pdf-1-msj-10.1177_13524585211023345 – Supplemental material for Characterization of multiple sclerosis neuroinflammation and neurodegeneration with relaxation and diffusion basis spectrum imaging
Supplemental material, sj-pdf-1-msj-10.1177_13524585211023345 for Characterization of multiple sclerosis neuroinflammation and neurodegeneration with relaxation and diffusion basis spectrum imaging by Irene M Vavasour, Peng Sun, Carina Graf, Jackie T Yik, Shannon H Kolind, David KB Li, Roger Tam, Ana-Luiza Sayao, Alice Schabas, Virginia Devonshire, Robert Carruthers, Anthony Traboulsee, GR Wayne Moore, Sheng-Kwei Song and Cornelia Laule in Multiple Sclerosis Journal
Supplemental Material
sj-pdf-2-msj-10.1177_13524585211023345 – Supplemental material for Characterization of multiple sclerosis neuroinflammation and neurodegeneration with relaxation and diffusion basis spectrum imaging
Supplemental material, sj-pdf-2-msj-10.1177_13524585211023345 for Characterization of multiple sclerosis neuroinflammation and neurodegeneration with relaxation and diffusion basis spectrum imaging by Irene M Vavasour, Peng Sun, Carina Graf, Jackie T Yik, Shannon H Kolind, David KB Li, Roger Tam, Ana-Luiza Sayao, Alice Schabas, Virginia Devonshire, Robert Carruthers, Anthony Traboulsee, GR Wayne Moore, Sheng-Kwei Song and Cornelia Laule in Multiple Sclerosis Journal
Supplemental Material
sj-pdf-3-msj-10.1177_13524585211023345 – Supplemental material for Characterization of multiple sclerosis neuroinflammation and neurodegeneration with relaxation and diffusion basis spectrum imaging
Supplemental material, sj-pdf-3-msj-10.1177_13524585211023345 for Characterization of multiple sclerosis neuroinflammation and neurodegeneration with relaxation and diffusion basis spectrum imaging by Irene M Vavasour, Peng Sun, Carina Graf, Jackie T Yik, Shannon H Kolind, David KB Li, Roger Tam, Ana-Luiza Sayao, Alice Schabas, Virginia Devonshire, Robert Carruthers, Anthony Traboulsee, GR Wayne Moore, Sheng-Kwei Song and Cornelia Laule in Multiple Sclerosis Journal
Supplemental Material
sj-pdf-4-msj-10.1177_13524585211023345 – Supplemental material for Characterization of multiple sclerosis neuroinflammation and neurodegeneration with relaxation and diffusion basis spectrum imaging
Supplemental material, sj-pdf-4-msj-10.1177_13524585211023345 for Characterization of multiple sclerosis neuroinflammation and neurodegeneration with relaxation and diffusion basis spectrum imaging by Irene M Vavasour, Peng Sun, Carina Graf, Jackie T Yik, Shannon H Kolind, David KB Li, Roger Tam, Ana-Luiza Sayao, Alice Schabas, Virginia Devonshire, Robert Carruthers, Anthony Traboulsee, GR Wayne Moore, Sheng-Kwei Song and Cornelia Laule in Multiple Sclerosis Journal
Supplemental Material
sj-pdf-5-msj-10.1177_13524585211023345 – Supplemental material for Characterization of multiple sclerosis neuroinflammation and neurodegeneration with relaxation and diffusion basis spectrum imaging
Supplemental material, sj-pdf-5-msj-10.1177_13524585211023345 for Characterization of multiple sclerosis neuroinflammation and neurodegeneration with relaxation and diffusion basis spectrum imaging by Irene M Vavasour, Peng Sun, Carina Graf, Jackie T Yik, Shannon H Kolind, David KB Li, Roger Tam, Ana-Luiza Sayao, Alice Schabas, Virginia Devonshire, Robert Carruthers, Anthony Traboulsee, GR Wayne Moore, Sheng-Kwei Song and Cornelia Laule in Multiple Sclerosis Journal
Footnotes
Acknowledgements
The authors thank the study participants, the UBC MS clinic staff and the MRI technologists at the UBC MRI Research Centre. They gratefully acknowledge the support of Philips Healthcare.
Declaration of Conflicting Interests
The author(s) declared the following potential conflicts of interest with respect to the research, authorship and/or publication of this article: I.M.V., P.S., C.G. and J.T.Y. have nothing to disclose. S.H.K. has received research support from Roche, Genzyme, the MS Society of Canada, NSERC, VCHRI, MSFHR and Milan & Maureen Ilich Foundation; consulting for Novartis. D.K.B.L. has received research funding from the Multiple Sclerosis Society of Canada. He is Emeritus Director of the UBC MS/MRI Research Group that has been contracted to perform central analysis of MRI scans for therapeutic trials with Roche and Sanofi-Genzyme. The UBC MS/MRI Research Group has also received grant support for investigator-initiated studies from Genzyme, Novartis and Roche. He has been a consultant to Vertex Pharmaceuticals and Genzyme, served on the Scientific Advisory Board for Celgene and the PML-MS Steering Committee for Biogen He has given lectures, supported by non-restricted education grants from Academy of Health Care Learning, Consortium of MS Centers and Sanofi-Genzyme. R.T. has received grant funding from NSERC, MS Society of Canada, and Mitacs, and research support as part of sponsored clinical studies from Novartis, Roche, and Sanofi-Genzyme. A.-L.S. has received speaking honoraria from Biogen and Merck-Serono. She has participated in Ad-boards for Biogen, Teva, Roche, Novartis, Sanofi-Genzyme and Merck-Serono. AS has received honoraria from Teva, Biogen, and Sanofi-Genzyme, Novartis, Roche, EMD Serono and Biogen. V.D. has received honorarium from Sanofi, MD Serono, Biogen and Roche. R.C. is site investigator for studies funded by Roche, Novartis, MedImmune and EMD Serono and receives research support from Teva Innovation Canada, Roche Canada and Vancouver Coastal Health Research Institute. R.C. has received honoraria from Roche, EMD Serono, Sanofi, Biogen, Novartis and Teva. A.T. has received research funding from MS Society of Canada, Roche and Sanofi-Genzyme; received honoraria or travel support from Consortium of MS Centers, Biogen, Teva, Roche, Merck/EMD Serono and Sanofi-Genzyme. G.R.W.M. has received funding support from the Multiple Sclerosis Society of Canada and the International Collaboration on Repair Discoveries. S.-K.S. and/or W.U. has a financial (ownership) interest in Cancer Research LLC and may financially benefit if the company is successful in marketing its product(s) that is/are related to this research. C.L. has research support from Natural Sciences and Engineering Research Council of Canada, the MS Society of Canada and the International Collaboration on Repair Discoveries.
Funding
The author(s) disclosed receipt of the following financial support for the research, authorship, and/or publication of this article: This work was supported by the Multiple Sclerosis Society of Canada (grant number: 2302)
Supplemental Material
Supplemental material for this article is available online.
References
Supplementary Material
Please find the following supplemental material available below.
For Open Access articles published under a Creative Commons License, all supplemental material carries the same license as the article it is associated with.
For non-Open Access articles published, all supplemental material carries a non-exclusive license, and permission requests for re-use of supplemental material or any part of supplemental material shall be sent directly to the copyright owner as specified in the copyright notice associated with the article.