
Abstract
Background:
Identifying magnetic resonance imaging (MRI) markers in myelin-oligodendrocytes-glycoprotein antibody-associated disease (MOGAD), neuromyelitis optica spectrum disorder-aquaporin-4 positive (NMOSD-AQP4) and multiple sclerosis (MS) is essential for establishing objective outcome measures.
Objectives:
To quantify imaging patterns of central nervous system (CNS) damage in MOGAD during the remission stage, and to compare it with NMOSD-AQP4 and MS.
Methods:
20 MOGAD, 19 NMOSD-AQP4, 18 MS in remission with brain or spinal cord involvement and 18 healthy controls (HC) were recruited. Volumetrics, lesions and cortical lesions, diffusion-imaging measures, were analysed.
Results:
Deep grey matter volumes were lower in MOGAD (p = 0.02) and MS (p = 0.0001), compared to HC and were strongly correlated with current lesion volume (MOGAD R = −0.93, p < 0.001, MS R = −0.65, p = 0.0034). Cortical/juxtacortical lesions were seen in a minority of MOGAD, in a majority of MS and in none of NMOSD-AQP4. Non-lesional tissue fractional anisotropy (FA) was only reduced in MS (p = 0.01), although focal reductions were noted in NMOSD-AQP4, reflecting mainly optic nerve and corticospinal tract pathways.
Conclusion:
MOGAD patients are left with grey matter damage, and this may be related to persistent white matter lesions. NMOSD-AQP4 patients showed a relative sparing of deep grey matter volumes, but reduced non-lesional tissue FA. Observations from our study can be used to identify new markers of damage for future multicentre studies.
Introduction
Recently, two new antibody-mediated central nervous system (CNS) diseases, previously been thought to be multiple sclerosis (MS) variants, have been identified. The first, aquaporin-4-antibody (AQP4-Ab) disease, 1 is a primary astrocytopathy and is recognised to be the major cause of the neuromyelitis optica spectrum disorders (NMOSD).2,3 Myelin oligodentrocyte glycoprotein (MOG) antibody, targeting myelin, is associated with a wider clinical phenotype.4,5
Brain lesions, reported in up to 60% of NMOSD-AQP4 patients, 6 can be difficult to distinguish from MOG antibody-associated disease (MOGAD); 7 however, using conventional magnetic resonance imaging (MRI), the presence of typical MS lesions, may help in differentiating it from the antibody disorders. 7
The presence of occult white and grey matter damage in MS, detected using non-conventional MRI, is well-known, while opinion varies as to whether NMOSD-AQP4 causes normal-appearing white and grey matter abnormalities and atrophy8–12 Non-conventional volumetric and diffusion imaging data in MOGAD are scarce. 13
Furthermore, in contrast to MS, MOGAD and NMOSD-AQP4 do not have a progressive stage; therefore, identifying differences between antibody-mediated conditions and MS may provide clues as to what is driving the progressive neurodegenerative process in MS.
The main aims of our study are to use volumetrics, lesion analysis and DTI measures to: (a) to identify different pattern of CNS damage in the three diseases and (b) to quantify the damage during the remission stage.
Materials and methods
Further details of patients’ enrolment, clinical assessment, MRI imaging analysis are in Supplementary Materials and Methods.
Patients
A total of 20 MOGAD, 19 NMOSD-AQP4, 18 relapsing remitting MS and 18 healthy controls (HC) over the age of 18 consented to the study (REC 17/EE/0246; Table 1). Patients were recruited if they were at least 6 months downstream of an acute attack and had a brain or spinal cord involvement, with or without optic neuritis (ON). All patients with NMOSD-AQP4 and MOGAD had positive antibodies.
Baseline clinical and demographic characteristics of the enrolled participants.
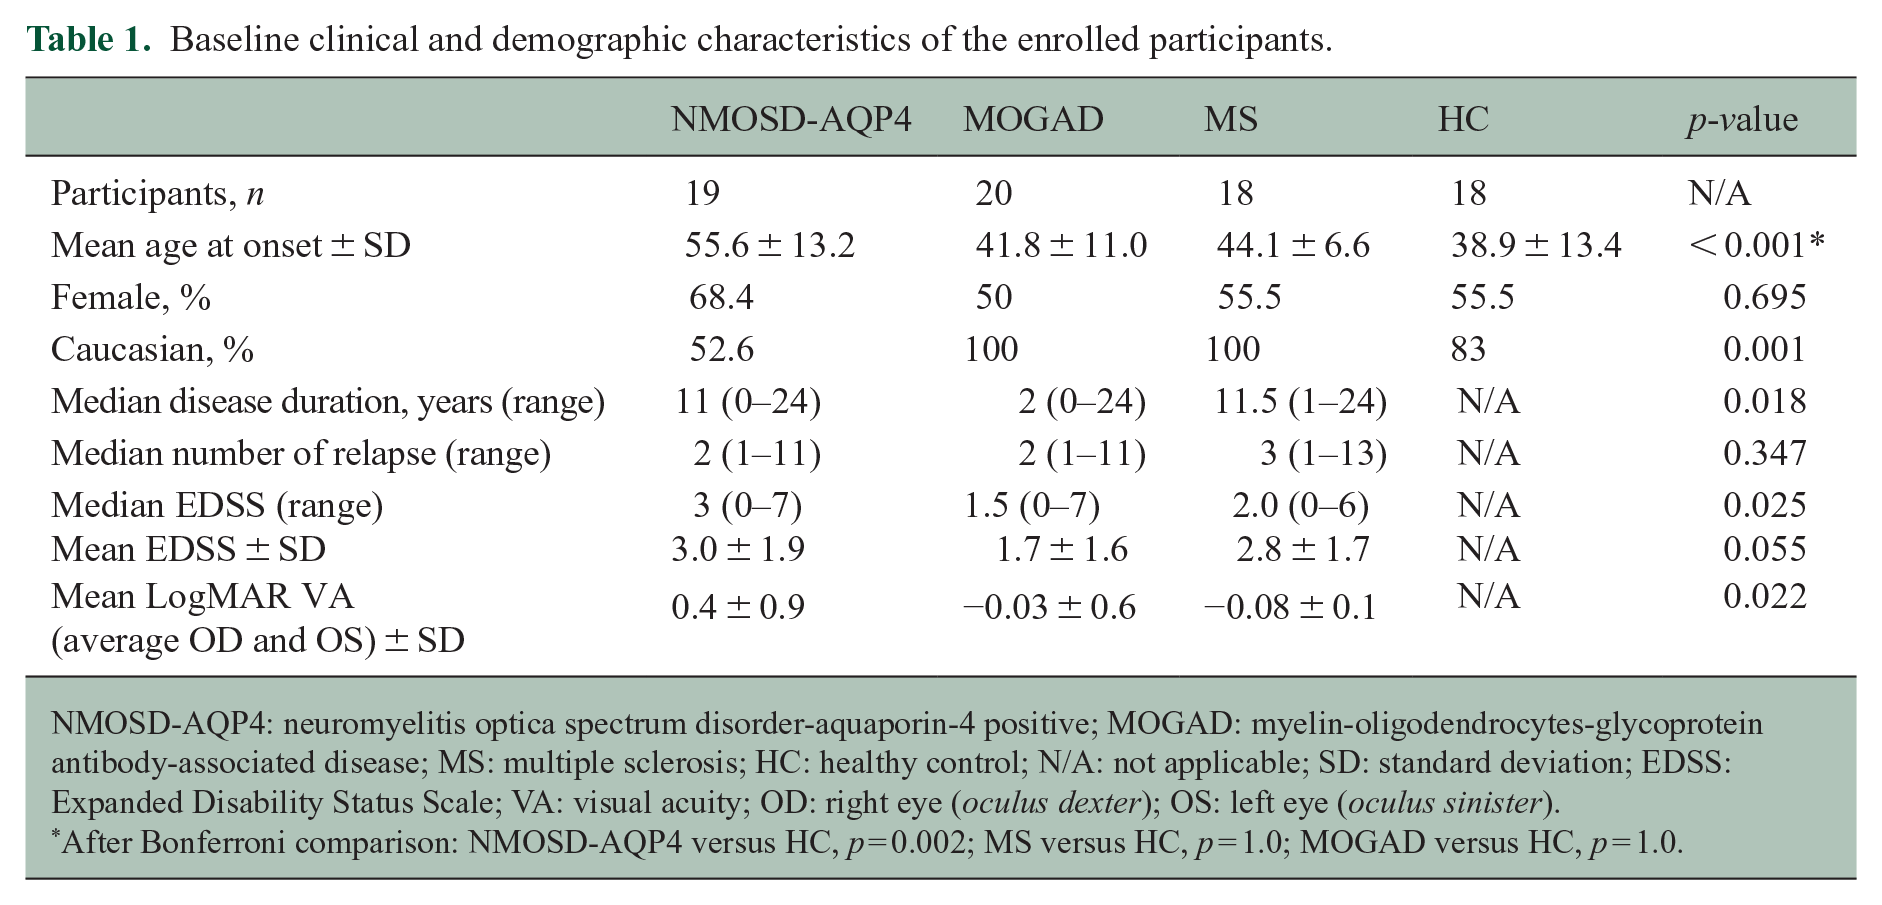
NMOSD-AQP4: neuromyelitis optica spectrum disorder-aquaporin-4 positive; MOGAD: myelin-oligodendrocytes-glycoprotein antibody-associated disease; MS: multiple sclerosis; HC: healthy control; N/A: not applicable; SD: standard deviation; EDSS: Expanded Disability Status Scale; VA: visual acuity; OD: right eye (oculus dexter); OS: left eye (oculus sinister).
After Bonferroni comparison: NMOSD-AQP4 versus HC, p = 0.002; MS versus HC, p = 1.0; MOGAD versus HC, p = 1.0.
MRI imaging protocol
Brain MRI was performed at 3T (Siemens Magnetom Prisma, Erlangen, Germany) including T1-weighted, fluid attenuated inversion recovery (FLAIR), proton density (PD), double inversion recovery (DIR) T2-weighted and diffusion-weighted sequences (see Supplementary Material and Methods).
Statistical analysis
RStudio version 1.1.447 for non-imaging data was used. Differences were evaluated by analysis of variance (ANOVA to test means) and χ2 (to test proportion), non-parametric tests were performed when the variables were not normally distributed. Linear models with disease group, sex and age as independent variables (volumetric scaling factor in case of volumetric measures) and the specific MRI measure as the dependent variable were fit, then for pairwise-comparison between groups, the estimated marginal means and standard error (SE) with Bonferroni correction across groups were calculated. Pearson’s correlation was used to test the relationship between MRI findings.
In addition, a multivariable linear regression model with a stepwise variable selection based on the Akaike information criterion (AIC), was fitted in every disease group using age and sex, and MRI measures (that show differences across groups) as independent variables, and Expanded Disability Status Scale (EDSS) as the dependent variable.
For visual acuity (mean LogMAR), we use the same demographic variables and only two a priori MRI measures as independent variables (optic chiasm and thalamus volume due to their connection to the anterior visual pathways) in the multivariable linear regression model.
For all analyses, p < 0.05 was considered statistically significant. Graphs were created using ggplot and ggpubr packages, Rstudio.
Results
The clinical and demographic characteristics of the four groups are represented in Table 1. Age in NMOSD-AQP4 was significantly different from HC, thus, was included in all regression models, together with sex.
All the non-significant results described below are shown in detail in Supplementary Results.
Volumetric analysis
Non-normalised volumes are shown in Supplementary Table 1. Results are shown as difference of volume estimates between groups in cubic millimetres, standard error (SE), p-value; when compared to HC a negative value indicates a lower volume in the disease group; when describing disease comparisons, the negative value indicates a lower volume in the disease group first mentioned in the comparison).
Total brain volume, white/grey matter fraction and third/fourth ventricular volumes: no significant differences were found in global measures (see Supplementary Results).
Grey matter volumes: when considering the total deep grey matter volumes, both MOGAD and MS showed lower volumes when compared to HC (MOGAD: −2609 mm3 (880) p = 0.02; MS: −4092 mm3 (891) p = 0.0001; Figure 1(a)) driven predominantly by significant putamen atrophy in MOGAD (−615.4 mm3 (226) p = 0.05) and more diffuse atrophy across the individual grey matter structures in MS (see Figure 1(b-i)). Only the brainstem was smaller in NMOSD-AQP4 (−2575.8 mm3 (933) p = 0.04) when compared to HC. Compared to NMOSD-AQP4, the caudate was significantly smaller in MS (−650 mm3 (202) p = 0.01). The remaining comparisons were not statistically significant (see Supplementary Results). The deep grey matter volume was not significantly correlated with the number of relapses (see Supplementary Results).
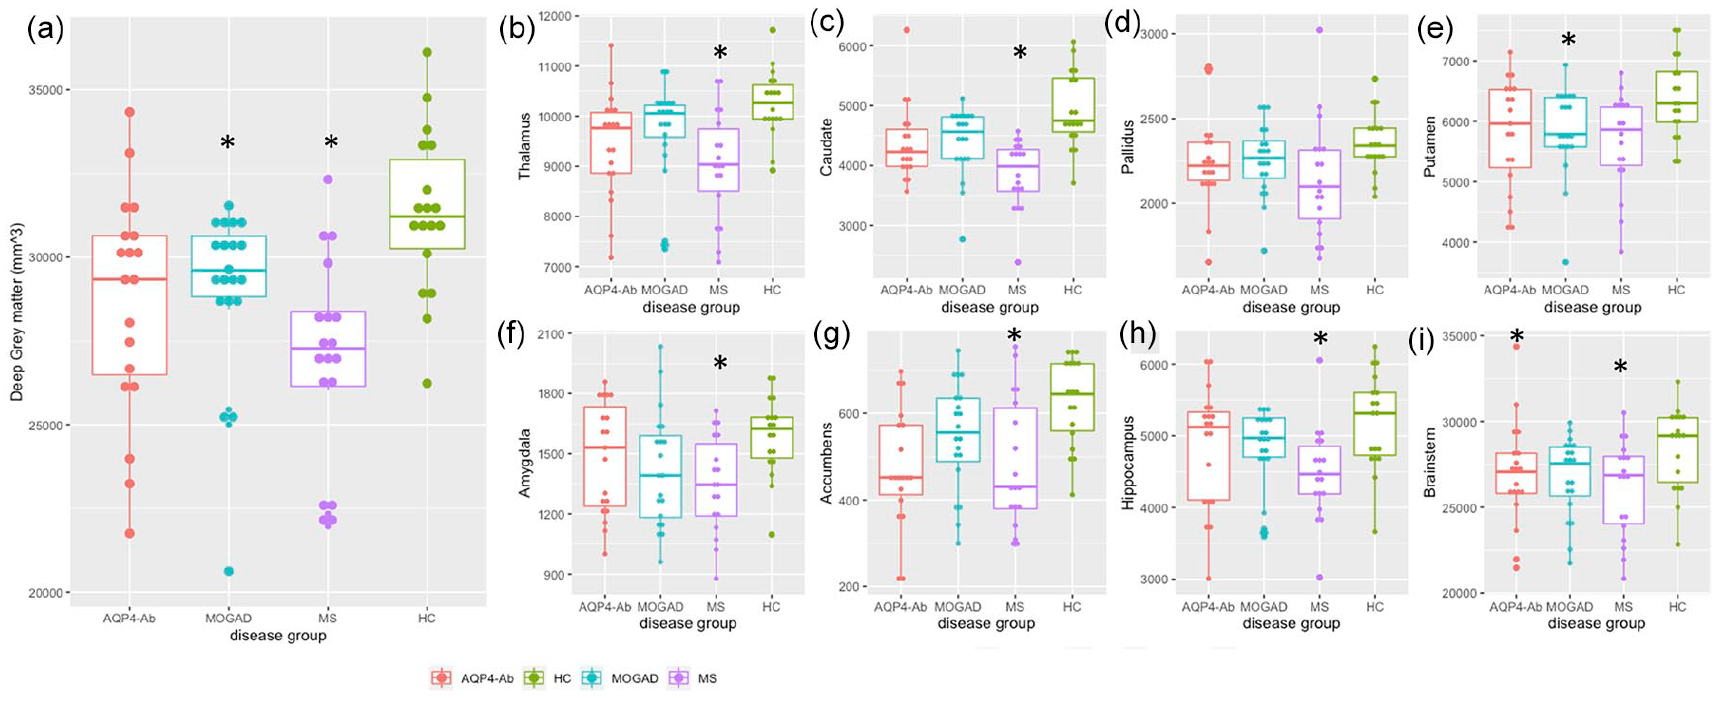
Total deep grey matter volumes (a), basal ganglia, hippocampus and brainstem volumes (b-I) between disease groups.
Cortical thickness and volumes: cortical thickness (mm2) and volumes (mm3) were not significantly different between groups (see Supplementary Results).
White matter region of interest volumes: given that visual function is often involved in the antibody-mediated diseases, and association fibres can be abnormal in MS, we selected the optic chiasm and corpus callosum as regions of interest for volume analysis. No significant difference in optic chiasm volumes were seen, but when including only those with at least one attack of ON, NMOSD-AQP4-ON had significantly lower chiasmatic volumes when compared to the other groups (NMOSD-AQP4: −153.54 mm3 (23.8) p < 0.001; HC: −121.43 mm3 (23.3) p < 0.001, MOGAD-ON: −80.05 mm3 (24.8) p = 0.04, MS-ON: −95.51 mm3 (28.1) p = 0.02) likely reflecting the recognised posterior location of NMOSD-AQP4-ON and its severity (see Table 1). This effect was not seen in the MOGAD-ON groups and, additionally, there were no significant differences of the corpus callosum across groups (see Supplementary Results).
Lesion analysis
Lesion volume: 14 out of 20 (70%) MOGAD patients had brain lesions at the time of the scan and 17 (85%) of MOGAD patients had brain lesions acutely. All MS and NMOSD-AQP4 had acute brain lesions with persistent lesions at the time of the research scan. Only two HC had brain lesions, one had two punctiform small lesions normal for ageing brain and another had a few small punctiform non-specific lesions. The MS patients had a higher lesion volume when compared to NMOSD-AQP4 disease (1.326 mm3 (0.503) p = 0.03) and MOGAD patients (2.219 mm3 (0.545) p = 0.0005). Lesion volume was positively correlated with disease duration in MS (Pearson’s correlation R = 0.46, p = 0.05) and MOGAD patients (R = 0.81, p < 0.001). Lesion volume also showed a moderate correlation with the number of relapses in NMOSD-AQP4 (R = 0.53, p = 0.02) but this was not significant in MOGAD (R = 0.26, p = 0.37) and MS (R = 0.48, p = 0.06).
Lesion probability maps: the voxel-wise analysis between MOGAD and NMOSD-AQP4 was not significant, while the MS analysis showed that lesions are statistically more frequent in the periventricular areas than NMOSD-AQP4 and MOGAD (p < 0.05 TFCE (threshold-free cluster enhancement) corrected; see Figure 2(a) and (b)).
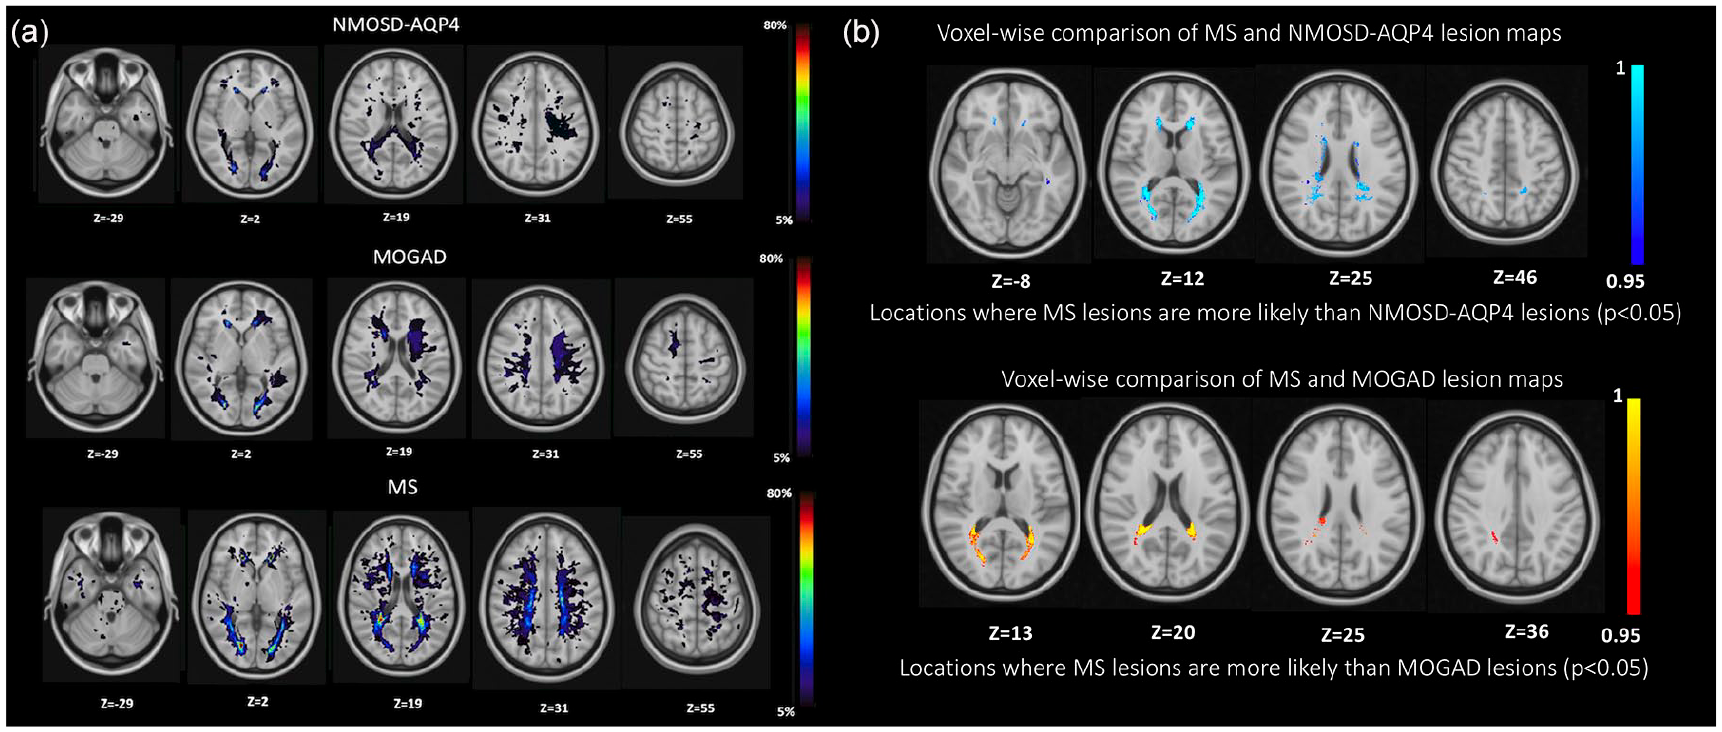
(a) Lesion probability map in NMOSD-AQP4, MOGAD and MS (b) voxel-wise comparison between MS and NMOSD-AQP4, MS and MOGAD. Lesions were identified on the lesion map with cluster tool (part of FSL) and using the Talairach Atlas. (a) The colour scale (from 5% to 80%) represents the minimum to maximum probability of a lesion occurring in a particular spatial location. Montreal Neurological Institute (MNI) standard space template Z coordinate is shown in millimetres. In the NMOSD-AQP4 group, the lesion map showed a widespread distribution, with the highest percentage of patients having lesions in the lateral ventricle anterior horns (31.5%), and in the right lingual gyrus of the occipital lobe (42%) and 10.5% in the corpus callosum. In the MOGAD group, the lesion map showed a widespread distribution, with the highest percentage of patients having lesions in the lingual gyrus bilaterally (50% right and 57.1% left), 42.8% have small lesions in the anterior horns of the right and left lateral ventricles, 14.3% in the superior frontal gyrus and 14.3 % in the medial frontal gyrus. In the MS group, the lesion map showed a more focal distribution, with the highest percentage of patients having lesions in the periventricular anterior horns area (88.8% on the right and 94.4% on the left lateral ventricles), 16.6% in the brainstem, 11.1% cerebellum and 55.5% in the corpus callosum. (b) Statistically significant voxel locations (values represent 1-p-value, TFCE corrected) are represented in blue-light blue (MS vs NMOSD-AQP4) and red-yellow (MS vs MOGAD).
Cortical lesions analysis: a total of 69 DIR sequences were available for the cortical lesions’ analysis (16 HC, 16 NMOSD-AQP4, 19 MOGAD and 17 MS). We defined cortical lesions as those lesions within the cortex or extending from the cortex to the adjacent white matter and juxtacortical lesions as white matter lesions in direct contact with the cortex. 14 Three MOGAD patients (15.7%) showed cortical/juxtacortical lesions (type I; one with one curvilinear and one with one ovoid lesion, and one participant with three curvilinear lesions), while 11 (65%) MS patients had identifiable cortical/juxtacortical (leukocortical) lesions, with three patients presenting at least one pure cortical lesion (type II; see Figure 3(a)–(d)) and one an extensive subpial lesion (see Table 2 with p-value).
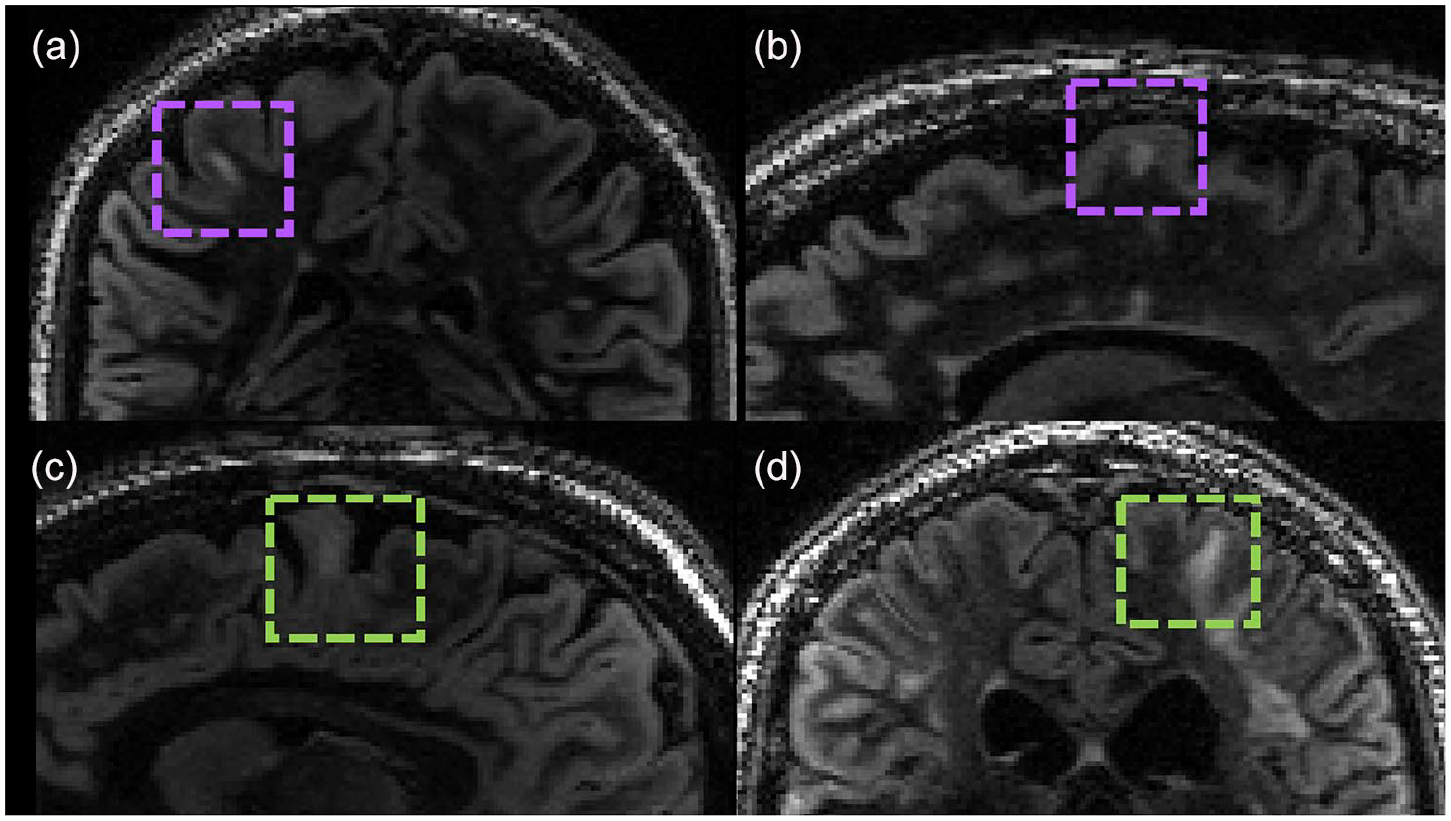
Cortical/juxtacortical lesions in (a and b) MS and (c and d) MOGAD. The inter-rater agreement was k = 0.78 (p < 0.001) with 95% confidence interval (CI) 0.59–0.97. (a) Ovoid cortical lesion in MS participant; (b) ovoid cortical/juxtacortical lesion in MS participant; (c and d) curvilinear juxtacortical lesions in two MOGAD participants.
Cortical/juxtacortical lesions in the three disease groups.
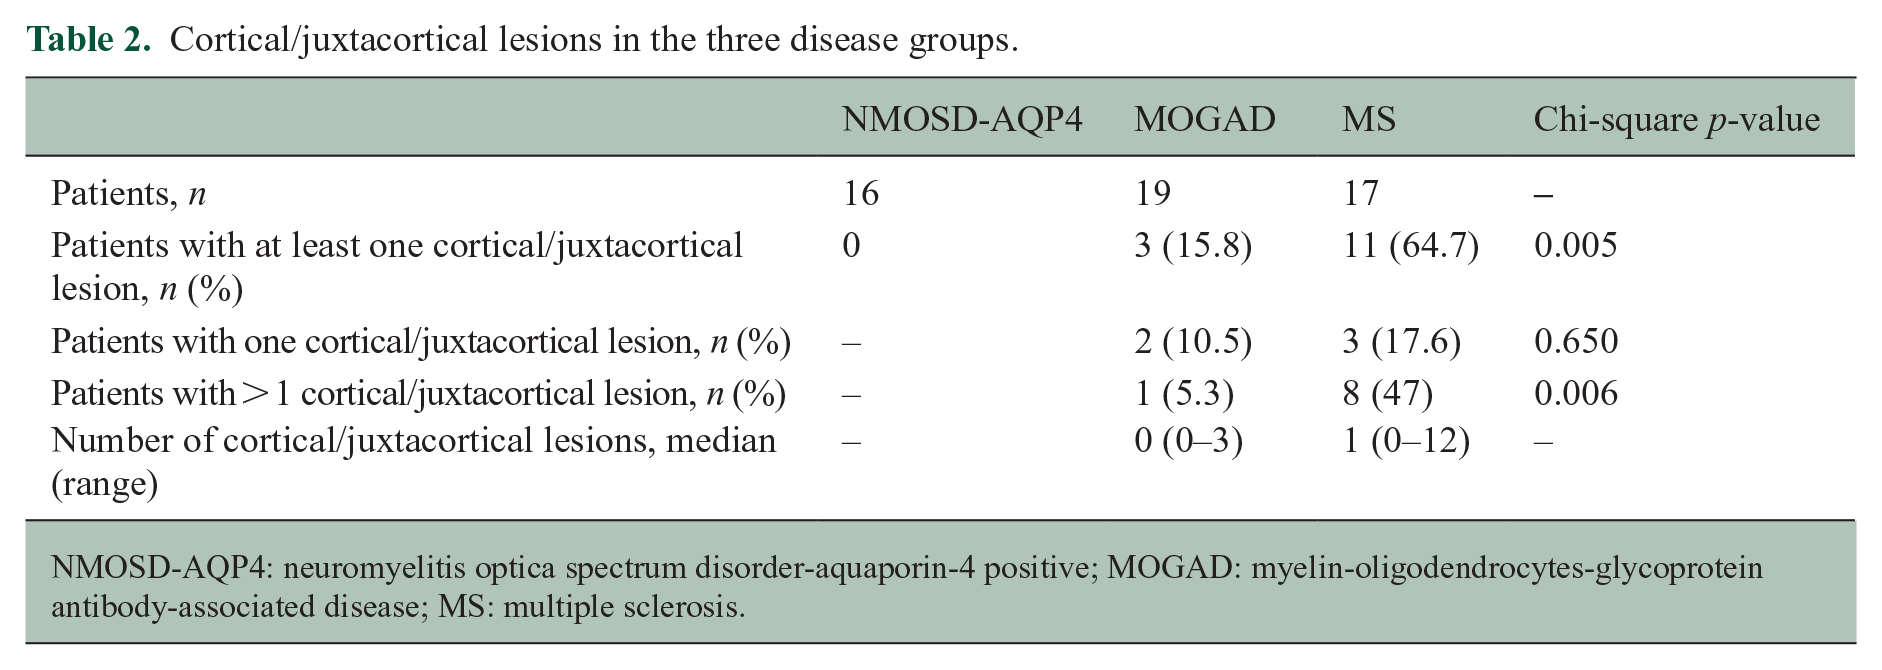
NMOSD-AQP4: neuromyelitis optica spectrum disorder-aquaporin-4 positive; MOGAD: myelin-oligodendrocytes-glycoprotein antibody-associated disease; MS: multiple sclerosis.
Diffusion-weighted imaging analysis
Diffusion measures across the groups are shown in Supplementary Table 2 (16 MS, 19 MOGAD, 17 NMOSD-AQP4 and 17 HC scans were available for the analysis). All group comparisons used linear regression with Bonferroni correction and were adjusted for age and sex (results are shown as difference of diffusion measures estimates between groups, standard error (SE) p-value).
White matter diffusion metrics: fractional anisotropy (FA) and mean diffusivity (MD in 10−3 mm2 s−1), axial diffusivity (AD in 10−3 mm2 s−1) and radial diffusivity (RD in 10−3 mm2 s−1) were calculated (see Supplementary Table 3) within the lesions voxels (lesion-FA) using the FLAIR lesion masks, and also in the normal-appearing white matter (NAWM).
Lesion-FA was lower, and lesion-MD and -RD were higher when compared to the NAWM within all the three diseases (p < 0.001; see Figure 4(a)–(d)), and also compared to HC (lesion-FA NMOSD-AQP4: −0.16 (0.02), MOGAD: −0.16 (0.02), MS: −0.15 (0.02), p < 0.001 in each group; lesion-MD NMOSD-AQP4: 0.11 (0.03), p = 0.002, MOGAD: 0.13 (0.03), MS: 0.17 (0.03) p < 0.001 in each group; lesion-RD NMOSD-AQP4: 0.16 (0.03), MOGAD: 0.15 (0.02), MS: 0.17 (0.02), p < 0.001 in each group), but no differences were found in AD values. NAWM-FA in MOGAD and NMOSD-AQP4 was similar to HC and only in MS was lower compared to both HC and MOGAD (−0.03 (0.01), p = 0.01; −0.03 (0.01), p = 0.03; see Figure 4(a)–(d)).
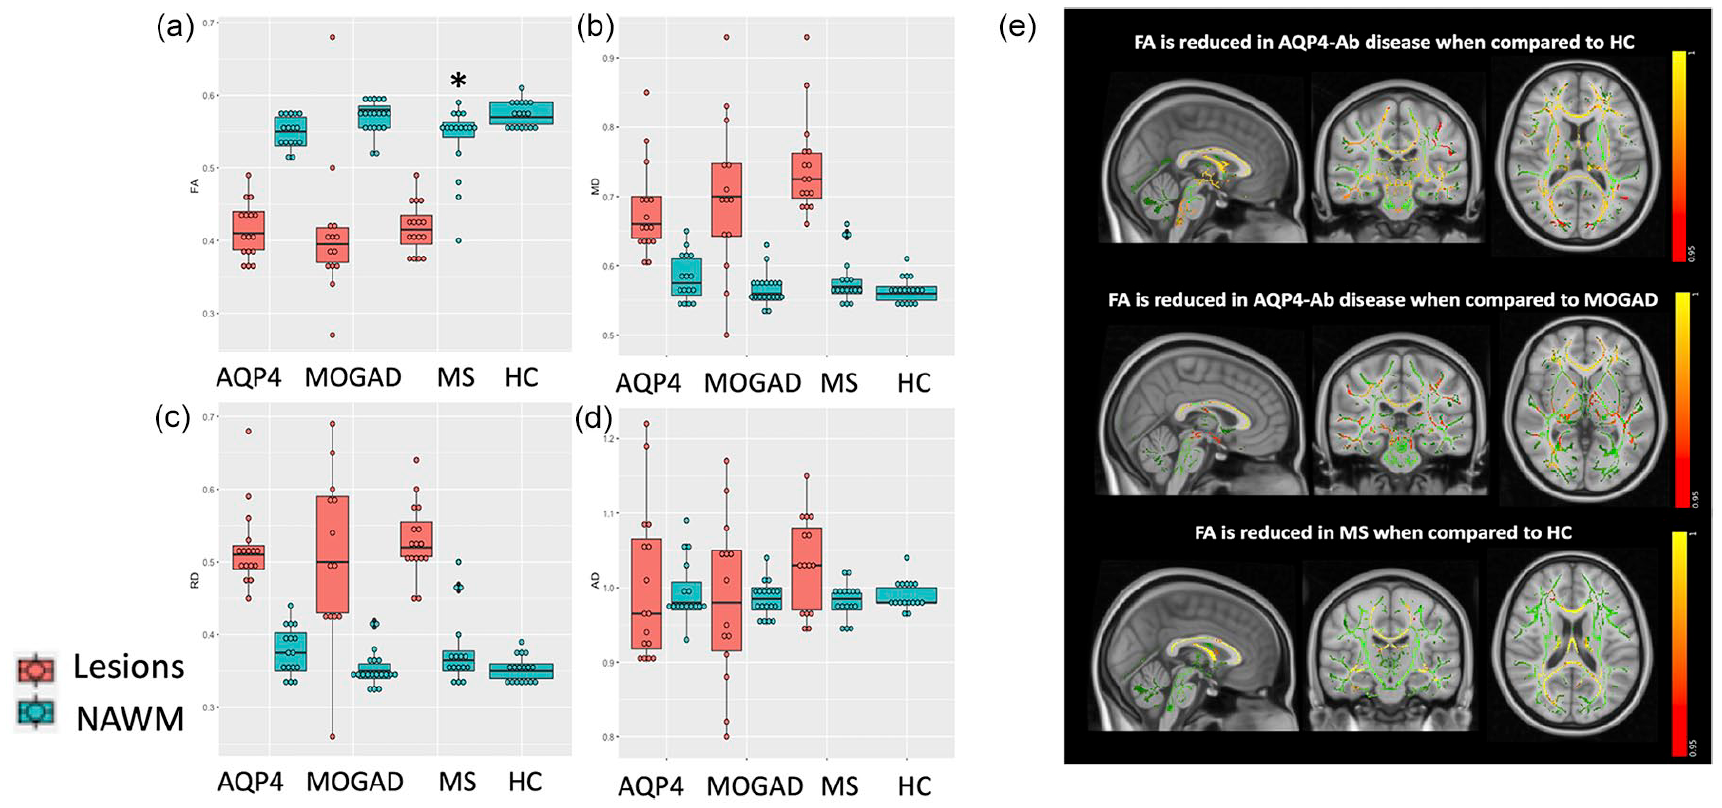
FA, MD, RD and AD lesions and NAWM comparison in the four groups (a–d); tract-based spatial statistics (TBSS) FA in NMOSD-AQP4 versus HC, NMOSD-AQP4 versus MOGAD, and MS versus HC (e). (a–d) *p < 0.05 when compared to HC, on the linear model adjusted for age and sex. NAWM: normal-appearing white matter, AQP4: NMOSD-AQP4. (e) The FA skeleton is shown in green with a threshold of 0.2, tracts with lower FA are shown in red–yellow (values represent 1-p-value, TFCE corrected). TBSS voxel-wise analysis of FA NAWM showed a significant reduction in NMOSD-AQP4 when compared with HC in the external capsule, corona radiata, the anterior limb of the internal capsule, posterior limb of the internal capsule (including fibres of the optic radiation), retrolenticular internal capsule, corpus callosum, posterior thalamic radiation (including the optic radiation); in the brainstem, the cerebral peduncle, the middle cerebellar peduncles, medial lemniscus, the pontine crossing tracts (corticospinal tracts) and the inferior cerebellar peduncles. FA NAWM in NMOSD-AQP4 when compared to MOGAD, showed a more widespread significant reduction. MS compared to HC, showed a significant reduction of the FA in the corpus callosum, corona radiata and posterior thalamic radiation, and not significant when compared to MOGAD. The TBSS voxel-wise analysis in the MOGAD did not show any significant difference when compared with HC.
Tract-based spatial statistics (TBSS) of NAWM FA: although 85% of MOGAD had brain lesions acutely, the TBSS voxel-wise analysis of FA-NAWM did not show significantly low FA as compared to HC. NAWM-FA was abnormal in NMOSD-AQP4 and MS when compared with HC, with lower FA in NMOSD-AQP4 affecting mainly corticospinal, brainstem and visual tracts and in MS focussed particularly on the corpus callosum (Figure 4(e)).
Grey matter diffusion metrics: MD values analysed in the cortical and deep grey matter structures did not show significant differences (see Supplementary Results).
Correlations between lesion volume and grey matter volumes in NMOSD-AQP4, MOGAD and MS
Because the predominant differences in non-lesional volumes in MOGAD were in grey matter structures, we looked at the relationship between lesion volume and total deep grey matter volume and found significant negative correlations in MOGAD and MS for deep grey matter volumes (Pearson’s correlation coefficients; MOGAD: R = −0.93, p < 0.001; MS: R = −0.65, p = 0.0034) and also for cortical thickness (MOGAD: R = −0.71, p = 0.005; MS: R = −0.64, p = 0.0042). No significant correlations were found with cortical volume. Due to the above correlation, we looked at the deep grey matter lesion volume correlation with deep grey matter volume but there was no significant correlation (although the numbers of lesions here were low; see Supplementary Results).
Monophasic and relapsing MOGAD
MOGAD can be monophasic or relapsing and thus may be associated with different pathological mechanisms. We compared deep grey matter volumes (where abnormalities were most apparent) in the monophasic group (n = 6) to those with relapses not affecting the brain/brainstem (n = 8) to remove a dose effect of repeated brain damage. Hippocampal volumes were lower but not significant (see Figure 5), and caudate volumes were significantly higher in this relapsing group compared to monophasic group (hippocampus: −411 mm3 (218) p = 0.09; caudate: −471 mm3 (118) p = 0.03). However, only the hippocampal volume difference was plausible as this pattern was mirrored by a lower volume in the relapsing with brain/brainstem attacks.
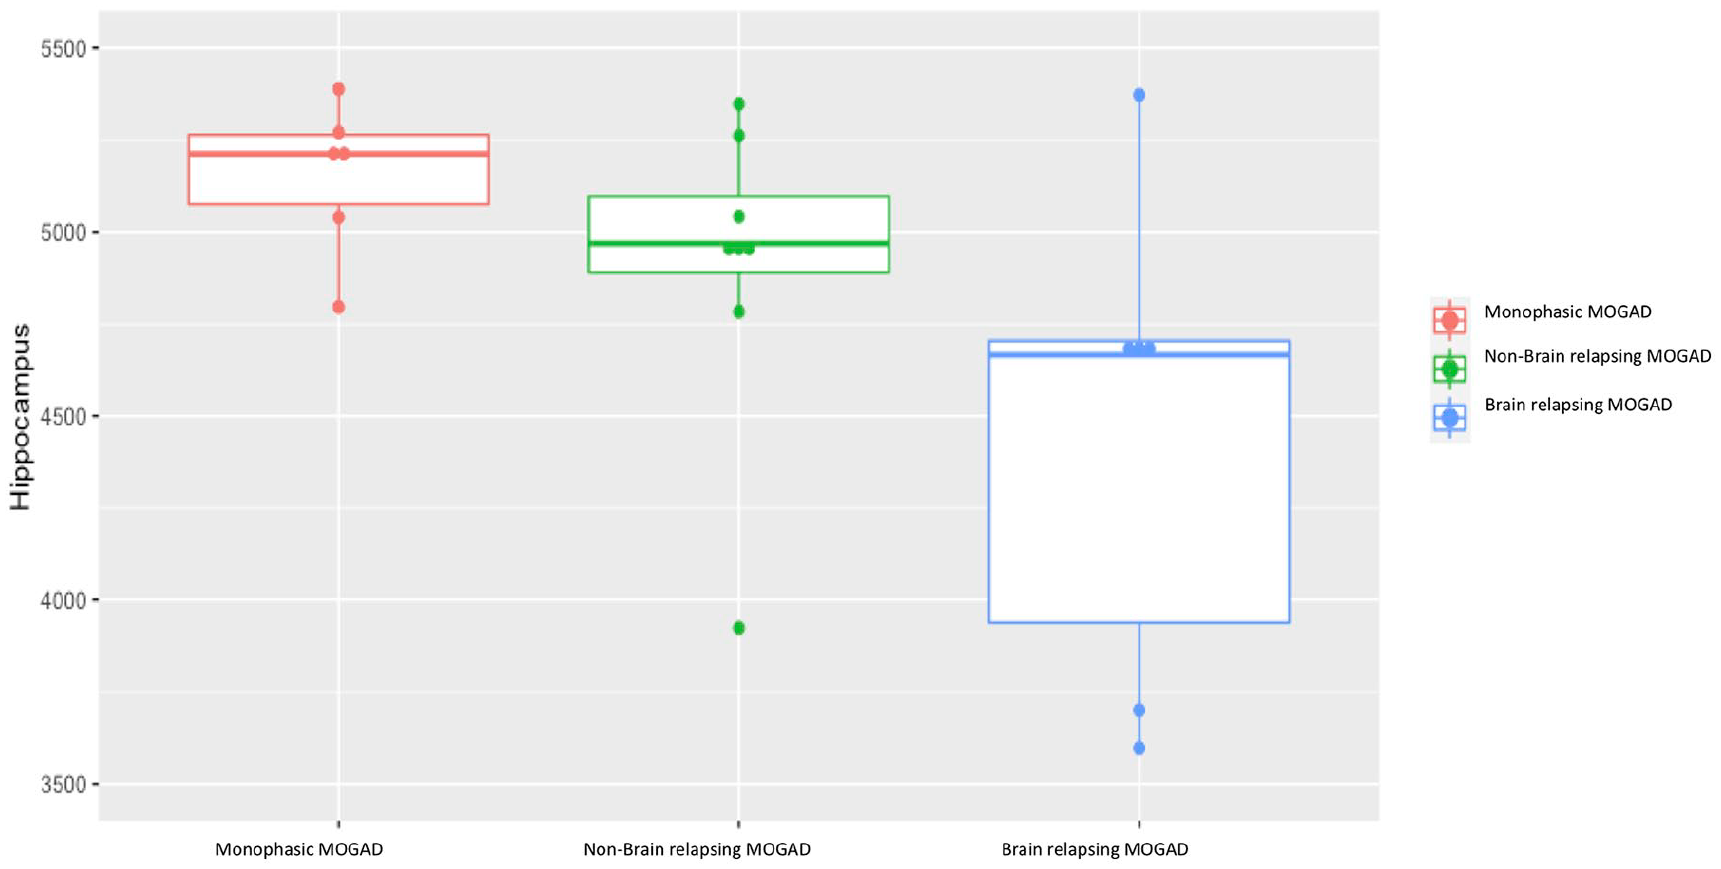
Comparison of hippocampus volumetric measures for patients with MOGAD and either a monophasic, relapsing with a brain relapse or relapsing with a non-brain relapse phenotype.
Clinical outcomes and their association with the imaging findings
Disability – EDSS
We explored the association of MRI findings with EDSS, within each disease group, using a stepwise multivariable regression model, which showed that lower NAWM FA in NMOSD-AQP4 (R2 = 0.49; slope = −61.67, p < 0.001), lower deep grey matter volumes and female sex in MS (R2 = 0.47; deep grey matter volume slope = −0.0002, p = 0.05; beta value for sex = 2.09, p = 0.005) and lower brainstem volume in MOGAD (R2 = 0.23; slope = −0.0003, p = 0.03) were associated with worse EDSS (see Supplementary Results for further details).
Disability – visual acuity
We found that lower optic chiasm in NMOSD-AQP4 (R2 = 0.63; slope = −0.007, p < 0.001),and lower thalamic volume and female sex in MOGAD (R2 = 0.42; slope = −0.0004, p = 0.006; beta value for sex = 0.48, p = 0.04) were associated with worse visual outcome. We did not find any significant predictor in MS.
Discussion
This is the first study using quantitative and non-conventional MRI to compare and contrast MOGAD to NMOSD-AQP4, MS and HC and showed different patterns across the three diseases (Table 3). We noted significant volume loss in the deep grey matter structures in MOGAD, as well as in MS, but not in NMOSD-AQP4, despite the greatest disability being seen in NMOSD-AQP4 and least in MOGAD. Abnormal deep grey matter and cortical thickness in MOGAD, showed a high correlation of 93% and 71%, respectively, with persistent brain lesions. In the white matter, optic chiasm volume was lower only in NMOSD-AQP4-ON patients. Although majority of the MOGAD patients had brain involvement in the acute phase, and FA was lower in the lesional tissue, NAWM-FA was not affected. Non-lesional FA was only found to be low in MS, although focal reductions in FA were noted in NMOSD-AQP4 patients, reflecting mainly the optic nerve, brainstem and corticospinal tract pathways. Cortical/juxtacortical (type I) fluffy, curvilinear lesions were seen in a minority of MOGAD, while cortical/juxtacortical and purely cortical (type II) ovoid lesions were identified in majority of MS patients and in none of the NMOSD-AQP4 patients.
Summary of the main findings.
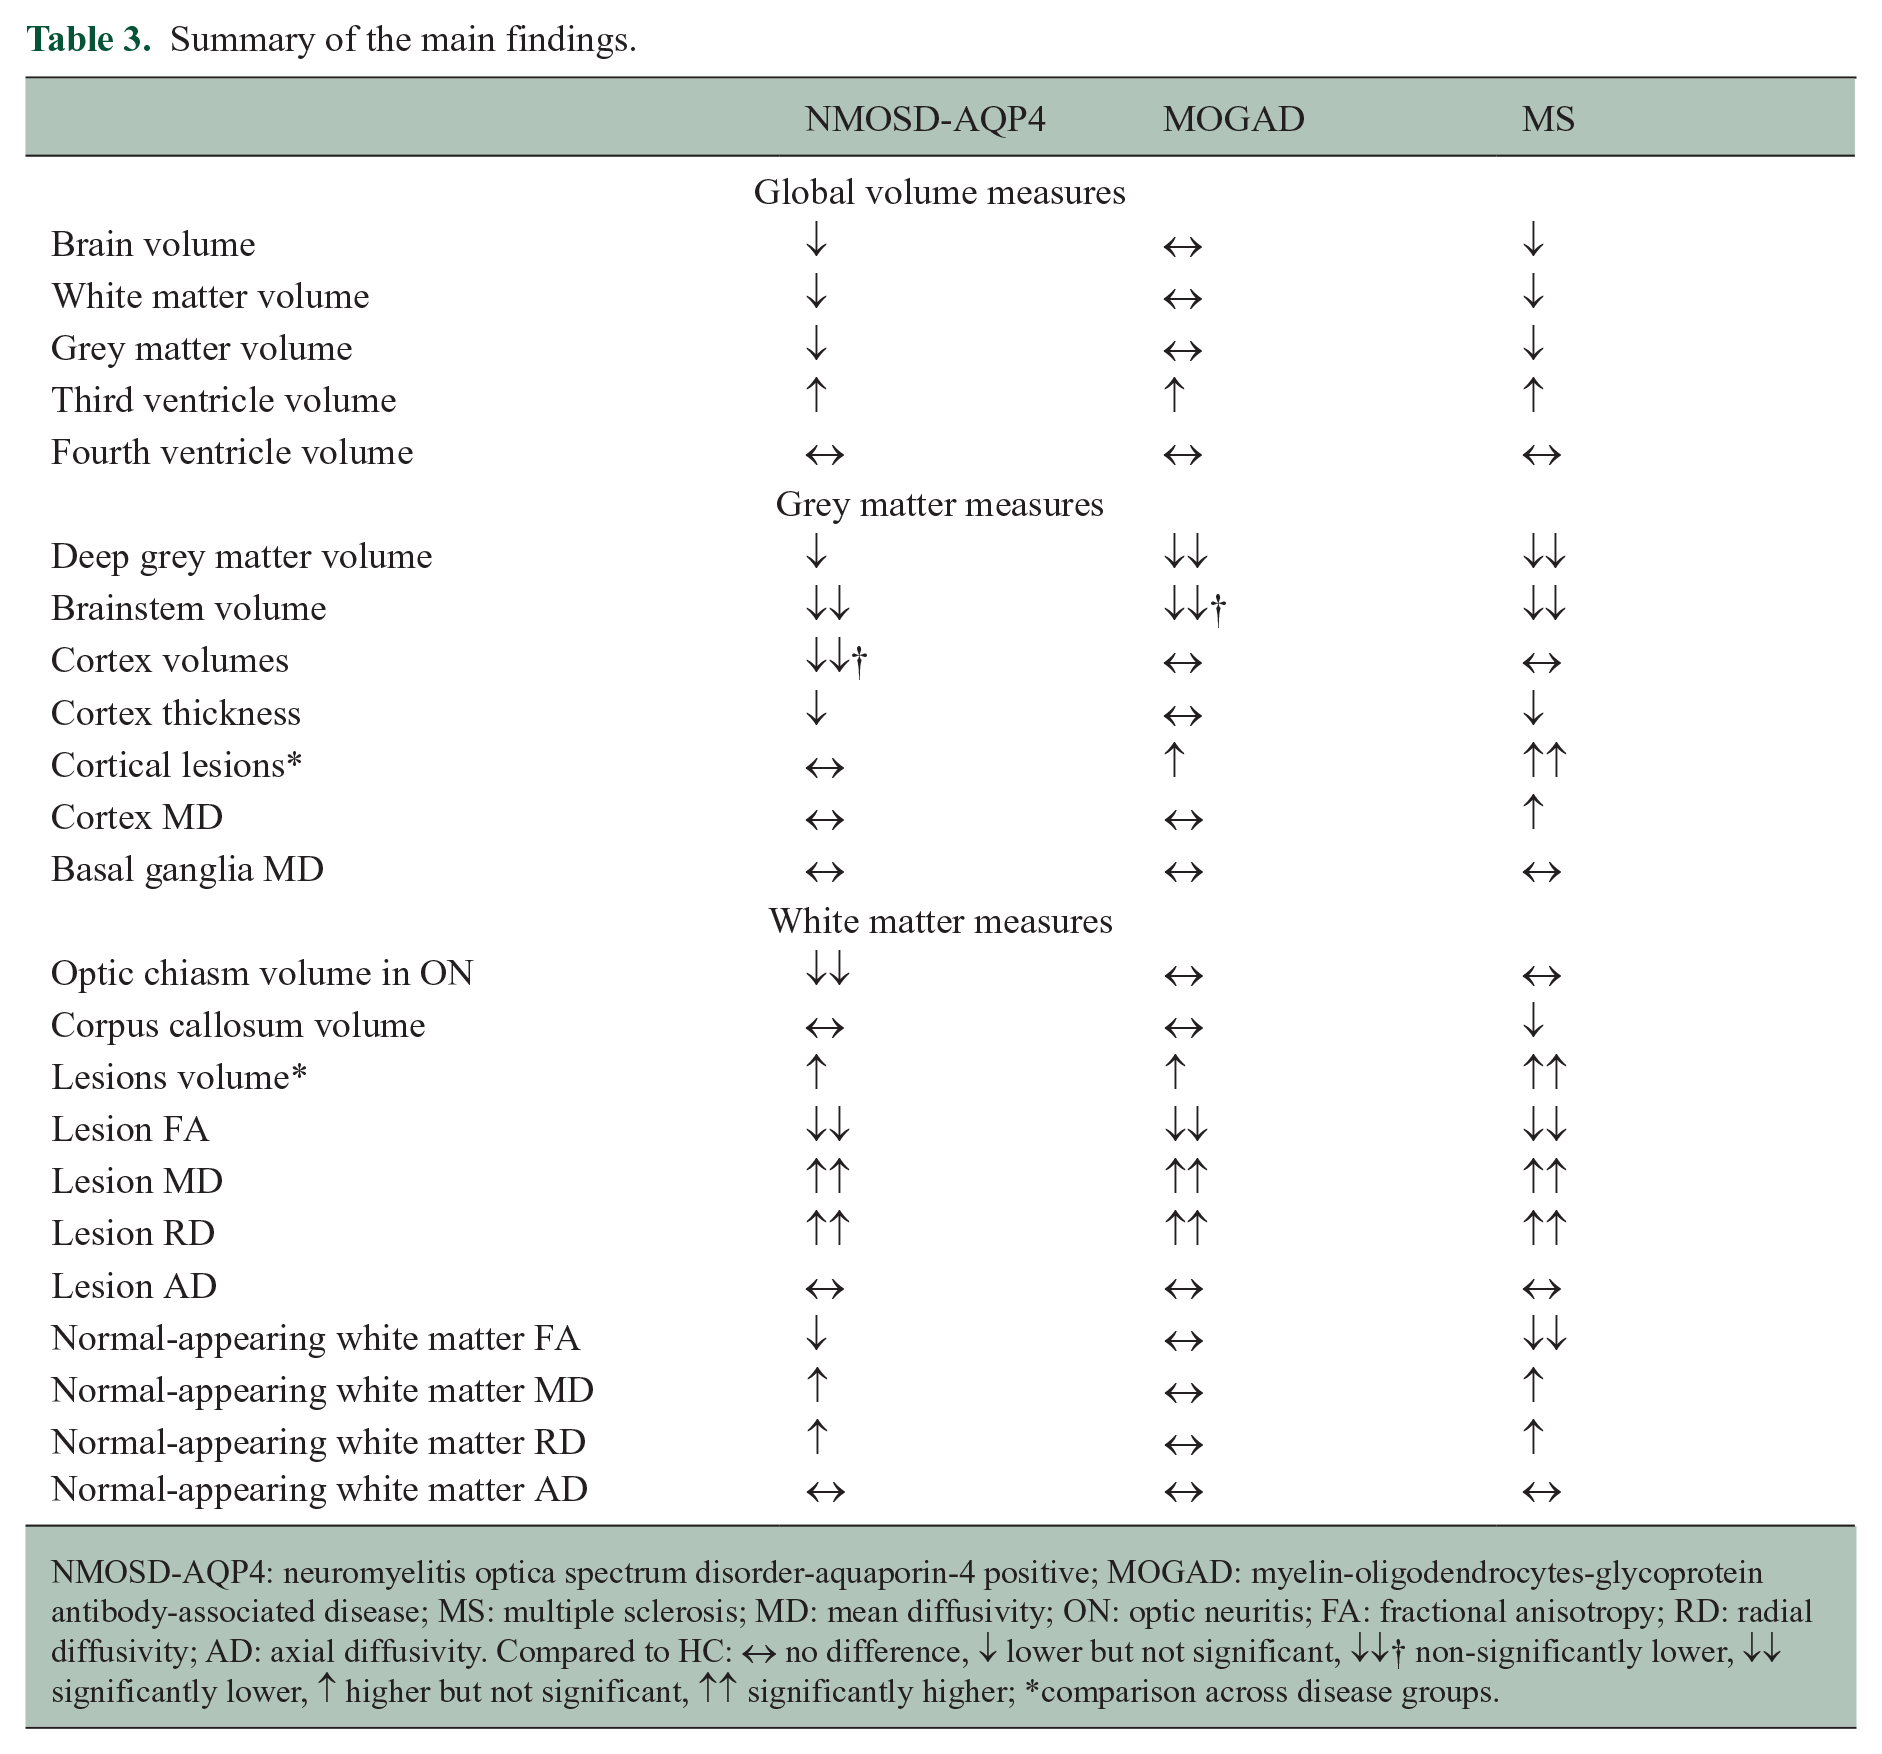
NMOSD-AQP4: neuromyelitis optica spectrum disorder-aquaporin-4 positive; MOGAD: myelin-oligodendrocytes-glycoprotein antibody-associated disease; MS: multiple sclerosis; MD: mean diffusivity; ON: optic neuritis; FA: fractional anisotropy; RD: radial diffusivity; AD: axial diffusivity. Compared to HC: ↔ no difference, ↓ lower but not significant, ↓↓† non-significantly lower, ↓↓ significantly lower, ↑ higher but not significant,
Our study identified that deep grey matter structures are the only region of atrophy in MOGAD and this associated significantly with the current lesional volume. Overall, the grey matter was most sensitive to atrophy in MS, supporting previous studies.15,16 Deep grey matter volume was lower, but not significantly in NMOSD-AQP4 as compared to HC. Despite poorer outcomes and older age, it appears this measure is less sensitive in NMOSD-AQP4, in keeping with other published papers.9,12,17 This finding supports the growing evidence for grey matter involvement in MOGAD: grey matter lesions have been described in acute disseminated encephalomyelitis (ADEM) and over half of the children with ADEM have MOG-antibodies,18,19 and grey matter atrophy has also been shown in the spinal cord in MOGAD. 20 Further analysis showed that the lesions in both MOGAD and MS, but not in NMOSD-AQP4, correlated negatively with deep grey matter volume suggesting current lesion volume could be driving the atrophy by disruption of the white matter bundles projecting into the deep grey matter structures. The lack of correlation when using deep grey matter lesions alone suggests that lesions in tracts beyond the deep grey matter may contribute to its atrophy. It would be interesting in future studies to assess whether relapsing patients with greater residual lesion load might predict a worse outcome, and thus require more aggressive therapy than those with recovery of lesions.
Optic chiasm volumetric analysis, showed a significant low volume in NMOSD-AQP4 patients who have had an ON attack. This is in keeping with the clinical residual severity of ON associated with AQP4 antibodies and the observed optic radiation damage may, therefore, be a consequence of the anterograde trans-synaptic degeneration, due to the axonal loss in the optic chiasm. 21 The lack of abnormality in the optic chiasm in MS and MOGAD with ON reflects the better recovery and the lack of posterior involvement, which is typically seen in NMOSD-AQP4. 22
Ovoid, and some purely cortical (type II) lesions were (as expected) identified in a majority of MS patients. We found none in NMOSD-AQP4. Of note, we found curvilinear and fluffy cortical lesions involving adjacent juxtacortical regions (type I) in three MOGAD patients. This is intriguing, considering MS and MOGAD may have similar predominantly white matter targets (i.e. myelin) but cortical involvement is now well-described in MS, 23 and cortical signal changes associated with seizure have been reported as a rarer isolated phenotype in MOGAD. 5 In addition, cortical/juxtacortical lesions have been described in a clinical MRI study of MOGAD. 24 Cortical/juxtacortical lesions have been reported as absent in NMOSD 25 or have been identified in only a minority of NMOSD-AQP4 patients during the acute phase. 26 Although the cortex is rich in AQP4 water channels, we did not find lesions. Lower cortical thickness has been described in MS patients. In our cohort, it was not significantly lower when compared to the other disease groups, possibly due to the low sample size and low disability of the studied cohort.
We did not show a specific lesion pattern distribution in MOGAD and this is in line with previous findings where a disperse lesion distribution was identified. 27 Although infratentorial lesions are common in the acute phase, we did not find them in our MOGAD cohort as, in contrast to previous retrospective studies, 27 we only included patients in the remission phase. The location of lesions outside of the acute phase, that is, persistent lesions, is likely to be more useful in associating them with long-term disability.
FA changes were not found in MOGAD NAWM, even though MOGAD attacks are equally severe at nadir 4 and 17 out of 20 of the MOGAD cohort had acute brain lesions with 8 out of 20 having large acute lesions. Of interest is that the lesions themselves across all diseases, including MOGAD, appeared similarly affected on diffusion metrics and were abnormal when compared to the NAWM measures. Total NAWM-FA was found to be significantly abnormal in MS, and this could represent widespread lesion related damage (related to remote lesions or ‘resolved’ lesions) and/or non-lesional pathology. Tract-based analysis also identified damage in NMOSD-AQP4 but predominantly affecting the visual and pyramidal pathways, supporting remote lesional damage in areas commonly affected in this disease. This predominance of visual and pyramidal pathway tract remote involvement is supported by other studies.11,12 Thus recovery, as measured by this metric, was best in MOGAD than the other diseases.
Different MRI predictors of disability within the individual disease groups could suggest that different pathological mechanisms contribute to the tissue damage across these diseases. It is not surprising that NAWM FA was associated with EDSS in NMOSD-AQP4 disease, because the regional changes we identified were in those tracts mainly associated with the optic nerve and corticospinal tract and might relate to remote damage from attacks of ON and transverse myelitis. Lower deep grey-matter volume and female sex, associated to worse EDSS in MS, possibly reflecting the widespread atrophy of the deep grey matter structures noted in MS. Brainstem volume was the only MRI measure associated with EDSS in MOGAD, and this may reflect its eloquent site for ambulatory disability and is in line with our observation that the presence of brainstem lesions is associated with a worse recovery from transverse myelitis attacks. 28
In the NMOSD-AQP4 group, lower optic chiasm volumes could explain reduced visual acuity, in line with previous observations of a preferential involvement of the chiasm in NMOSD-AQP4, 22 reflecting the recognised lack of chiasmatic involvement in MOGAD. 29 Only lower thalamic volume was associated with poorer mean visual acuity in MOGAD.
The main limitation of our study is the small sample size per disease group, related to our including two rare disease groups made even rarer by enriching them with patients with brain/cord involvement, and excluding those with the common phenotype of anatomically limited optic nerve involvement. The use of four different groups gives interesting insights into pathological differences, reflected in non-conventional, quantitative imaging measures. In addition, the homogeneity of a single-centre study, using the same scanner and protocol, along with reliable diagnostic ability (using the same expert clinicians and highly accurate assays) is an advantage and will reduce ‘noise’ and improve power. All group comparisons were adjusted for multiple comparisons with a Bonferroni correction across groups. No further adjustments for multiple comparisons were made and thus, the significant results, where novel or not studied previously, will need to be replicated in future studies. Observations from our study can then be used to build hypotheses and design future multicentre studies.
Conclusion
Our study shows for the first time in MOGAD that deep grey matter atrophy can occur and that only lesional and not NAWM tissue damage can be detected using FA. It also highlights the relative sparing of deep grey matter in NMOSD-AQP4 disease, despite being associated with greater disability, and notes focal NAWM white matter changes. Future studies should focus on the association of ‘invisible’ symptoms (i.e. cognitive impairment and fatigue) with deep grey matter changes in MOGAD. Longitudinal studies in greater numbers may determine if non-conventional MRI measures could predict relapsing disease and may help identify who should be immunosuppressed from onset.
Supplemental Material
sj-pdf-1-msj-10.1177_13524585211018987 – Supplemental material for Contrasting the brain imaging features of MOG-antibody disease, with AQP4-antibody NMOSD and multiple sclerosis
Supplemental material, sj-pdf-1-msj-10.1177_13524585211018987 for Contrasting the brain imaging features of MOG-antibody disease, with AQP4-antibody NMOSD and multiple sclerosis by Silvia Messina, Romina Mariano, Adriana Roca-Fernandez, Ana Cavey, Maciej Jurynczyk, Maria Isabel Leite, Massimiliano Calabrese, Mark Jenkinson and Jacqueline Palace in Multiple Sclerosis Journal
Supplemental Material
sj-pdf-2-msj-10.1177_13524585211018987 – Supplemental material for Contrasting the brain imaging features of MOG-antibody disease, with AQP4-antibody NMOSD and multiple sclerosis
Supplemental material, sj-pdf-2-msj-10.1177_13524585211018987 for Contrasting the brain imaging features of MOG-antibody disease, with AQP4-antibody NMOSD and multiple sclerosis by Silvia Messina, Romina Mariano, Adriana Roca-Fernandez, Ana Cavey, Maciej Jurynczyk, Maria Isabel Leite, Massimiliano Calabrese, Mark Jenkinson and Jacqueline Palace in Multiple Sclerosis Journal
Footnotes
Acknowledgements
We gratefully acknowledge all patients, relatives and healthy volunteers who participated in this study. We thank the radiographers Michael Sanders, Jon Campbell, David Parker and all the staff at the Wellcome Centre for Integrative Neuroimaging. We thank Dr Ludovica Griffanti for her insight on the MRI analysis, Dr Michael Cottar and Dr Hanna Nowicka for their support on diffusion analysis and Dr Fidel Alfaro Almagro for his insight on the FreeSurfer software.
Author contributions
J.P. had full access to all of the data in the study and takes responsibility for the integrity of the data and the accuracy of the data analysis. Concept and design were the work of S.M., J.P. and R.M. Acquisition, analysis or interpretation of data were done by all authors. Drafting of the manuscript was done by S.M. and J.P. Critical revision of the manuscript for important intellectual content was done by R.M., A.R.-F., M.Ju., M.Je., M.I.L. and M.C. Statistical analysis was done by S.M. Administrative, technical or material support was provided by A.C. Supervision was done by J.P. and M.Je.
Declaration of Conflicting Interests
The author(s) declared the following potential conflicts of interest with respect to the research, authorship and/or publication of this article: S.M. has received travel grants from Biogen, Novartis, Bayer, Merck, Almirall, Roche and honorarium for advisory work from Biogen. R.M. is undertaking graduate studies funded by the Rhodes Trust and the Oppenheimer Memorial Trust. A.R.-F. reports no disclosures. A.C. reports no disclosures. M.J. reports no disclosures. M.I.L. reported being involved in aquaporin 4 testing, receiving support from the National Health Service National Specialised Commissioning Group for Neuromyelitis Optica and the National Institute for Health Research Oxford Biomedical Research Centre, receiving speaking honoraria from Biogen Idec, and receiving travel grant from Novartis. J.P. is partly funded by highly specialised services to run a national congenital myasthenia service and a neuromyelitis service. She has received support for scientific meetings and honorariums for advisory work from Merck Serono, Biogen Idec, Novartis, Teva, Chugai Pharma and Bayer Schering, Alexion, Roche, Genzyme, MedImmune, EuroImmun, MedDay, Abide and ARGENX, and grants from Merck Serono, Novartis, Biogen Idec, Teva, Abide and Bayer Schering. Her hospital trust received funds for her role as clinical lead for the RSS, and she has received grants from the MS society and Guthie Jackson Foundation for research studies. M.C. has served on scientific advisory boards for Biogen Idec, Genzyme, Merck Serono, Novartis and Roche and has received grants from Genzyme, Merck Serono, Novartis and Roche and travel and/or speaker honoraria from Merck Serono, Roche, Biogen Idec, Novartis and Genzyme. M.J. receives royalties from licensing of FSL to non-academic, commercial parties.
Funding
The author(s) disclosed receipt of the following financial support for the research, authorship and/or publication of this article: We thank the NHS Highly Specialised Commissioning Team for funding the Neuromyelitis Optica service in Oxford. MRI scans were funded by a Research and Development Fund belonging to the principal investigator, Professor J.P.
Supplemental material
Supplemental material for this article is available online.
References
Supplementary Material
Please find the following supplemental material available below.
For Open Access articles published under a Creative Commons License, all supplemental material carries the same license as the article it is associated with.
For non-Open Access articles published, all supplemental material carries a non-exclusive license, and permission requests for re-use of supplemental material or any part of supplemental material shall be sent directly to the copyright owner as specified in the copyright notice associated with the article.