
Abstract
Objective:
To understand how longitudinal serum neurofilament light chain (sNfL) patterns can inform its use as a prognostic biomarker in multiple sclerosis (MS) and evaluate whether sNfL reflects MS disease activity and disease-modifying therapy usage.
Methods:
This was a post hoc analysis of longitudinal data and samples from the ADVANCE trial (NCT00906399) of patients with relapsing–remitting MS (RRMS). sNfL was measured every 3 months for 2 years, then every 6 months for 4 years. Regression models explored how sNfL data predicted 4-year values of brain volume, expanded disability status scale score, and T2 lesions. sNfL levels were assessed in those receiving placebo, peginterferon beta-1a, and those with disease activity.
Results:
Baseline sNfL was a predictor of 4-year brain atrophy and development of new T2 lesions. Clinical (p = 0.02) and magnetic resonance imaging (MRI) (p < 0.01) outcomes improved in those receiving peginterferon beta-1a whose sNfL decreased to <16 pg/mL after 12 months versus those whose sNfL remained ⩾16 pg/mL. Mean sNfL levels decreased in peginterferon beta-1a-treated patients and increased in placebo-treated patients (–9.5% vs. 6.8%; p < 0.01). sNfL was higher and more variable in patients with evidence of active MS.
Conclusion:
These data support sNfL as a prognostic and disease-monitoring biomarker for RRMS.
Keywords
Introduction
Sensitive biomarkers for disease prognosis and monitoring are an unmet need in multiple sclerosis (MS).1,2 Clinicians use magnetic resonance imaging (MRI) and disease progression measures such as the expanded disability status scale (EDSS) and multiple sclerosis functional composite (MSFC) scores to evaluate a patient’s disease progression and response to treatment, but these approaches have limited sensitivity by themselves. 3 Classification of patients, as showing no evidence of disease activity (NEDA) or exhibiting evidence of MS disease activity (EDA), requires further refinement and consensus.4,5 Clinicians and researchers would benefit from sensitive, quantifiable, and specific biomarkers to monitor MS progression and treatment response.
Neurofilaments, comprising neurofilament light (NfL), medium, and heavy chains, are scaffolding neuronal proteins that are released upon neuronal injury. 2 Elevated NfL levels have been detected in the cerebrospinal fluid and sera of persons with MS (PWMS) and other neurodegenerative diseases.2,6–8 Recent reports support the utility of NfL as a prognostic marker for MS;9,10 higher serum NfL (sNfL) levels are positively correlated with clinical and imaging measures of disease severity in PWMS.2,11–13
We assessed the potential of sNfL as a biomarker for patients with relapsing–remitting MS (RRMS) in the pivotal ADVANCE (NCT00906399) trial. This longitudinal data set permitted the exploration of sNfL kinetics in patients achieving NEDA status compared with those exhibiting EDA.
Materials and methods
Study design
This was a post hoc analysis of data from ADVANCE, a randomized, multicenter, double-blind, placebo-controlled study assessing the efficacy and safety of peginterferon beta-1a for patients with RRMS, conducted from June 2009 to October 2013. Detailed methods and results for ADVANCE have been previously published.14,15
Adults with RRMS, an EDSS score of 0–5 and ⩾2 clinically documented relapses in the previous 3 years (including 1 within prior 12 months), were randomized to placebo or peginterferon beta-1a, 125 µg every 2 or 4 weeks for the first year of the study. For the second year of the study, patients who had received placebo were randomized to peginterferon beta-1a 125 µg every 2 or 4 weeks, and patients who had received active treatment during the initial study year continued on the same regimen for the second study year. Throughout ADVANCE, patients provided blood samples at baseline and every 3 months for 2 years. Upon completion of the trial, patients could continue in ATTAIN, an open-label extension study. 16 At this point, patients provided blood samples every 6 months up to 4 years. Collected samples were stored at –70°C. ATTAIN included 1076 (71%) of the 1512 patients randomized in ADVANCE (859 with baseline sNfL data available). 16 Patients with sufficient sample volume for the sNfL assay at ⩾4 time points were included in our analysis.
Standardized neurological assessments were completed by a blinded non-treating physician every 12 weeks and at the time of suspected relapse. Signif-icant clinical measurements included T2 lesion count and volume, gadolinium-enhancing (Gd+) lesion number, percent brain volume change (PBVC),17,18 MSFC and EDSS scores, and disease duration (measured from the onset of symptoms). Standardized MRI scans were obtained at baseline, 6 months, and 1, 2, 3, and 4 years.
sNfL levels
sNfL was measured in stored samples using a sensitive single molecule array (Simoa®, Quanterix, Lexington, MA) assay. 7 The assay was analytically validated for the fit-for-purpose sNfL evaluation. The measurements were performed in one round of experiments using one batch of reagents.
Standard protocol approvals, registrations, and patient consents
Patients in ADVANCE and ATTAIN provided written consent to participate14,16 and provide serum samples for possible use in future MS research. The protocols were approved by all participating sites and the studies were conducted according to the International Council for Harmonization Guideline on Good Clinical Practice and the Declaration of Helsinki.
Statistics
Where indicated, sNfL was analyzed with clinical and MRI parameters using Spearman correlation, analysis of variance, and multivariate logistic regression. Logged values were based on the natural log scale.
Multivariate regression models were used to assess whether baseline sNfL and other baseline factors might be predictive of clinical and MRI outcomes. Independent variables for all models in this report included treatment arm, age, sex, number of relapses, years since disease onset, and baseline measures for sNfL, EDSS, MSFC, Gd+ lesion count, and T2 lesion volume. Variables showing significant associations (p ⩽ 0.05) in univariate analyses or those thought to be clinically important (e.g. sNfL, treatment) were included in multivariate models. Non-significant predictors (p > 0.05) were removed from the model to arrive at a final parsimonious model. A negative binomial regression model was used for the number of new or newly enlarging T2 lesions in 4 years, and a generalized linear regression model was used for 4-year PBVC and for 4-year change in EDSS.
These statistical approaches offer Type III sum of square estimates, which provide information on each predictor’s strength and contribution to the model in the presence or adjustment of others in the multivariate model. The estimates are derived from the proportion of variance that each predictor (e.g. sNfL, age, and T2 lesion volume) contributes to the outcome (e.g. PBVC and EDSS); higher χ2 estimates (for new T2 lesions) or F-values (for PBVC and EDSS) indicate a stronger predictor. Change in brain volume and EDSS outcome variables were treated as continuous, and the number of new or newly enlarged T2 lesions outcome was treated as a count variable.
The possible utility of, and optimal time frame for, using sNfL changes to monitor disease progression and inform decision on disease-modifying therapy (DMT) use was explored using cross-sectional analyses on data from treated patients to determine whether a decrease in sNfL at 3, 6, 9, and 12 months was predictive of 4-year outcomes in brain volume, EDSS score, and new or newly enlarged T2 lesions. Two groups of patients treated with peginterferon beta-1a were created: (1) those with a baseline and post-baseline sNfL of at least 16 pg/mL (a threshold that was previously shown to be associated with higher MS disease activity) 19 and (2) those whose baseline sNfL was ⩾16 pg/mL but then decreased to <16 pg/mL post-baseline. These groups were compared using generalized linear regression models at each post-baseline time point for PBVC and EDSS score outcomes. New or newly enlarged T2 lesions were similarly assessed using a negative binomial regression model. Least square means estimates, along with 95% confidence intervals (CIs) and p values, were used to evaluate the “decreased sNfL” versus “no decreased sNfL” group comparisons.
An sNfL level ⩾16 pg/mL that we consider to be indicative of active disease comes from receiver operating characteristic analysis on 2000 bootstrapped baseline sNfL samples from nearly 500 PWMS pooled from three Biogen randomized controlled trials (sNfL distribution in these trials was similar). 19 The sensitivity and specificity of predicting new T2 lesions over the subsequent year were determined, and the thresholds of 8 and 16 pg/mL were observed to be associated with at least 80% sensitivity and specificity, respectively, in the majority of these resampled iterations (data not shown).
NEDA definition
Patients enrolled in ADVANCE were included in the EDA/NEDA analysis if they had more than one sNfL measurement (baseline data not required) and 4-year PBVC data (N = 897). PBVC does not factor into the EDA/NEDA definition we used but was superimposed on the data. NEDA was defined as exhibiting the following criteria at each available time point: no relapses, no new Gd+ lesions, no new or newly enlarged T2 lesions, and a <1-unit increase in EDSS score. Patients who only experienced a 1-unit increase in EDSS score from a baseline score of 0 or 1, however, were still considered NEDA if no other criterion was met. Patients who did not meet NEDA criteria were defined as EDA.
Data availability
To request access to data, please visit http://www.biogenclinicaldatarequest.com.
Results
Demographics
Baseline sNfL was measured in a total of 859 patients, representing both cohorts of the ADVANCE study: placebo (n = 393) and peginterferon beta-1a (n = 466). sNfL was also assayed at 1 year in 813 patients, and every ~3 months from baseline to 2 years in 511 patients. Of those 511 patients, 282 had sNfL measured at 2.5, 3, 3.5, and 4 years.
Baseline characteristics for patients in this study were similar between the treatment arms (Table 1). The mean (SD) age for the entire cohort was 36.9 (9.8) years and 70% of patients were female. The median (range) baseline EDSS score was 2.0 (0.0–5.5), and the mean (SD) baseline number of Gd+ lesions was 1.5 (4.0). Data are indicative of an MS cohort with mild-to-moderate disease activity.
Demographic and baseline characteristics for patients with available serum neurofilament light chain levels. a
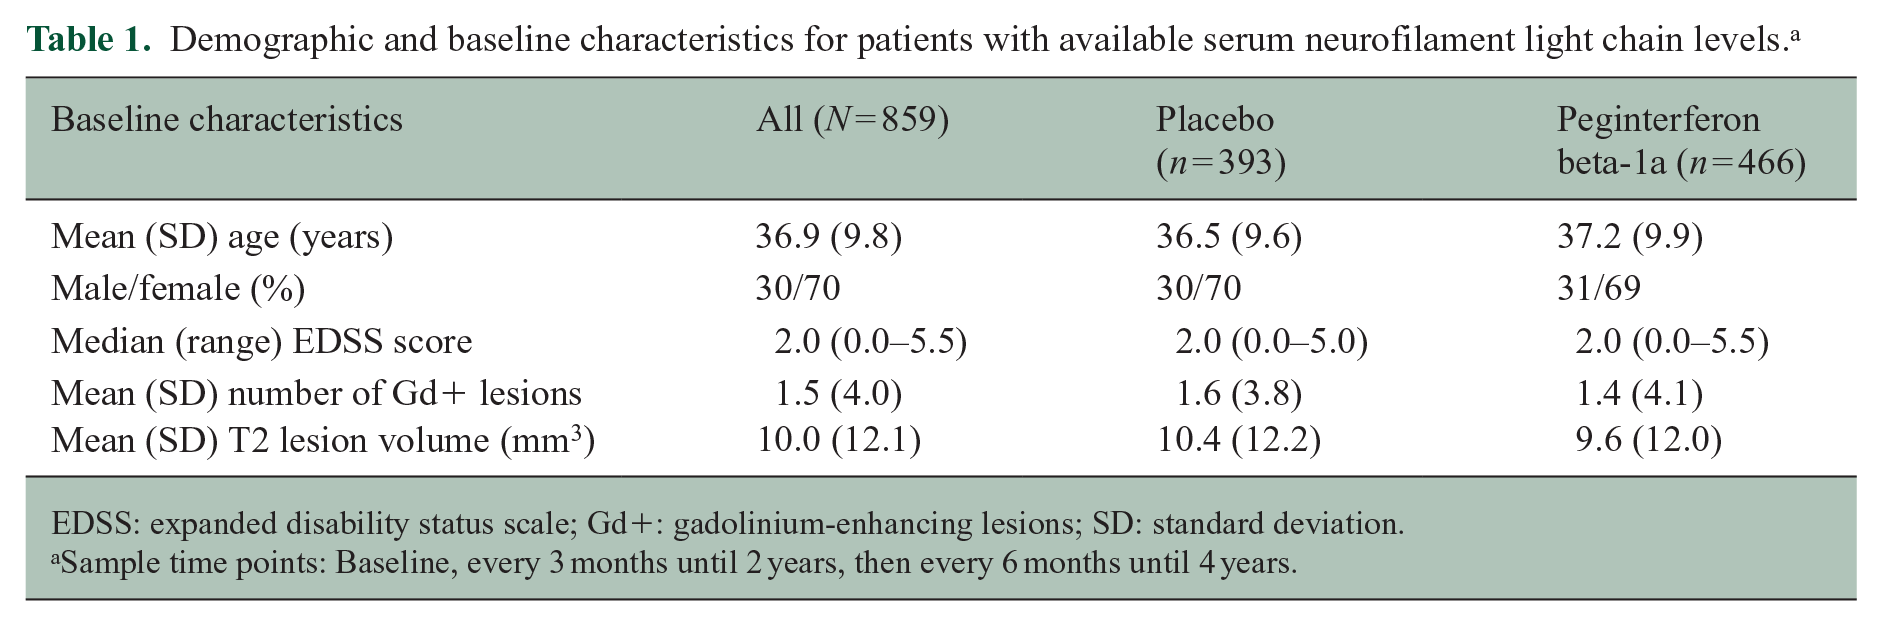
EDSS: expanded disability status scale; Gd+: gadolinium-enhancing lesions; SD: standard deviation.
Sample time points: Baseline, every 3 months until 2 years, then every 6 months until 4 years.
sNfL and MRI outcomes
Univariate analyses demonstrated that baseline sNfL was a significant predictor of T2 lesions on MRI (Supplemental Table 1), PBVC (Supplemental Table 2), and EDSS score (Supplemental Table 3).
Multivariate analyses, adjusted as described, demonstrated that baseline sNfL was one of the strongest predictors of brain atrophy, as measured by PBVC over 4 years (Table 2). The generalized linear regression model estimated that if a patient’s sNfL were to increase 2.7-fold, brain volume would decrease by 0.58% over 4 years. When the data are visualized on a scatterplot or across sNfL tertiles (Supplemental Figure 1), it is evident that higher baseline sNfL predicts greater brain atrophy at 4 years.
Multivariate regression models over 4 years (PBVC, EDSS, and new T2 lesions).
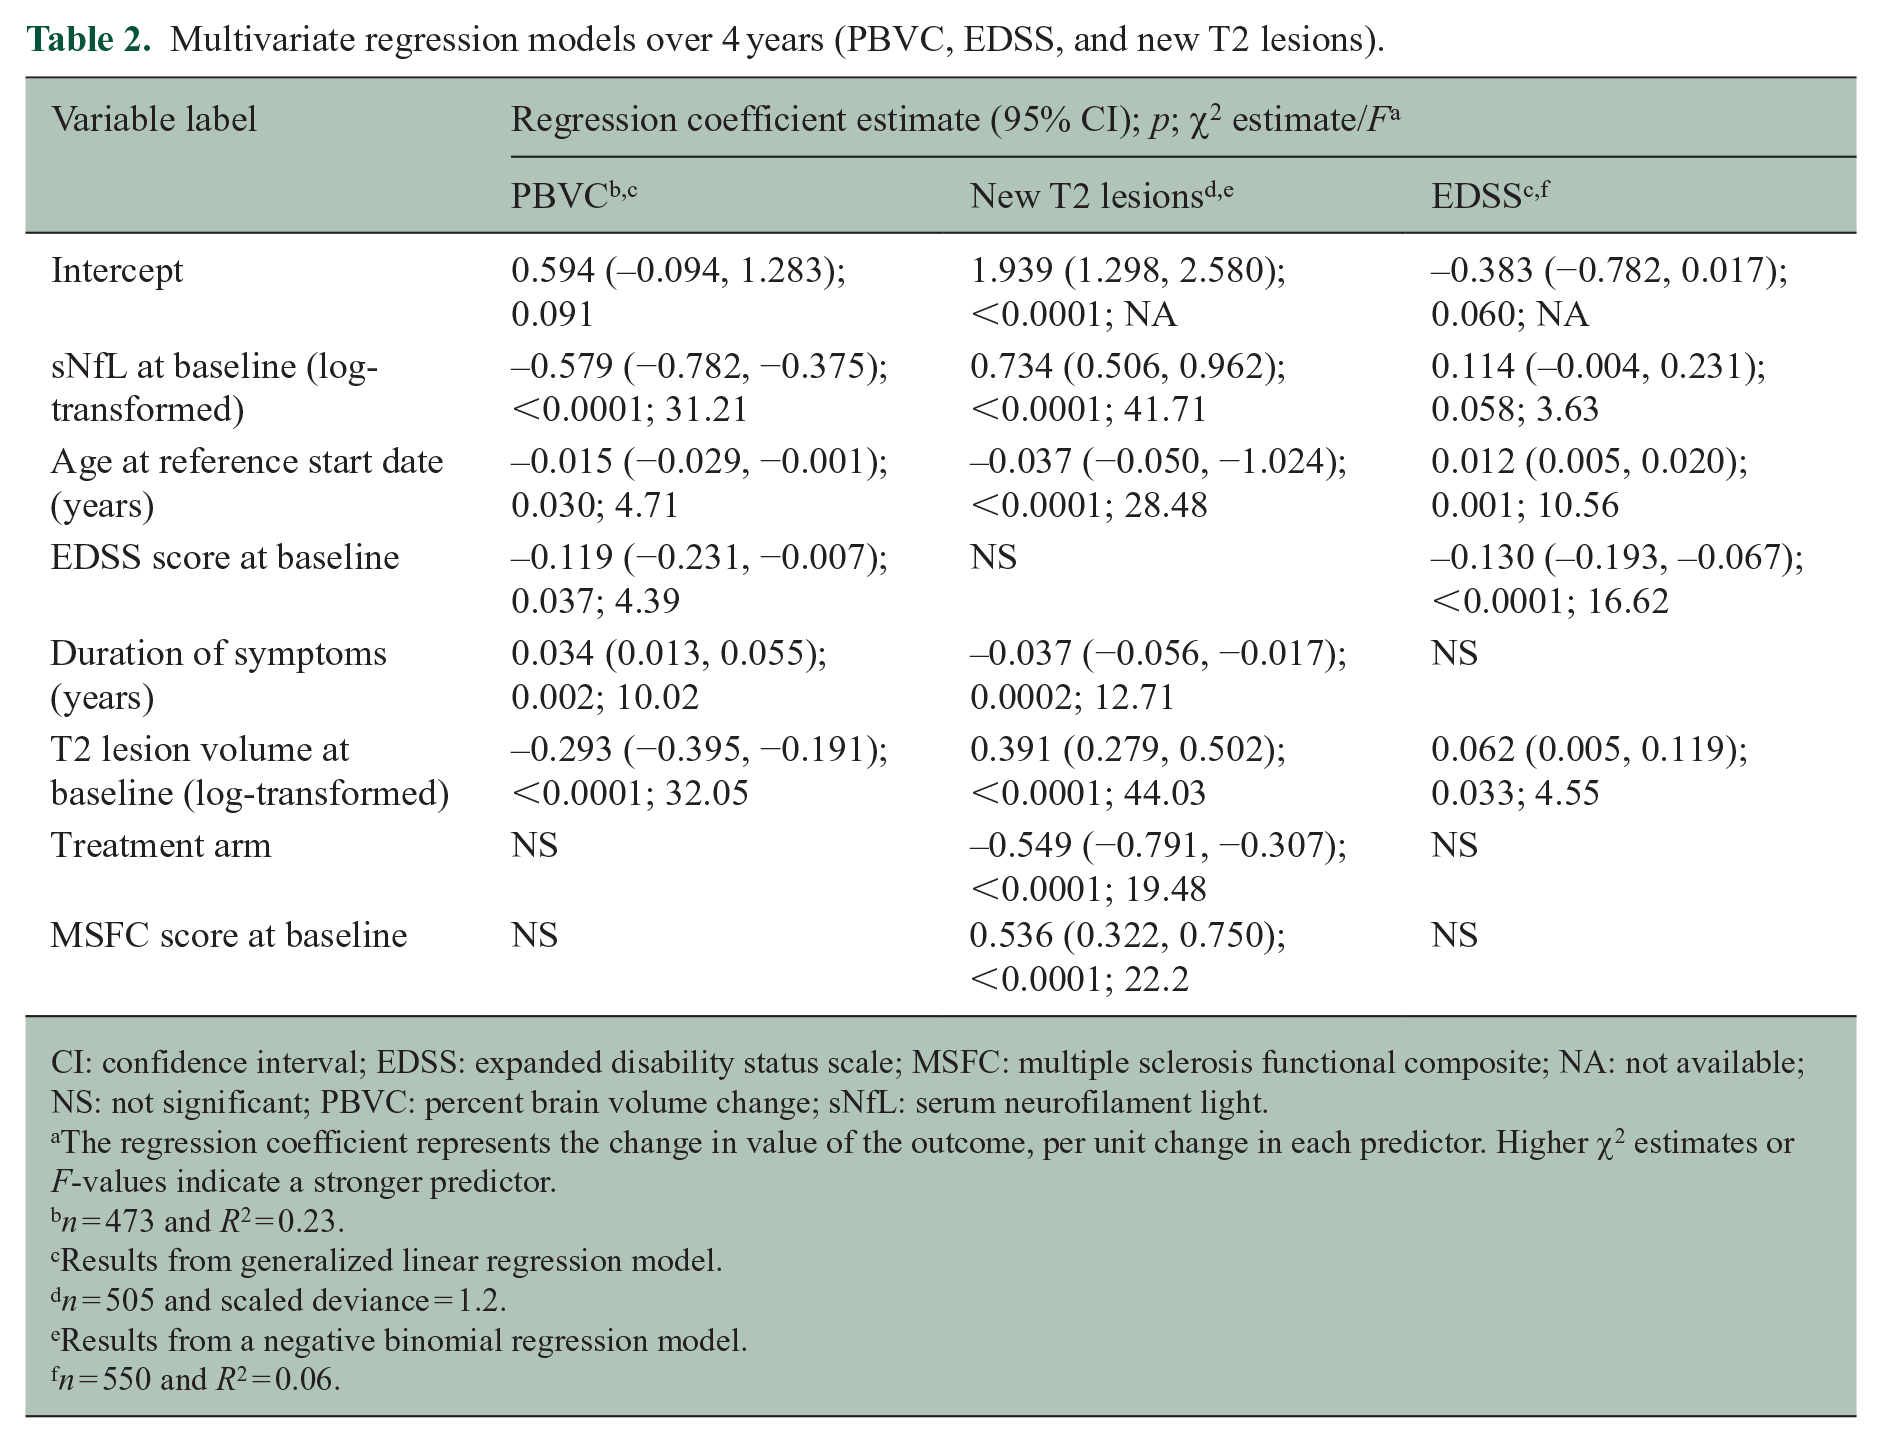
CI: confidence interval; EDSS: expanded disability status scale; MSFC: multiple sclerosis functional composite; NA: not available; NS: not significant; PBVC: percent brain volume change; sNfL: serum neurofilament light.
The regression coefficient represents the change in value of the outcome, per unit change in each predictor. Higher χ2 estimates or F-values indicate a stronger predictor.
n = 473 and R2 = 0.23.
Results from generalized linear regression model.
n = 505 and scaled deviance = 1.2.
Results from a negative binomial regression model.
n = 550 and R2 = 0.06.
The F-value for sNfL predicting PBVC over 4 years was 31.21, which was similar to that for baseline T2 lesion volume (32.05) and higher than that for duration of symptoms (10.02), age (4.71), or baseline EDSS score (4.39). In these analyses, baseline sNfL was also a significant predictor of new T2 lesions at 4 years (Table 2 and Supplemental Figure 2). The model suggests that a 2.7-fold increase in sNfL would yield twice the number of T2 lesions in 4 years. The χ2 estimate was 41.71 for sNfL at baseline, predicting new T2 lesions at 4 years. χ2 estimates for other significant covariates for predicting new T2 lesions at 4 years were baseline T2 lesion volume (44.0), age (28.5), baseline MSFC score (22.2), treatment arm (19.5), and disease duration (12.7).
Adjusting for baseline EDSS score, age and baseline T2 lesion volume were the strongest predictors of EDSS score at 4 years, whereas baseline sNfL was not a significant predictor (Table 2). F-values for the covariates for EDSS score at 4 years were baseline EDSS score (16.6), age (10.7), baseline T2 lesion volume (4.6), and baseline sNfL (3.6).
Relationship of sNfL with disease activity and treatment
In the 65 patients with NEDA across 4 years, consistently low (mean 8.3 pg/mL across all time points) and stable (25% average patient coefficient of variation) sNfL was observed (Figure 1(a)). However, patients with EDA (n = 832) over 4 years had higher (mean 12.3 pg/mL) and more variable (36% average patient coefficient of variation) sNfL (between-group p < 10–7 for both sNfL levels and patient sNfL coefficient of variation) (Figure 1(b)). sNfL was especially high and variable in patients exhibiting EDA whose average annualized decrease in PBVC across 4 years was >1% (Figure 1(b)).
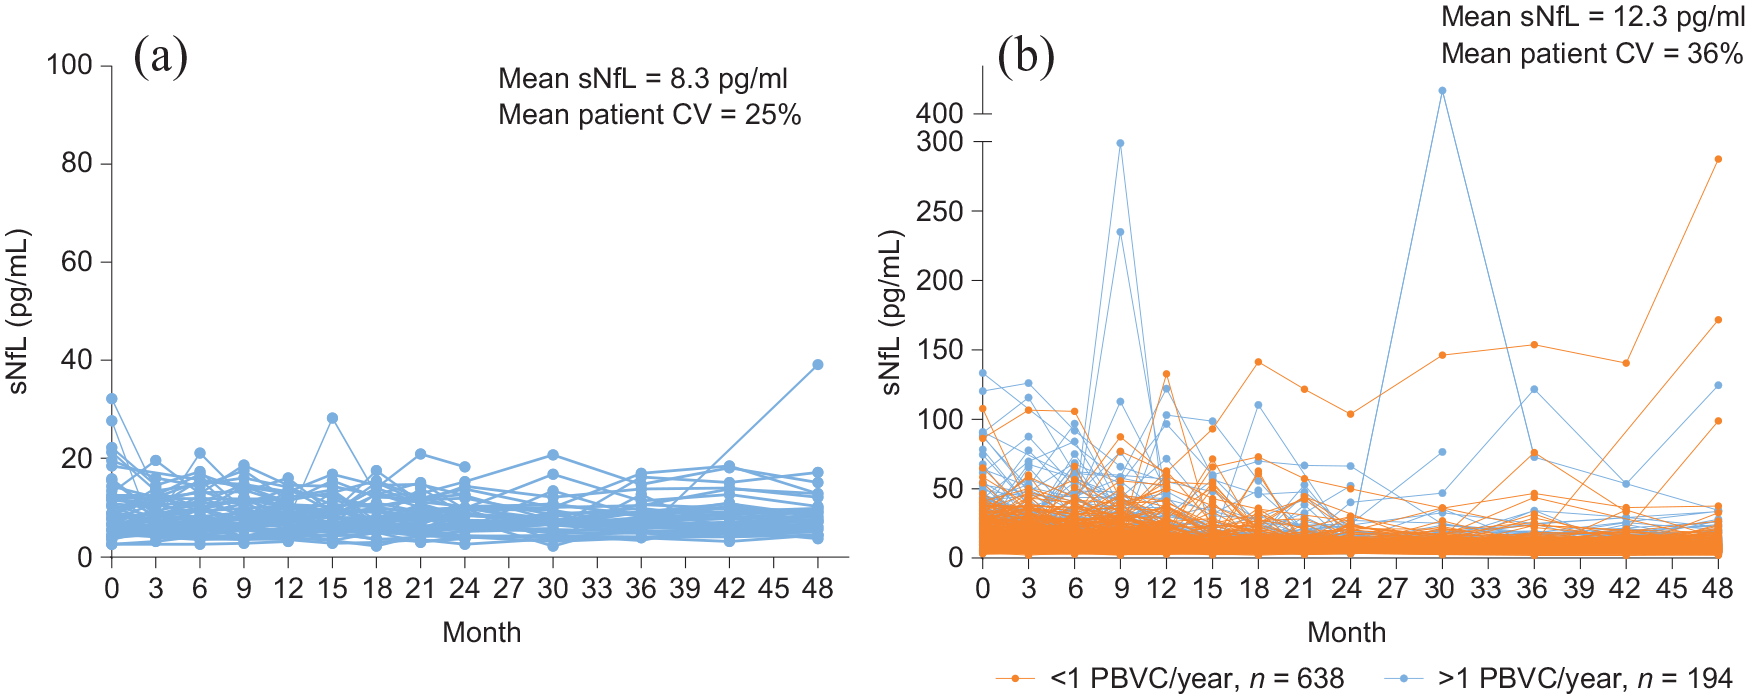
sNfL levels across time in patients classified as exhibiting NEDA or EDA: (a) patients classified as exhibiting NEDA for the entire duration of the study, n = 65 (NEDA for 4 years) and (b) patients classified as exhibiting EDA at any time during the study, n = 832 (EDA over 4 years). The average annualized PBVC is based on data collected at 6 months and at 1, 2, 3, and 4 years. Each line represents the sNfL data for an individual patient.
Similarly, the reduction in sNfL at 1 year compared with baseline was numerically greater with peginterferon beta-1a than with placebo. Patients receiving peginterferon beta-1a every 2 weeks exhibited an average decrease in 9.5% in sNfL after 48 weeks, whereas those receiving placebo exhibited an average increase in 6.8% (p < 0.01). Furthermore, 3% of the placebo cohort exhibited a reduction of sNfL to below the 16 pg/mL threshold, compared with 15% of patients receiving peginterferon beta-1a every 2 weeks (Figure 2).
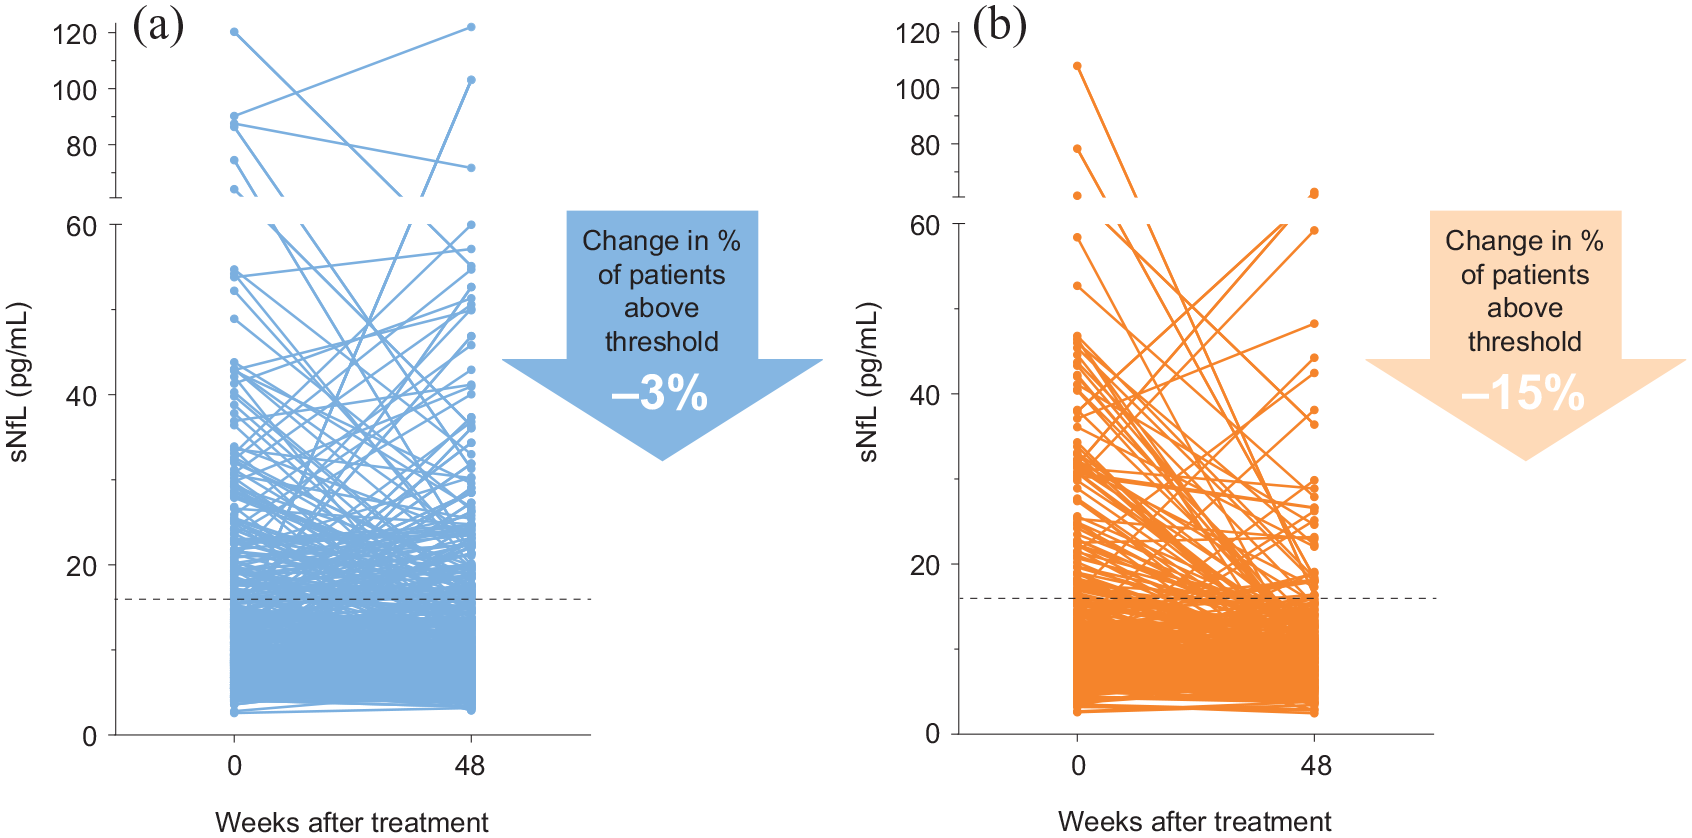
sNfL levels measured at baseline and 48 weeks. (a) Placebo, n = 373. (b) Peginterferon beta-1a cohorts, n = 350.
Predictive value of sNfL
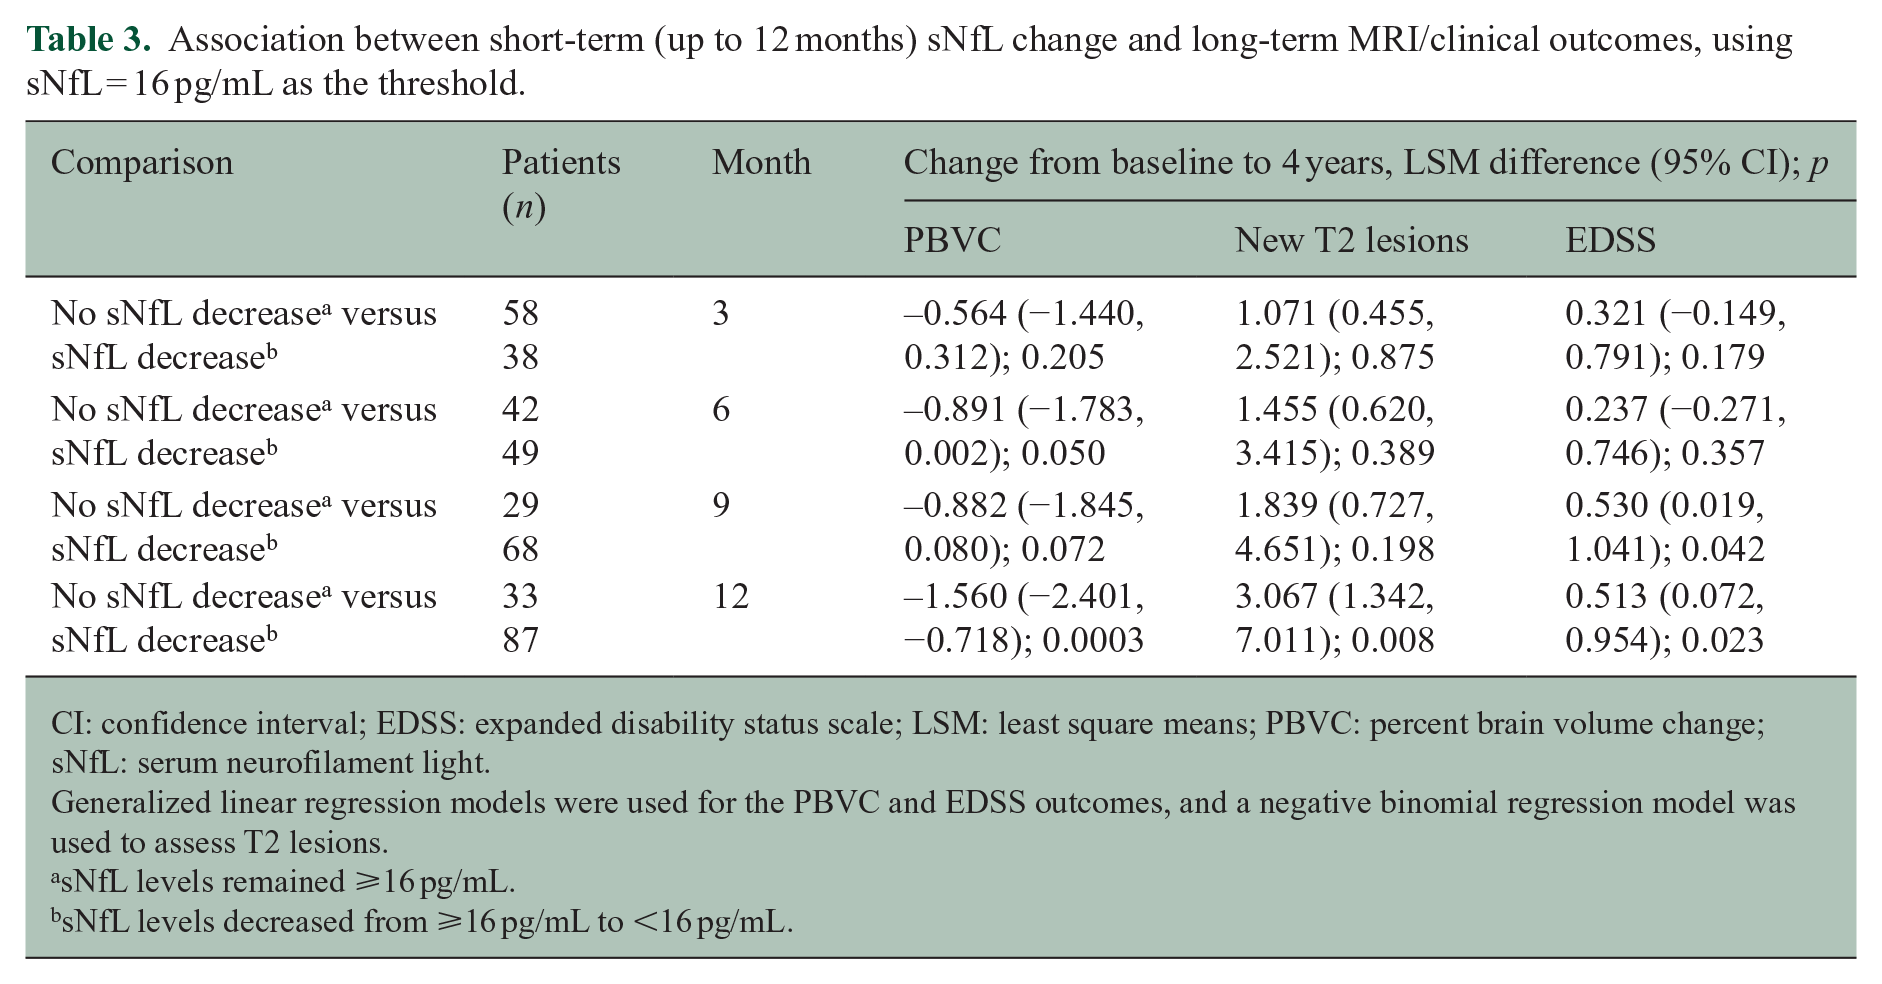
Table 3 provides data on the groups with baseline sNfL ⩾ 16 pg/mL and post-baseline sNfL: ⩾16 pg/mL or <16 pg/mL. A decrease in sNfL to <16 pg/mL at 6 months was associated with a significant (p = 0.05) reduction in 4-year PBVC (0.89%). Although significance of this association was not achieved at 9 months (p = 0.07), the difference between the groups’ PBVC was large (1.6%) and significant (p < 0.01) by 12 months. The first indication that a decrease in sNfL is associated with a 4-year change in EDSS (p = 0.04) is evident at 9 months; however, the average difference between the two groups’ EDSS scores is only 0.5 units; the results are similar for the 12-month sNfL readout (p = 0.02 for an EDSS difference of 0.5).
Association between short-term (up to 12 months) sNfL change and long-term MRI/clinical outcomes, using sNfL = 16 pg/mL as the threshold.
CI: confidence interval; EDSS: expanded disability status scale; LSM: least square means; PBVC: percent brain volume change; sNfL: serum neurofilament light.
Generalized linear regression models were used for the PBVC and EDSS outcomes, and a negative binomial regression model was used to assess T2 lesions.
sNfL levels remained ⩾16 pg/mL.
sNfL levels decreased from ⩾16 pg/mL to <16 pg/mL.
Finally, a decrease in sNfL to <16 pg/mL after 12 months of treatment was associated with an average threefold decrease in the number of new T2 lesions at 4 years (p < 0.01), compared with PWMS who did not exhibit a decrease in sNfL.
Discussion
Currently, MRI and clinical scoring scales, such as EDSS, are recommended for monitoring disease activity in PWMS.20–22 These outcome measures cannot detect subclinical changes, and they reflect pathological changes to different extents, which may explain the intra-patient lack of alignment that is often observed. Both of these measures reflect disease activity downstream from molecular mechanisms of disease.
Similarly, predicting disease course has proven elusive; and, indeed, the evolution of symptoms in PWMS across time is highly heterogenous.20,22 Identifying an earlier, real-time measure of neurodegeneration could complement the current arsenal of tools used by neurologists. sNfL shows promise as one such biomarker; as a molecular marker of axonal degeneration resulting from inflammation and demyelination, elevated sNfL can be surmised to indicate neurodegeneration before it manifests as severe and irreversible symptoms in the clinic.
In this study, we used longitudinal data to examine how sNfL tracks with MRI and clinical outcomes in MS. We confirmed earlier reports that suggest that a patient’s baseline sNfL is prognostic of disease outcomes and reduced with DMTs.11,13,23,24 We showed that a baseline level of sNfL is a significant predictor of both brain atrophy and the development of new T2 lesions at 4 years; these results support previous reports demonstrating that high sNfL predicted a more rapid decrease in brain volume 25 and, more recently, that sNfL tracks with brain atrophy in normal aging. 26 Our model also confirmed the findings of an earlier study that age, baseline EDSS score, disease duration, and baseline T2 lesion volume were predictive of 4-year PBVC. 27
Baseline sNfL was only weakly predictive of EDSS outcome. This finding may be due to measurement characteristics of EDSS, as it has been repeatedly noted that EDSS is nonlinear and somewhat coarse, and changes in the lower part of the scale may not necessarily be indicative of disease progression. On average, this cohort experienced a net increase in 1 EDSS unit from baseline to 4 years; this narrow range limits the outcomes that the model could span. These data, in conjunction with the strong predictive value for MRI metrics, suggest that monitoring sNfL in the clinic might supplement current approaches to prognosis and tracking disease course or activity.
The heterogeneous clinical presentation of MS may be explained with quantitative data obtained through measuring sNfL. The sNfL profile across time was consistently low and stable for patients exhibiting NEDA at 4 years. However, PWMS and EDA exhibited a heightened, 50% higher (on average), and erratic sNfL profile across time, especially if they were also experiencing a >1% annualized decrease in PBVC. These data suggest that a transitory, and especially prolonged, increase in sNfL is a harbinger of clinical disease activity.
On average, PWMS receiving peginterferon beta-1a every 2 weeks exhibited a 9.5% decrease in sNfL after 48 weeks, whereas the sNfL for those receiving placebo increased by 6.8% over the same time frame. As reported in ADVANCE, by 48 weeks, this same cohort of patients had a significantly reduced annualized relapse rate and risk of disability progression. Taken together, these data offer further evidence that sNfL can reflect DMT efficacy as well as disease activity.
Beyond cross-sectional associations, we explored how monitoring short-term changes in sNfL might predict long-term clinical and MRI outputs. At 3-month intervals, we examined how a reduction in sNfL might align with 4-year MRI and EDSS outcomes. A decrease in sNfL to <16 pg/mL as early as 6 months differentiated patients in 4-year PBVC values. At 12 months, however, the difference in the populations with NfL < 16 pg/mL versus ⩾ 16 pg/mL was significantly associated with 4-year changes in PBVC, EDSS, and new T2 lesions. Therefore, if sNfL readouts were to be implemented in the clinic for PWMS taking peginterferon beta-1a, a 12-month follow-up might be sufficient to assess whether a more aggressive treatment regimen is necessary for these patients. Timings for other DMTs will need to be investigated.
This study has limitations. As a post hoc study, interpretation of results is limited, but the results are in line with observations from other studies in PWMS.24,28–33 Because the study included only 1 year of placebo data, we were unable to compare the predictive effects of sNfL across patients receiving peginterferon beta-1a and placebo. Also, as with all extension studies, there is a possibility of ascertainment bias in the population of patients who continued in ATTAIN on completion of ADVANCE; however, there was <30% attrition from ADVANCE to ATTAIN. Finally, data from this trial may not be fully extrapolated into the clinical setting due to known effects of age 11 and comorbid illnesses 34 on sNfL, and future studies are needed to establish normative reference ranges.
This analysis of sNfL, in conjunction with MRI and clinical outcomes for MS in patients with RRMS in ADVANCE, supports sNfL as a promising candidate biomarker for assessing MS disease severity and treatment monitoring. Further studies are needed to understand how sNfL varies with age and other comorbidities; these data would inform, for example, an sNfL cutoff for NEDA in PWMS. If validated, sNfL could complement clinical and MRI measures in guiding decisions for treatment regimens.
Supplemental Material
sj-pdf-1-msj-10.1177_1352458520972573 – Supplemental material for Temporal profile of serum neurofilament light in multiple sclerosis: Implications for patient monitoring
Supplemental material, sj-pdf-1-msj-10.1177_1352458520972573 for Temporal profile of serum neurofilament light in multiple sclerosis: Implications for patient monitoring by Peter A Calabresi, Douglas L Arnold, Dipen Sangurdekar, Carol M Singh, Arman Altincatal, Carl de Moor, Bob Engle, Jaya Goyal, Aaron Deykin, Suzanne Szak, Bernd C Kieseier, Richard A Rudick and Tatiana Plavina in Multiple Sclerosis Journal
Footnotes
Acknowledgements
This study was sponsored by Biogen. Biogen provided funding for medical writing support in the development of this manuscript: Linda Wagner, PharmD, from Excel Scientific Solutions provided medical writing support, and Nathaniel Hoover from Excel Scientific Solutions copyedited and styled the manuscript per journal requirements. Biogen reviewed and provided feedback on the paper to the authors. The authors had full editorial control of the paper and provided their final approval of all content.
Author Contributions
P.A.C. was global PI of the ADVANCE study and participated in the design and biomarker component. D.S., A.A., and C.d.M. analyzed the data. C.M.S., J.G., A.D., and R.A.R. designed and conceptualized the study. P.A.C. D.L.A., D.S., C.M.S., A.A., C.d.M., B.E., A.D., S.S., B.C.K., R.A.R., and T.P. interpreted the data. A.D., S.S., and R.A.R. drafted the manuscript for intellectual content. A.A., D.S., C.d.M., B.E., A.D., S.S., B.C.K., R.A.R., and T.P. revised the manuscript for intellectual content and approved the final version. P.A.C., D.L.A., C.M.S., and J.G. revised the manuscript for intellectual content; had a major role in acquisition of the data; and approved the final version.
Declaration of Conflicting Interests
The author(s) declared the following potential conflicts of interest with respect to the research, authorship, and/or publication of this article: P.A.C. received consulting fees from Biogen and Disarm and grants from Annexon and Biogen. D.L.A. reports equity interest in NeuroRx during the conduct of the study and consulting activities with Biogen, Celgene, Frequency, Genentech, GeNeuro, Genzyme, MedImmune, Merck Serono, Novartis, Receptos, Roche, and Sanofi-Aventis, and received grants from Biogen, Immunotec, and Novartis. D.S., J.G., and T.P. were employees of Biogen at the time of this study. C.M.S., A.A., C.d.M., B.E., A.D., S.S., B.C.K., and R.A.R. are employees of and hold stock/stock options in Biogen.
Funding
The author(s) disclosed receipt of the following financial support for the research, authorship, and/or publication of this article: The original study and these analyses were supported by Biogen.
Supplemental Material
Supplemental material for this article is available online.
References
Supplementary Material
Please find the following supplemental material available below.
For Open Access articles published under a Creative Commons License, all supplemental material carries the same license as the article it is associated with.
For non-Open Access articles published, all supplemental material carries a non-exclusive license, and permission requests for re-use of supplemental material or any part of supplemental material shall be sent directly to the copyright owner as specified in the copyright notice associated with the article.