
Abstract
Background:
Obesity early in life has been linked to increased risk of developing multiple sclerosis (MS). Leptin and insulin are both associated with obesity, making them suitable candidates for investigating this connection.
Objective:
To determine if leptin and insulin are risk factors for relapsing–remitting multiple sclerosis (RRMS).
Methods:
In this nested case–control study using blood samples from Swedish biobanks, we compared concentrations of leptin and insulin in 649 individuals who later developed RRMS with 649 controls matched for biobank, sex, age and date of sampling. Only pre-symptomatically drawn samples from individuals below the age of 40 years were included. Conditional logistic regression was performed on z-scored values to calculate odds ratios (ORs) with 95% confidence intervals (CIs).
Results:
A 1-unit leptin z-score increase was associated with increased risk of MS in individuals younger than 20 years (OR = 1.4, 95% CI = 1.1–1.9) and in all men (OR = 1.4, 95% CI = 1.0–2.0). In contrast, for women aged 30–39 years, there was a lower risk of MS with increased leptin levels (OR = 0.74, 95% CI = 0.54–1.0) when adjusting for insulin levels.
Conclusion:
We show that the pro-inflammatory adipokine leptin is a risk factor for MS among young individuals.
Introduction
Multiple sclerosis (MS), a demyelinating autoimmune disease of the central nervous system (CNS), is thought to be caused by a combination of both genetic and environmental factors and is more than twice as common among females compared to males. 1 One environmental factor that in the last decade repeatedly has been linked to risk of developing MS is overweight, including obesity, early in life. 2 The incidence of both MS 3 and overweight 4 is increasing, making elucidation of this connection important.
Earlier prospective studies have used the body mass index (BMI; sometimes self-reported) or body silhouettes included in patient questionnaires to approximate adiposity. In this nested case–control study, we instead measure the adipokine leptin, which is strongly correlated to both BMI and total fat mass, 5 as well as insulin, a peptide hormone associated with both obesity and type 2 diabetes. 6 Elevated levels of both leptin 7 and insulin 8 among individuals with established MS have been previously shown, but to our knowledge, no prospective studies have been performed. Since pathological processes in MS may start many years or even decades before symptom onset, an effort was made to find serum or plasma samples drawn at a young age where risk factors ought to have the largest impact on disease risk.
The aim of this study was to further our understanding of overweight as a risk factor for MS by testing if leptin and insulin are associated with increased MS risk. To accomplish this, we compared blood concentrations of leptin and insulin, two molecules closely linked to metabolic function as well as to overweight, in samples drawn from MS patients before symptom onset and matched controls.
Materials and methods
Case ascertainment
Through cross-linking between the Swedish MS registry (www.neuroreg.se) and five microbiological biobanks, individuals with MS who had either serum or plasma stored in these biobanks were identified. For case identification in one additional biobank (Umeå), a registry of MS and possible MS diagnoses was used to identify those fulfilling diagnostic MS criteria used in routine clinical practice. Inclusion criteria for the study were that a sample drawn before symptom onset was available, the sampling age was below 40 years and that the person later had developed MS with relapsing onset (relapsing–remitting multiple sclerosis (RRMS)). One control without MS diagnosis was identified for each MS case and matched with decreasing priority for biobank, sex, age at sampling and sampling date. The six biobanks included in the study contain remainders from serological analyses, stored at −20°C, and are the Public Health Agency of Sweden (PHAS) biobank and microbiological biobanks from Umeå, Örebro, Göteborg, Skåne and Linköping (for case ascertainment flowchart, see Supplementary Figure in Bistrom et al. 9 ). All study participants were at least 18 years old at the initiation of the study in 2012. A total of 670 case–control sets were eligible to be included in the study but because of low sample volume, the final analysis was restricted to 649 sets of cases and matched controls.
Laboratory procedures
Serum or plasma samples were analysed with a multiplexed sandwich immunoassay with plates precoated with different capturing antibodies at spatially distinct spots (Mesoscale Discovery, Gaithersburg, MD 20877 USA). Plates were analysed using a MESO QuickPlex SQ120 that measures electrochemiluminescence and concentrations of analytes were calculated via standard curves obtained using Discovery Workbench 4.012 software.
Plates were analysed according to the manufacturer’s instructions using either a four-plex of active glucagon-like peptide-1 (GLP-1), insulin, glucagon and leptin (K15174C) or a two-plex including leptin and insulin (K15164C). Both kits use the same antibodies for leptin and insulin and are comparable. The four-plex kit was used on a limited number of samples to determine the feasibility of measuring insulin and active GLP-1 in addition to the already planned leptin analysis. Because active GLP-1 was below the detection range on most samples and the four-plex required additional sample volume, a switch to the two-plex kit was made. The insulin calibrator is traceable to the World Health Organization (WHO) standard 66/304. The leptin calibrator was from purified, recombinant human leptin expressed in Escherichia coli. Cases and controls were analysed on the same plate at the same run, pairwise but in random order, and case–control status was blinded to those performing the biochemical analysis. The coefficient of variation between plates was 4.91% and 6.12% for insulin and leptin, respectively.
Statistical analysis
Data were presented as median (interquartile range) for continuous variables and percentage for proportions. The Mann–Whitney U test was used to compare distributions between groups and Spearman’s Rho test was used to determine associations between leptin and insulin. Linear regression analysis was used to estimate long-term storage effect on insulin.
The age stratification was based on age at sample draw, and the study population was divided into three groups, <20 years, 20–29 years and 30–39 years. If cases and controls were on different sides of age cut-off, they were both assigned to either the oldest or youngest category that included either a case or control, to increase power in the smaller age groups.
Data for leptin and insulin were log10 transformed to achieve normal distribution. As there were significant differences in leptin and insulin levels between biobanks (Kruskal–Wallis test; p < 0.001), data were converted to z-score values separately for men and women in each of the six biobanks. This was done to enable statistical analysis combining all data in one model.
Individuals with levels of leptin (n = 27) and insulin (n = 22) below the quantification range were assigned a value equal to half the lower level of detection (LLOD) for the respective assays. Individuals with levels above the quantification range (leptin, n = 3) were assigned a value equal to the highest standard concentration. Odds ratios (ORs) were calculated using conditional logistic regression for the entire material as well as separately for men and women and stratified by age. Univariate models with either leptin or insulin were used as well as a multivariate model including both variables. All calculations were done in IBM SPSS statistics version 23 (IBM Corporation, New York, NY, USA).
Ethical considerations
The study was approved by the Regional Ethical Review Board in Umeå (2011-198-31M) and performed in accordance with the ethical standards of the Declaration of Helsinki. Study participants were informed of the study through a letter in the mail and had a chance to ask questions and opt out if they did not want to participate. No written informed consent was required for participation.
Results
Serum or plasma samples provided from six Swedish biobanks with a total of 649 individuals who later developed RRMS and 649 matched controls were included in the final analysis. A majority were females (84%). The median age at disease onset was 33 years, and the median time from blood sampling until first symptom was 8 years (Table 1).
Characteristics of cases and controls in six biobanks.
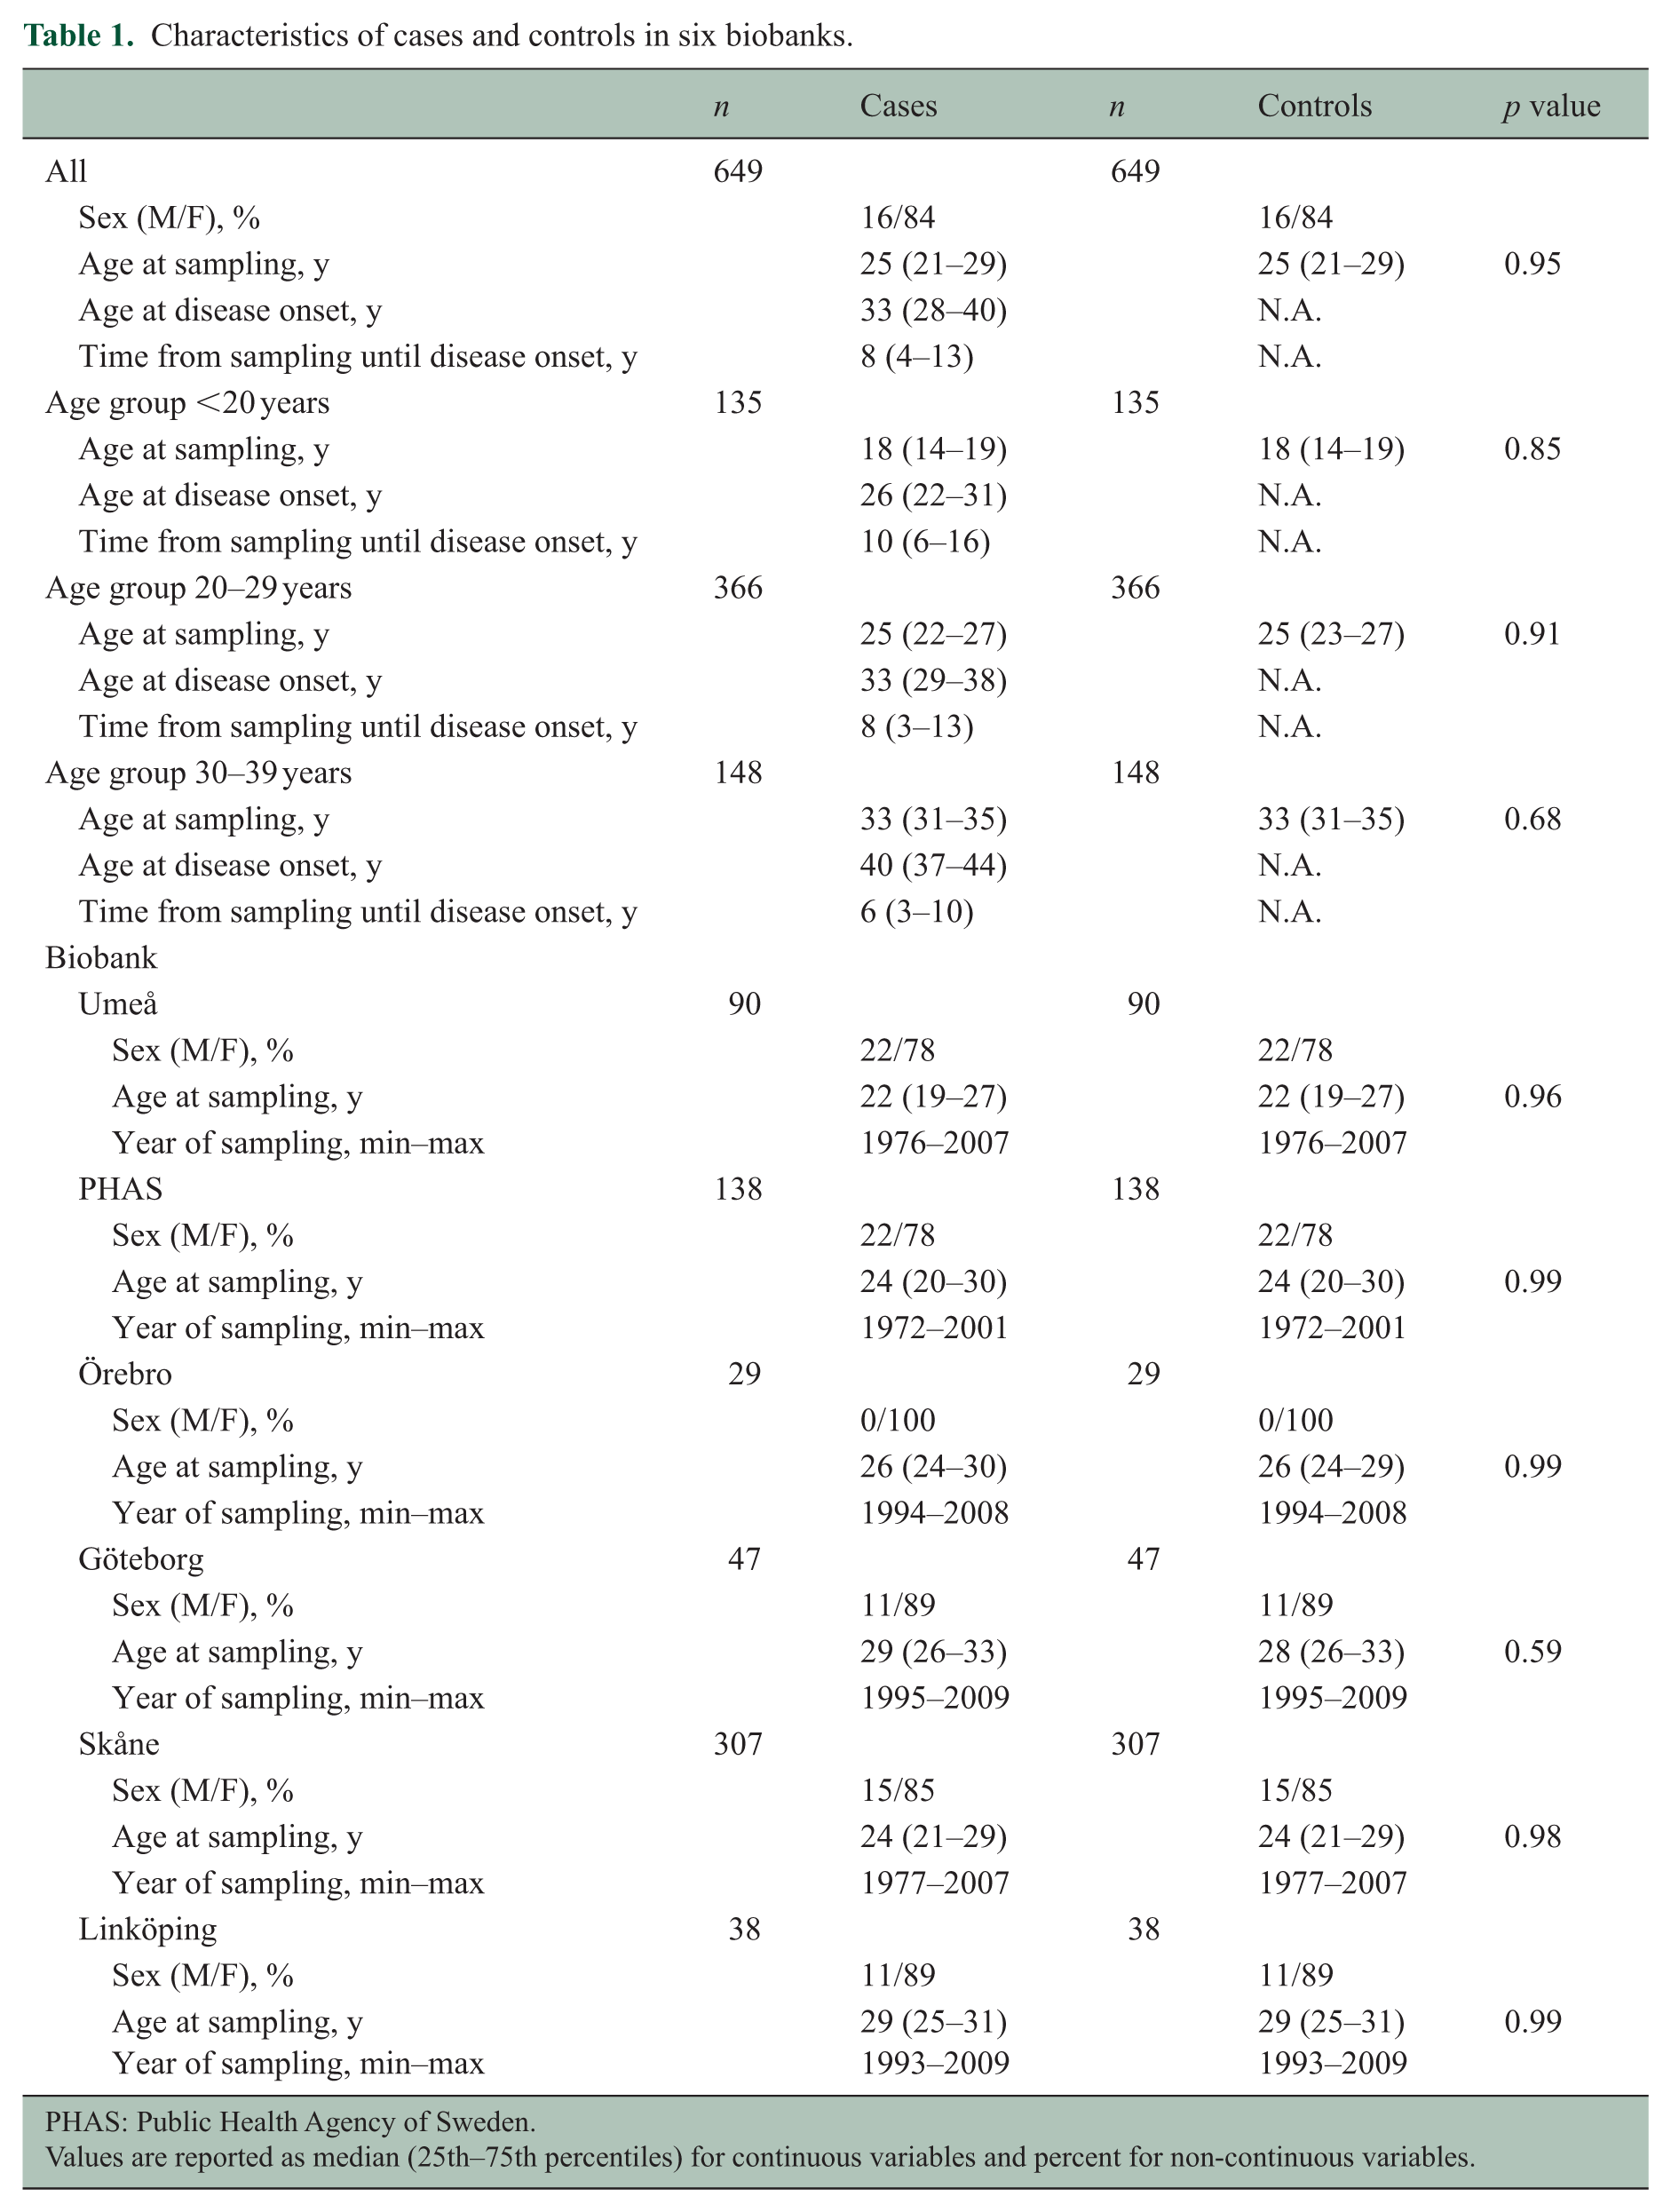
PHAS: Public Health Agency of Sweden.
Values are reported as median (25th–75th percentiles) for continuous variables and percent for non-continuous variables.
Leptin concentrations clearly differed between the sexes, where women had about five times as high median concentration of leptin as men. Cases and controls had similar concentrations of leptin and insulin, even when stratified for sex and age groups (Table 2, Figure 1). Leptin and insulin were positively correlated for both cases and controls, with a Spearman’s Rho of 0.37 (p < 0.001) and 0.41 (p < 0.001) for cases and controls, respectively. These results were similar when looking at men and women separately.
Concentrations of leptin and insulin among cases and controls.
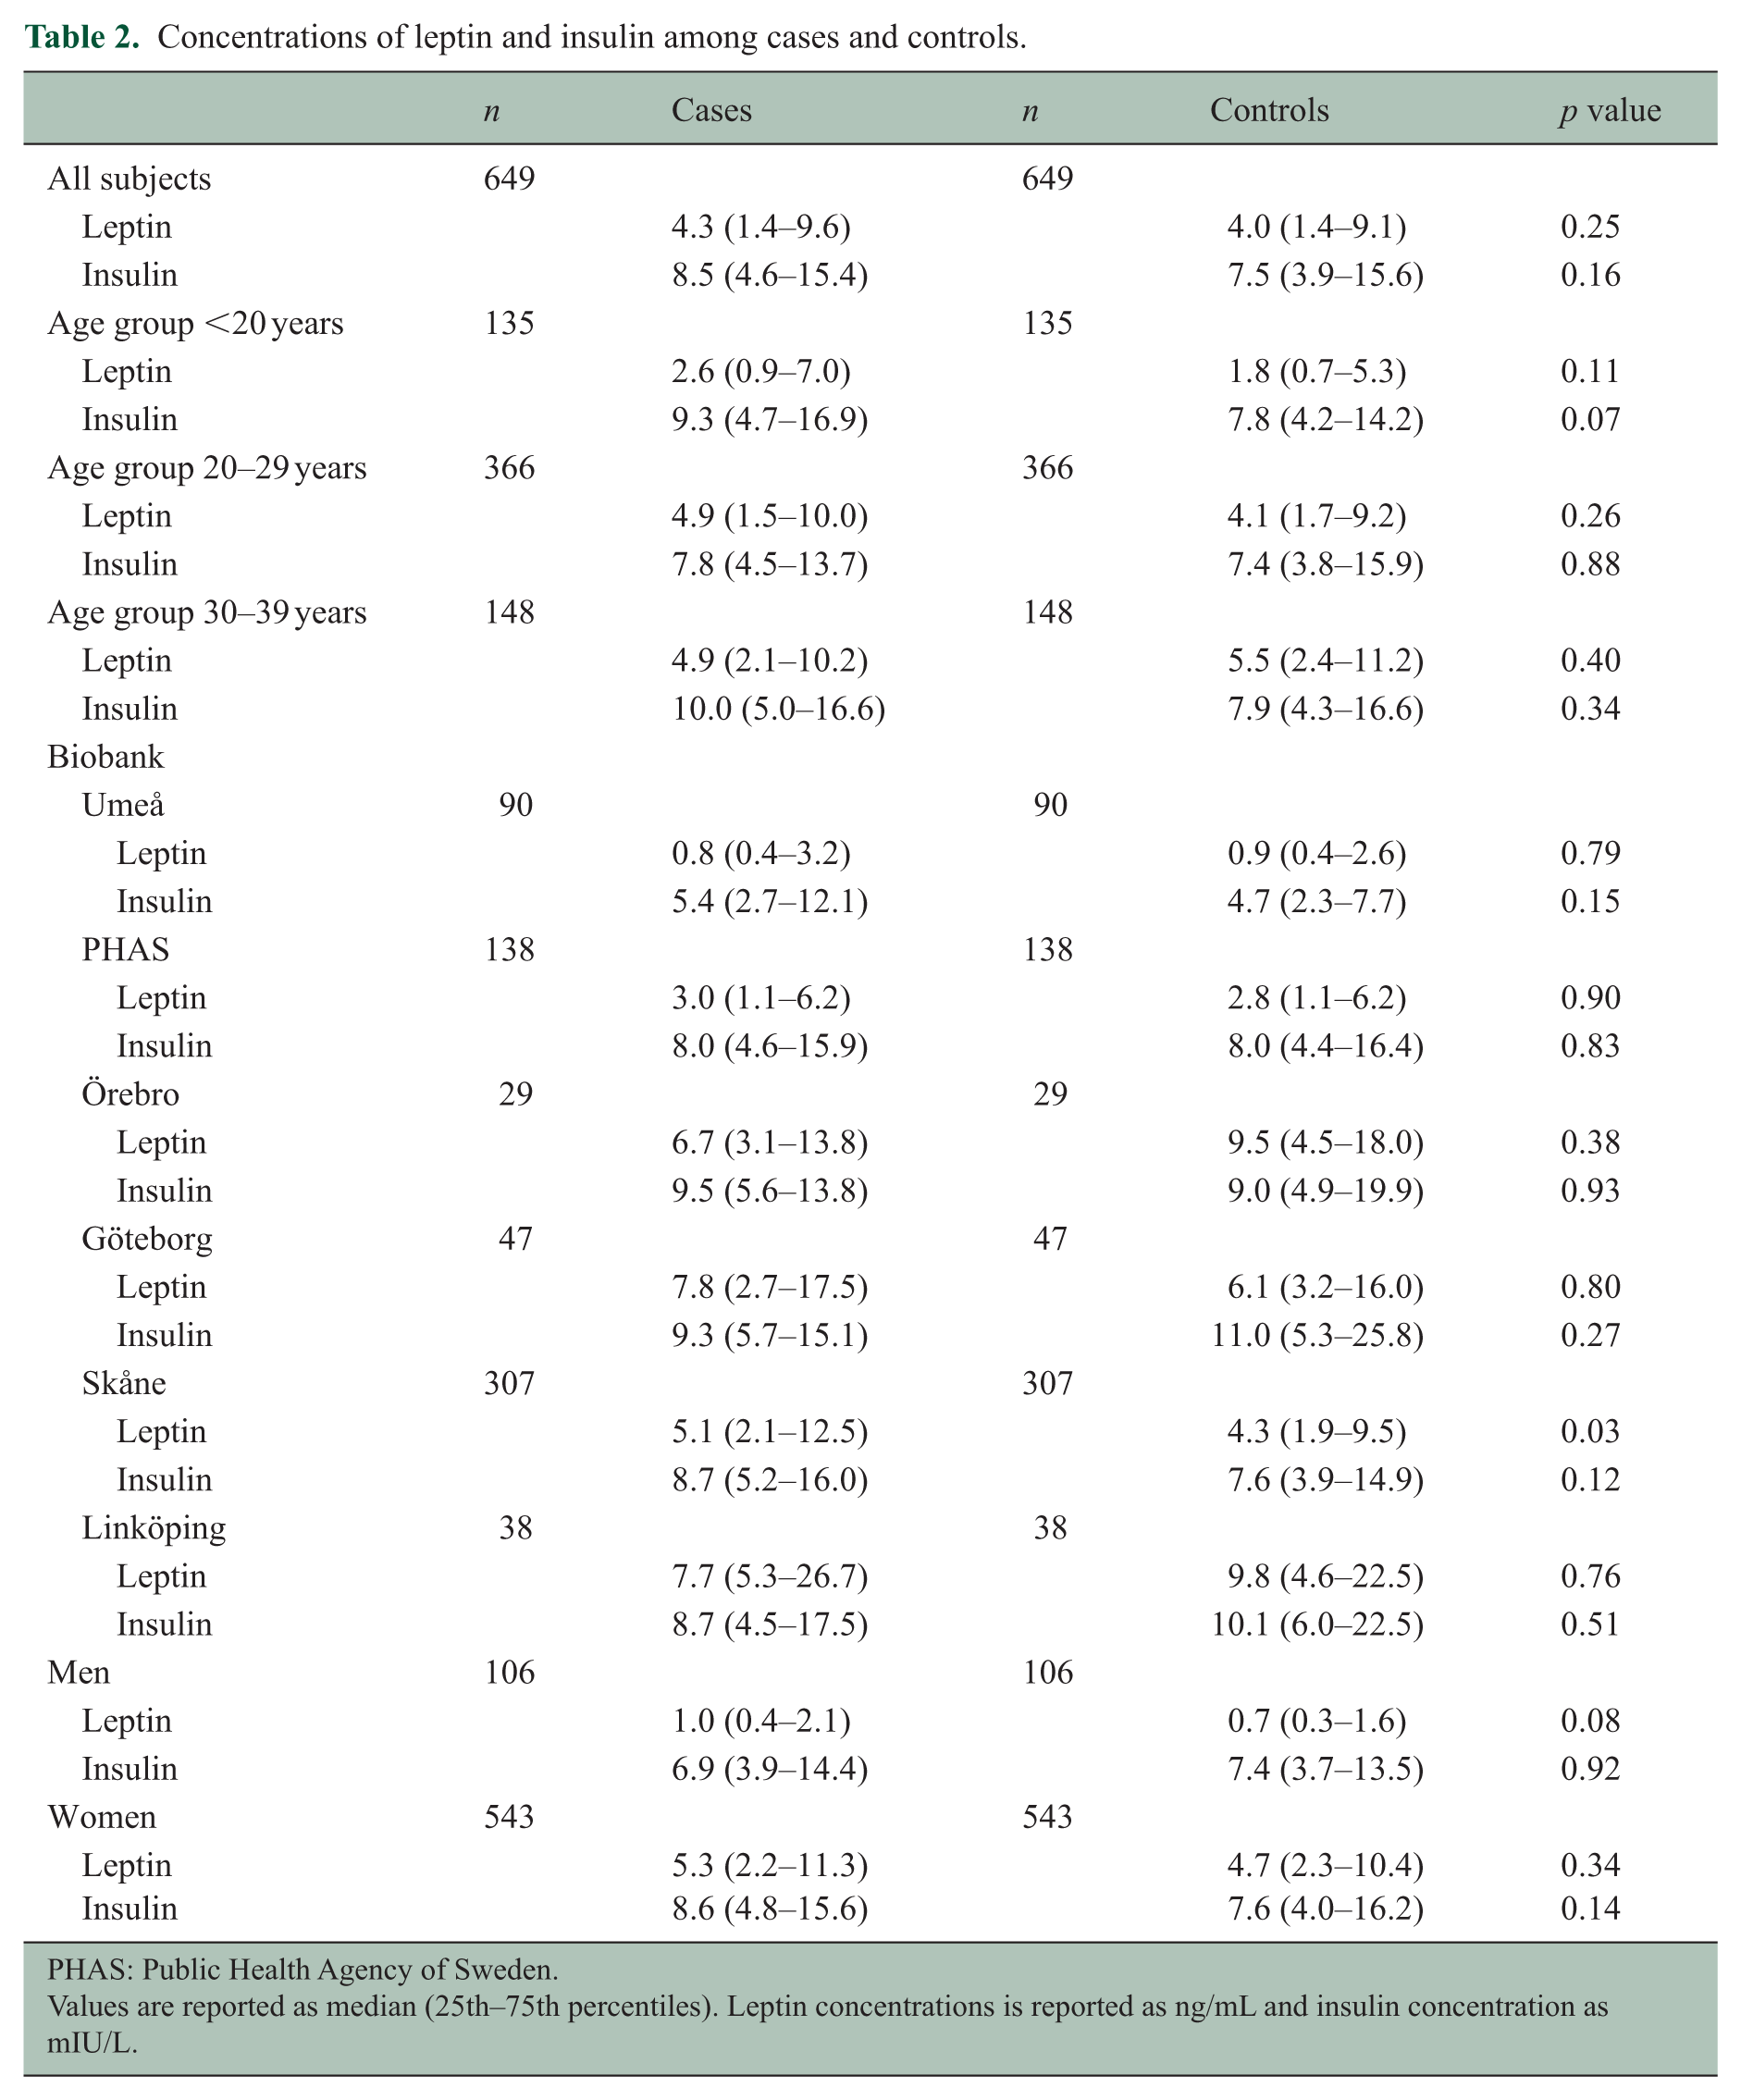
PHAS: Public Health Agency of Sweden.
Values are reported as median (25th–75th percentiles). Leptin concentrations is reported as ng/mL and insulin concentration as mIU/L.
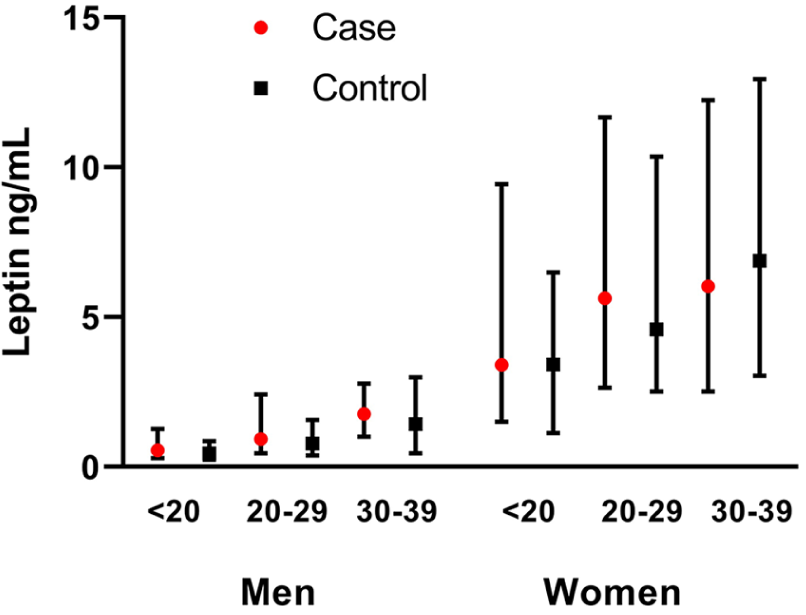
Median leptin concentrations among cases and controls stratified by sex and age.
Insulin was not associated with risk for MS in either univariable or multivariable analysis (Table 3). There was no association between MS risk and a 1-unit increase in z-score leptin in the total cohort. In the youngest subgroup (<20 years), but not in the older subjects, a 1-unit increase in z-score leptin was associated with higher MS risk (OR = 1.4, 95% confidence interval (CI) = 1.1–1.9). This association was still present after including insulin in the model (OR = 1.4, 95% CI = 1.0–1.9). In the oldest subgroup (30–39 years), the OR for leptin was 0.78 for women, although not significant. However, when including insulin in the model, these women had a significantly lower MS risk (OR = 0.74, 95% CI = 0.54–1.0). Further stratifying women aged >20 years into smaller age groups showed a consistently lower OR for every 5-year increase in age (data not shown). For men, leptin was significantly associated with increased MS risk in the univariate model (OR = 1.4, 95% CI = 1.0–2.0) and in the model including insulin, with the same OR. Stratification for age showed associations in the same direction across all age groups, although no longer significant.
Associations between 1-unit z-score increase in leptin and insulin levels and risk of MS.
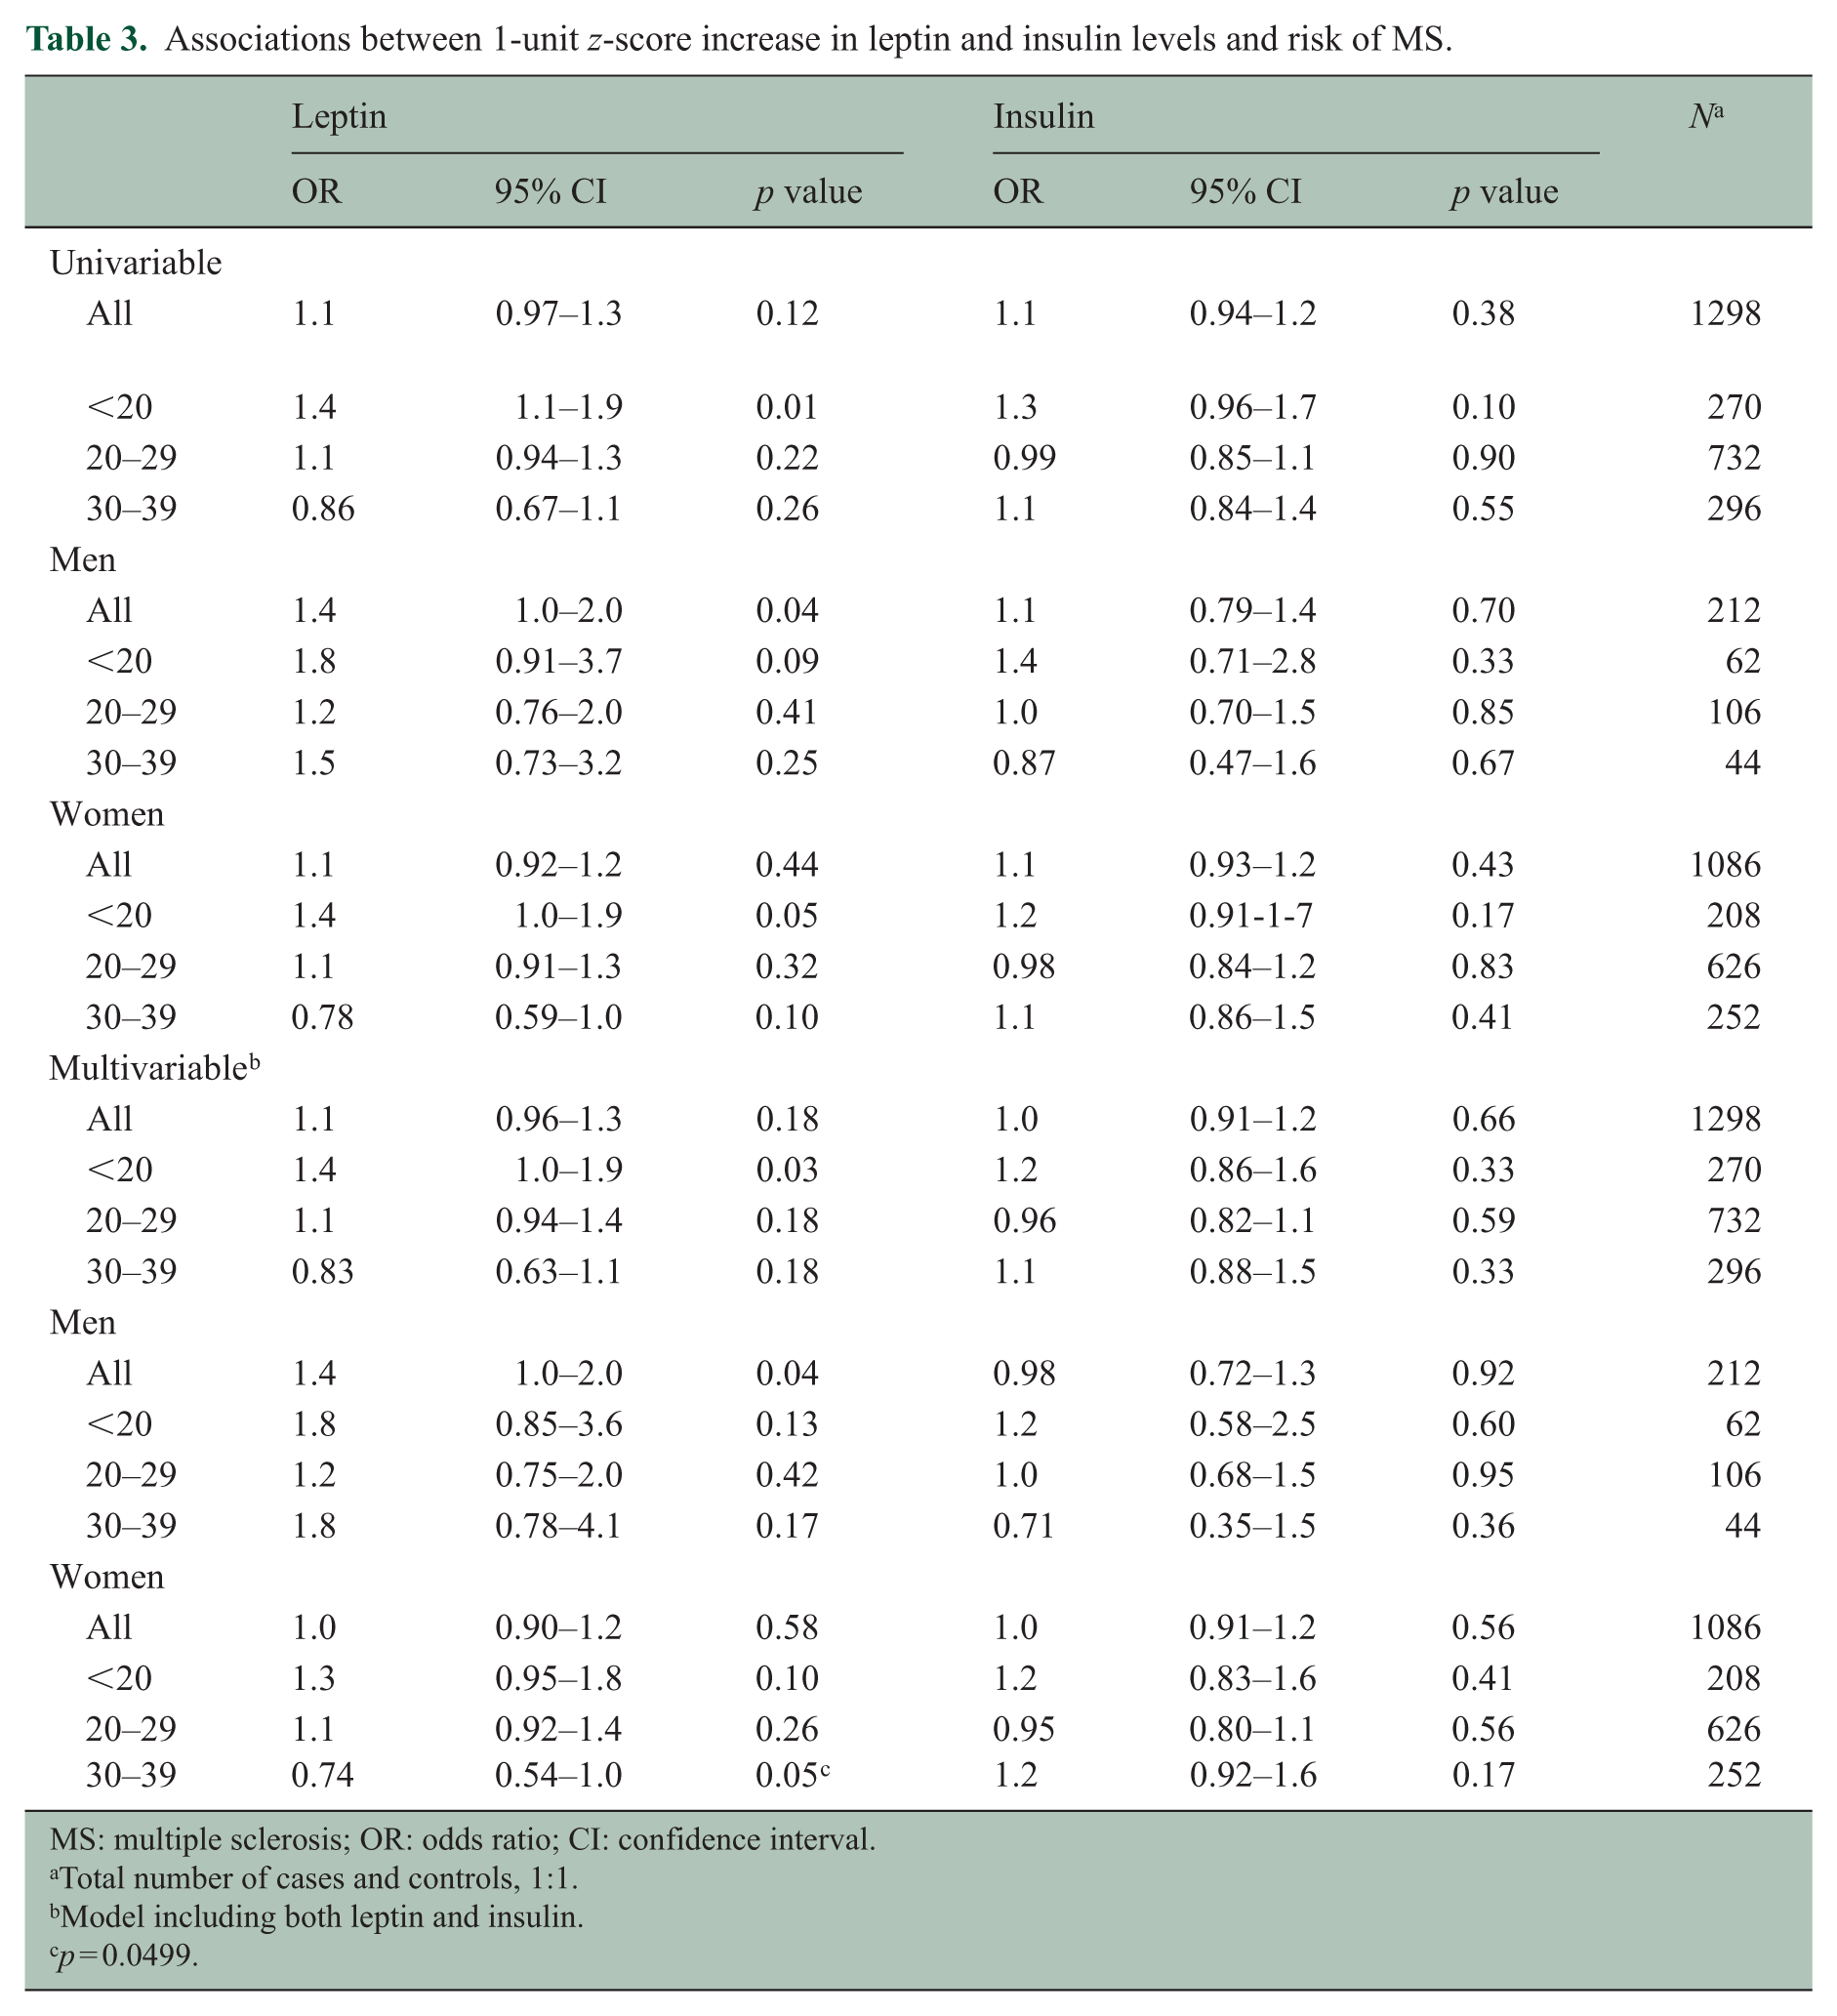
MS: multiple sclerosis; OR: odds ratio; CI: confidence interval.
Total number of cases and controls, 1:1.
Model including both leptin and insulin.
p = 0.0499.
Discussion
In this study utilizing prospectively collected samples, an increase in leptin concentration was associated with an elevated MS risk among those younger than 20 years at time of blood sampling but not among older individuals. This association was significant independently of insulin concentrations, and a similar pattern was observed for both men and women in this age group. These findings are in line with earlier studies on BMI and MS that has shown a risk increase associated with higher BMI at a young age (18–20 years).10,11 In Norway, however, a large body size was found to increase MS risk up to the age 30 years, with a peak at the age of 25 years, 12 indicating that the risk increase may persist throughout the 20s.
A different pattern was seen in the oldest age group, aged 30–39 years, where higher leptin levels were associated with lower MS risk for women, after adjusting for insulin. A similar finding, among men in their 30s, has been observed in an earlier study where a protective effect from higher BMI was observed. 13 One explanation for these findings could be that prodromal MS induces weight loss 10 and that the lower leptin or BMI among cases is a result of reverse causation. An alternative explanation is that adiposity has differential influence on MS risk depending on age. Such an age-dependent influence could contribute to the age incidence curve in relapsing MS, with a peak just before 30 years of age. 14
Increase in white adipose tissue is known to induce a chronic, low-grade inflammatory state with increased production of inflammatory cytokines and adipokines, collectively known as adipocytokines. 15 One of the most well studied adipokines is leptin, which, besides playing an important role in energetic homeostasis, has far reaching effects on the immune system and has been implicated in autoimmune diseases including MS. 16 Leptin is mainly produced by adipocytes in proportion to their triglyceride content and exerts its homeostatic effect on bodily energy stores by binding to leptin receptors in the CNS, providing information to the brain about available fat stores and thereby modulating energy intake and expenditure. In obesity, leptin signalling is blunted, explaining why the increased leptin levels caused by the increased fat mass fail to restrict weight gain. 17 Leptin concentration in blood has been shown to correlate well to percent body fat and BMI with clear differences between the sexes where significantly higher levels are seen in women compared to men. This difference disappeared in one study after adjusting for fat mass, 5 but not in another. 18
Support for an association between adolescent overweight or obesity as measured by BMI and MS already exists for women in the form of cohort studies10,19 and case–control studies 13 and for both men and women in a large case–control study. 11 A recent case–control study provides further support for an association among men. 20 In addition, a study comparing self-reported body size found that a larger body size in childhood and young adulthood was associated with increased risk of MS for both men and women in a subset of the study population. 12 Regarding risk for paediatric MS or clinically isolated syndrome, a case–control study found an increased risk among obese girls but not boys. 21 Mendelian randomization studies have also indicated a causal link between BMI and MS risk, showing that genes that elevate BMI increase the risk of MS.22,23
Earlier case–control studies on leptin in patients with established MS have shown conflicting results, but according to a recent meta-analysis, leptin levels are higher among those with MS. 7 There are also studies indicating a role for leptin in induction of experimental autoimmune encephalomyelitis (EAE), the animal model of MS, where leptin deficient mice failed to develop EAE unless leptin was systemically administered. 24
We found that insulin and leptin levels were correlated, as has been seen in earlier studies. 18 Insulin is also associated with obesity 25 and is a marker of insulin resistance in the metabolic syndrome. However, including insulin in our leptin models did not change the increased MS risk in young subjects (<20 years) and showed that high leptin concentrations are associated with a decreased risk for MS among the oldest women. Increased insulin resistance has been shown in patients with established MS compared to healthy controls, 8 even among those recently diagnosed. 26 A plausible explanation for this finding is that loss of function because of MS leads to lower physical activity, which with time will increase the risk for insulin resistance.
While evidence has been mounting lately that overweight during adolescence influences MS risk, in accordance with the results of this study, much is still unknown about the mechanism through which adiposity exerts its effects. Leptin acts as an important link between white adipose tissue and other organs in the body and directly influences the immune system in such a way as to promote autoimmunity. This includes effects on both T- and B-lymphocytes, which have key roles in MS pathogenesis. More specifically, leptin decreases regulatory T-cell activity and increases the activity of Th1 and Th17 cells as well as an increased proliferation and cytokine production among B-lymphocytes. 27
It is a well-known fact that women are more prone to develop many autoimmune diseases including MS, with sex ratios ranging from 9:1 for systemic lupus erythematosus (SLE) to a more modest 2:1 or according to more recent data 3:1 for MS, with rheumatoid arthritis (RA) having a ratio somewhere in between. 28 For both SLE and RA patients, serum levels of leptin appear to be increased 29 as is also the case with MS. 7 Since women have higher levels of leptin than men, even at the same BMI, it is attractive to propose elevated leptin as a possible explanation for the observed sex difference in disease occurrence. 30 In the present study, women had about five times higher median leptin concentrations compared to men, providing an example of a sex difference that no other known MS risk factor has shown, giving support to the notion that leptin may be of etiological importance. While the association between leptin and MS risk was reversed with older age for women in this study, no such tendency was observed for men, possibly indicating sex-dependent differences in the effects of leptin. Analogous to the reasonings here, leptin has also been suggested as an explanation for the female preponderance of osteoarthritis. 31 In addition, sex-related differences in the induction phase of EAE have been suggested to depend on differences in leptin levels. 32
There are limitations to consider in our study. First, the demographics and preanalytical conditions differed between biobanks. To correct for this, all cases were matched to controls from the same biobank, and the conversion to z-scores was performed separately for each biobank. While leptin is relatively stable for both cold storage and multiple freeze–thaw cycles, 33 there are reports that insulin may be sensitive to long-term storage. 34 Therefore, we performed linear regression analysis that showed no association between storage time and insulin levels among female controls (stored approximately 9–46 years prior to analysis, n = 543); Insulin (mIU/L) = 0.007 × Storage Time (years) + 13.3; p = 0.95 R2 < 0.001. Second, parts of the samples from the Umeå biobank were analysed using the four-plex assay, while all other biobanks were analysed with the two-plex assay. To address this, we performed a sensitivity analysis where the Umeå biobank was excluded. In this analysis, leptin was still significantly associated with increased MS risk in the youngest group in the univariate model, but this was no longer significant when adjusting for insulin (p = 0.07). Third, the blood samples in our study were not drawn in a fasted state and not at the same time of day, despite leptin having a diurnal variation and insulin being affected by fasting status. As this applies equally to both cases and controls, the risk of systematic bias is reduced. In addition, we had no data on BMI at the time of blood sampling; thus, effects of BMI could not be studied. Furthermore, the female preponderance in this study (84%) lowered the statistical power to detect effects of the studied markers in men. These findings were made in a Swedish population, and whether the results may be generalized to other MS populations is uncertain. The samples used in the present study were not overlapping with those used in earlier publications on a smaller number of samples, such as a nested case–control study on vitamin D and Epstein–Barr virus serology. 35 Since vitamin D may be part of the same causal pathway as obesity in relation to MS risk and an interaction between adolescent obesity and infectious mononucleosis has been suggested, data on these two risk factors in relation to leptin levels would be of interest for future studies.
To conclude, this study using prospectively drawn samples implicates leptin as a risk factor for MS and further supports earlier studies indicating that overweight early in life increases MS risk. Differences in leptin levels may furthermore help explain the observed sex differences in MS occurrence. Further studies are warranted, however, to determine the possible role of leptin in MS pathogenesis.
Footnotes
Acknowledgements
We would like to thank Andreas Tellström for assistance with biochemical analysis.
Declaration of Conflicting Interests
The author(s) declared the following potential conflicts of interest with respect to the research, authorship and/or publication of this article: M.B., O.A., D.J., M.G., J.H. and P.S. report no conflict of interest. L.A.-M. has received speaking fees from Merck Serono and served on advisory board for Merck Serono and Biogen. M.V. has received honoraria for lectures from Genzyme and for advisory boards from Roche and Novartis.
Funding
The author(s) disclosed receipt of the following financial support for the research, authorship and/or publication of this article: This work was supported by the Swedish Research Council (2015-02419).