
Abstract
Background:
Researchers studying health-related quality of life (HRQOL) in multiple sclerosis (MS) can choose from many instruments, but findings from studies which use different instruments cannot be easily combined. We aimed to develop a crosswalk that associates scores from the RAND-12 to scores on the Health Utilities Index—Mark III (HUI3) in persons with MS.
Methods:
In 2018, participants in the North American Research Committee on Multiple Sclerosis (NARCOMS) registry completed the RAND-12 and the HUI3 to assess HRQOL. We used item-response theory (IRT) and equipercentile linking approaches to develop a crosswalk between instruments. We compared predicted scores for the HUI3 from each crosswalk to observed scores using Pearson correlations, intraclass correlation coefficients (ICCs), and Bland–Altman plots.
Results:
Of 11,389 invited participants, 7129 (62.6%) responded. Predicted and observed values of the HUI3 from the IRT-linking method were moderately correlated (Pearson r = 0.76) with good concordance (ICC = 0.72). However, the Bland–Altman plots suggested biased prediction. Predicted and observed values from the equipercentile linking method were also moderately correlated (Pearson r = 0.78, ICC = 0.78). The Bland–Altman plots suggested no bias.
Conclusion:
We developed a crosswalk between the RAND-12 and the HUI3 in the MS population which will facilitate data harmonization efforts.
Introduction
Multiple sclerosis (MS) is characterized by physical and cognitive impairments and by a high burden of depression, anxiety, and fatigue. These impairments and symptoms are associated with reduced health-related quality of life (HRQOL). 1 HRQOL is an important patient-reported outcome measure, including in clinical trials of disease-modifying therapies (DMTs). 2 Several countries rely on measures such as quality-adjusted life years to assess cost-effectiveness of DMTs and determine if they should be publicly funded. Generic preference-based (utility) measures, such as the Health Utilities Index—Mark III (HUI3) are appropriate for this purpose, whereas health profile measures, such as the Short Form-12 (SF-12) are not. A review of generic utility measures in MS found that the HUI3 had the strongest psychometric properties. 3
Researchers studying HRQOL in MS can choose from an array of instruments with variable psychometric properties. A 2003 review of HRQOL identified 6 commonly used generic and 11 disease-specific measures applied in studies of MS populations. 1 A more recent systematic review found that 13 different HRQOL measures were used in 28 clinical trials of DMTs. 4 The use of multiple instruments limits comparisons across studies and the ability to combine data sets. The National Institutes of Neurological Disorders and Stroke (NINDS) Common Data Elements (CDEs) project has aimed to standardize data collection to address some of these issues generally. However, for MS, the NINDS CDE recommended multiple generic and disease-specific HRQOL measures,5–10 including the SF-12. Thus it is likely that studies including HRQOL as an outcome will continue to use a variety of instruments.
The SF-12 and RAND-12 11 use the same 12 questions, and each generates two aggregate scores for physical (Physical Component Score-12 (PCS-12)) and mental health (Mental Component Score-12 (MCS-12); however, they are scored differently. Like the Short Form-36 from which it is derived, the SF-12’s summary scores are based on principle component analysis with orthogonal factor rotations. In contrast, the RAND-12 uses item-response theory (IRT)-based scaling and oblique factor rotations to generate its summary scores. 12 The alternative RAND-12 scoring better assesses mental health in MS than the scoring used for the SF-12. 13 Therefore, the North American Research Committee on Multiple Sclerosis (NARCOMS) registry has used the RAND-12 to assess HRQOL for over a decade; it has been used by other investigators to study MS and other chronic diseases.13–15 Given the psychometric strengths of the HUI3, increasing interest in data harmonization, and the general lack of crosswalks between HRQOL instruments commonly used in MS, we developed a crosswalk that associates scores from the RAND-12 to corresponding scores on the HUI3 in persons with MS.
Methods
NARCOMS
The NARCOMS registry is a self-report registry for persons with MS which began enrolling participants in 1996. Since 2000, the registry has administered semi-annual surveys. Several studies have established the validity of self-reported diagnoses of MS and of the disability measures used.16–19 Participants agree to use of their de-identified information for research. The NARCOMS registry and its surveys are approved by the Institutional Review Board (IRB) at Washington University in St. Louis.
Demographic and clinical information
We obtained demographics from the enrollment survey (sex, date of birth, and education level) and the Spring 2018 Update survey (annual household income and country of residence). Participants reported their level of education as <high school, high school/GED, Associate’s Degree, Bachelor’s Degree, Post-graduate education, and Technical degree. Participants reported annual household income as <$15,000, $15,001–$30,000, $30,001–$50,000, $50,001–$100,000, >$100,000, and “I do not wish to answer.”
We obtained ages at symptom onset and diagnosis from the enrollment survey. We obtained disability status from the update survey, using Patient Determined Disease Steps (PDDS). PDDS is a single-item measure with potential responses including 0 (normal), 1 (mild disability), 2 (moderate disability), 3 (gait disability), 4 (early cane), 5 (late cane), 6 (bilateral support), 7 (wheelchair/scooter), and 8 (bedridden). PDDS scores correlate highly with those from a physician-scored Expanded Disability Status Scale. 18
HRQOL
In the Spring 2018 survey, we measured HRQOL using the RAND-12 and the HUI3. The RAND-12 is an abbreviated version of the RAND-36, a validated and widely used measure of health status developed for the Medical Outcomes Study.5,11 The RAND-12 includes 12 items, each capturing an aspect of one of the eight subscales of the RAND-36. The RAND-12 generates two aggregate scores which summarize physical HRQOL (PCS-12) and mental HRQOL (MCS-12); all items contribute to each score but differently for the PCS-12 and MCS-12. All reverse scored items are rescored so that higher values always indicate better health, then a scoring algorithm is applied to weight response items, and a sum generated. These scores range from 0 to 100 and are standardized to reflect a general population mean of 50 and standard deviation of 10; higher scores indicate better HRQOL.
The HUI3 is a 15-item, self- or interviewer-administered generic measure of health utility that assesses patient-reported health state with respect to eight attributes: vision, hearing, speech, mobility, dexterity, emotion, cognition, and pain; each has five or six levels ranging from the best to worst possible health states. 20 The HUI3 defines 972,000 health states; utility scores reflect preferences for those health states. These single-attribute scores can be aggregated into a multi-attribute utility score measure using a lookup table and mathematical formula; values range from 0 (death) to 1 (perfect health), while values below 0 (up to ‒0.36) reflect health states valued as worse than death. 20 The HUI3 has interval-level measurement properties 21 and demonstrated reliability and validity in general and disease-specific populations, including MS. 22
Analysis
As we sought to develop a crosswalk between the two instruments, the analysis was limited to participants who completed all items for the RAND-12 and HUI3. While the HUI3 produces a single multi-attribute score, the RAND-12 produces two aggregate scores. Therefore, we summed the two RAND-12 aggregate scores for the purposes of linking the two instruments. We modeled our approach on the methods of Choi et al. 23 To determine if it was reasonable to link these instruments, we reviewed item content to ensure that the two instruments were measuring the same concept. Second, we evaluated correlations between the instruments. Third, we used two approaches, IRT and equipercentile linking, to create crosswalks.
IRT models are latent trait models which assume that there is an underlying (latent) trait which is normally distributed and influences the likelihood of a particular response to discrete test items. Several assumptions are required for IRT, the most important being that the latent variable of interest is unidimensional. This also implies conditional independence, that is, responses to test items are independent, given the latent variable. We evaluated unidimensionality using confirmatory factor analysis models performed with diagonally weighted least squares (DWLS) based on a polychoric correlation matrix using version 0.6-2 of the lavaan package of R. 24 We used DWLS to account for the ordinal measurement scale of the observed items; it produces unbiased estimates of factor loadings regardless of the number of categories for the observed variables, level of distributional asymmetry and sample. 25 The unidimensionality assumption also implies conditional independence of instrument items after the latent trait is accounted for. However, when an instrument includes multiple items that assess a common “stimulus” or aspect (e.g. pain and fatigue), 26 conditional independence may not occur; this does not prevent the application of IRT. We assessed fit of the confirmatory factor analysis models using root mean square error of approximation (RMSEA) and comparative fit index (CFI). Values for RMSEA range from 0 to 1, with smaller values indicating better fit; values of ⩽0.06 indicate adequate fit. 27 Values for CFI range from 0 to 1, and larger values indicate better fit; values of ⩾0.90 indicate acceptable fit. 27 We also conducted simple exploratory factor analysis and inspected the scree plot, expecting that the first eigenvector should capture most of the variance if the instrument is unidimensional.
Since all items for both scales are ordinal, we fit the IRT models using the graded response model (i.e. ordinal logistic regression), where the independent variable was the latent score and the dependent variable was the item of interest. The probability of a given response is a function of item characteristics and the unobserved value of the latent trait. Under the assumption of conditional independence, latent trait values can then be estimated for each unique observed scale response pattern. Thus, for each scale, we predicted the participants’ scale scores using a non-linear model (with a cubic spline) with the estimated latent trait as the independent variable. This means that a given latent trait value will have two predictions associated with it, one for each scale, and these are linked to create a crosswalk. 26 This process is known as true-score equating. 28 IRT models were estimated using version 1.1-1 of the ltm package in R. 29
Equipercentile linking is a non-parametric approach which involves the calculation of scores for each instrument and then obtaining the score’s percentile rank in the study sample. Scores with equivalent percentile ranks for each instrument are then associated. The distribution of scores for each instrument was smoothed with log-linear models before equating, which reduces sampling errors. Analyses were performed using version 2.0.7 of the equate package of R. 30
We assessed the performance of both approaches by comparing predicted scores from each crosswalk for the HUI3 to actual (observed) HUI3 scores using (1) Pearson correlations between the predicted and actual scores; (2) concordance using intraclass correlation coefficients (ICCs) between the predicted and actual scores; (3) assessing bias using Bland–Altman plots. Finally, for the equipercentile linking (the superior approach as delineated in the results), we assessed bootstrap standard errors, that is, the standard deviation of the predicted value of the HUI3 over repeated random samples. This provided an estimate of the sampling variability of the predictions.
Complementary analysis
We applied equipercentile linking, our preferred method, to create crosswalks for the PCS-12 and MCS-12 scores and the HUI3.
Results
Participants
Of 11,389 invited participants, 7129 (62.6%) responded. As compared to non-responders, responders were more likely to be White (p < 0.0001), had a higher level of education (p < 0.0001), and were on average 1 year older at diagnosis (p < 0.0001). Of those who responded, 6348 answered all of the questions for the SF-12 and for the HUI3 and were included in the analysis. Most responders were women, White, and had more than a high school education with a spectrum of disability (Table 1).
Clinical and demographic characteristics of study participants (n = 6348).
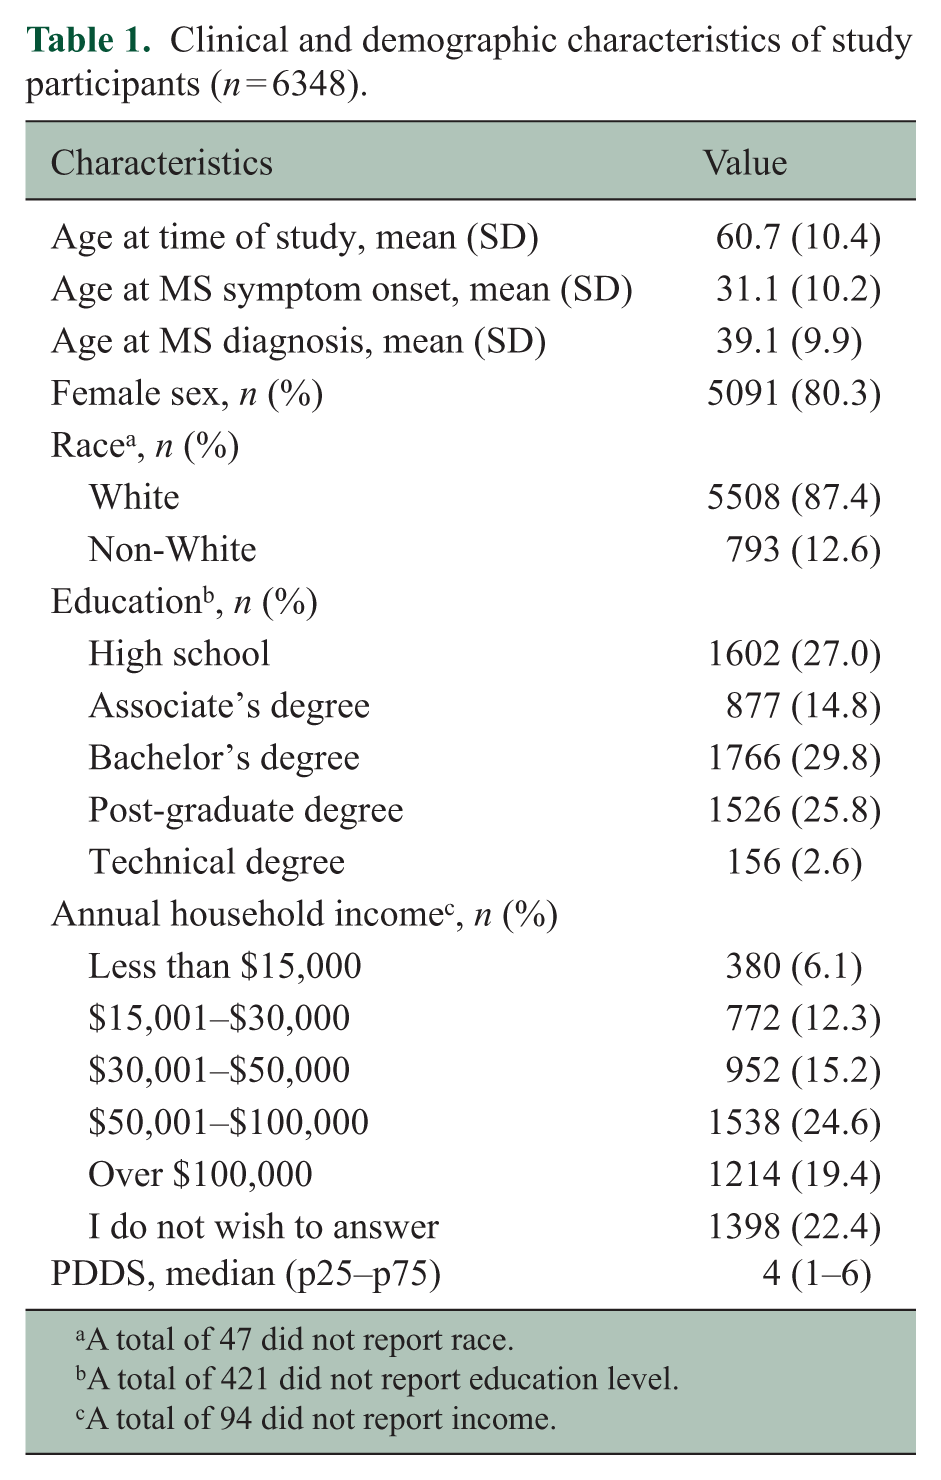
A total of 47 did not report race.
A total of 421 did not report education level.
A total of 94 did not report income.
Item content overlap and correlations between instruments
With respect to item content overlap, both the HUI3 and RAND-12 have items that assess mood, pain, and activity limitations. The RAND-12 captures fatigue, which the HUI3 does not. The HUI3 explicitly captures specific domains of physical or cognitive impairment (vision, hearing, speaking, mobility, upper limb, and cognition), while the RAND-12 focuses on the impact of physical limitations rather than the specific domain which is impaired.
Histograms for the HUI3 and RAND-12 showed some skewness but were approximately normal. The mean (SD) score on the HUI3 was 0.44 (0.33), on the PCS-12 was 37.5 (11.6) and on the MCS-12 was 46.6 (11.3). The HUI3 was moderately correlated with the PCS-12 (r = 0.66; 95% confidence interval (CI): 0.65, 0.67), but the correlation with the MCS-12 was weaker (r = 0.46; 95% CI: 0.44, 0.48). Internal consistency, as measured by Cronbach’s alpha, was acceptable for both instruments (Table 2). On the HUI3, 62 (0.98%) of participants scored the maximum value of 1, and no participants scored the minimum value. On the PCS-12, no participants scored the maximum or minimum possible values; notably the highest score was 65.9. On the MCS-12, no participants scored the minimum or maximum possible values; the highest score was 74.8.
Internal consistency reliability of the health-related quality of life instruments.
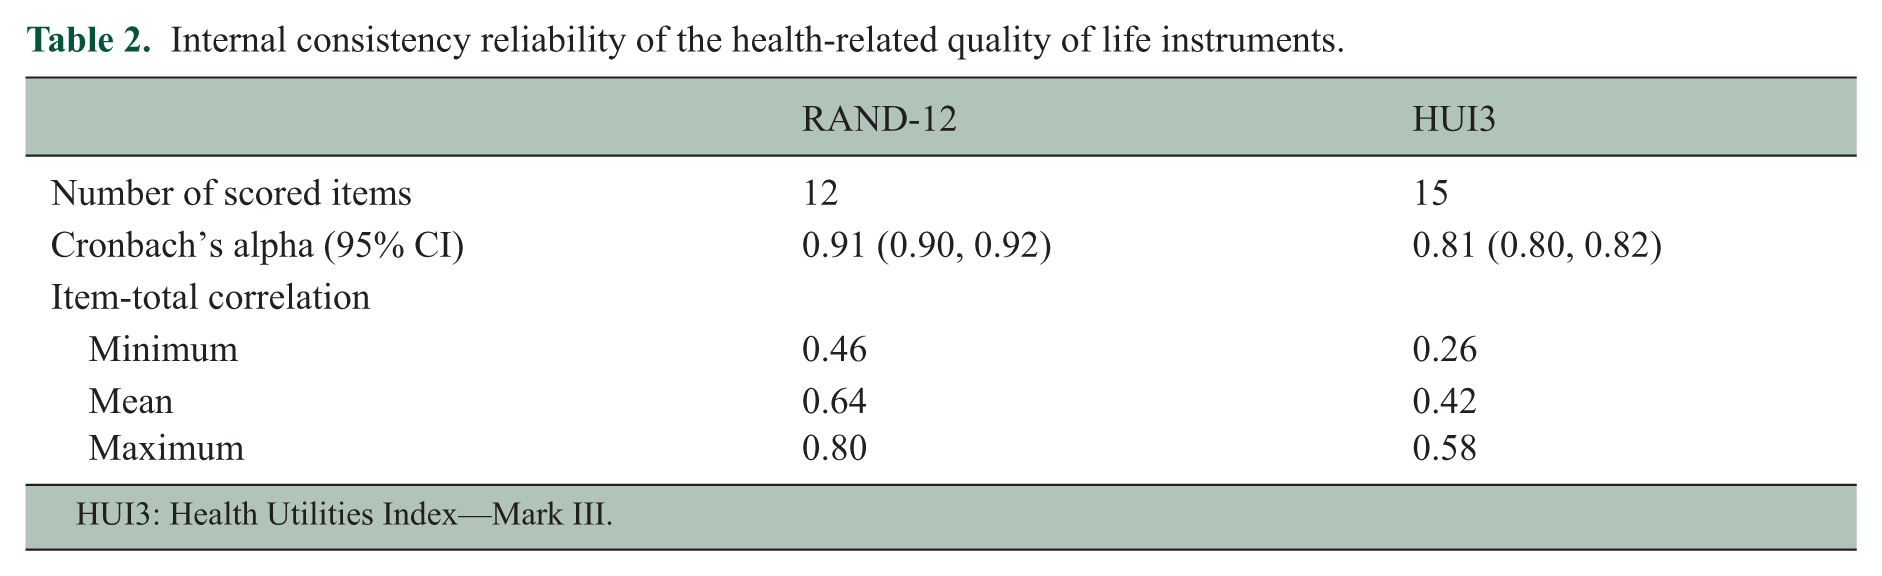
HUI3: Health Utilities Index—Mark III.
Assessment of unidimensionality
When we examined unidimensionality for the HUI3 using confirmatory factor analysis, the model fit poorly as measured by the RMSEA (0.136) and CFI (0.892). This appeared to be due to conditional dependence between some items, including items 3 and 4, which assess hearing, items 5 and 6, which assess speech, items 9 and 10, which assess upper and lower limb physical impairments, and items 11 and 12, which assess cognition. Accounting for these reasonable dependencies by including the correlations between those items in the model improved fit to acceptable levels (RMSEA = 0.044, CFI = 0.99).
When we examined unidimensionality for the RAND-12 using confirmatory factor analysis, the model fit poorly as measured by the RMSEA (0.215) as well as measured by the CFI (0.971). This appeared to be due to conditional dependence between some items, including two items which assess the impact of emotional problems, two items which assess mood and four items which assess the impact of physical or emotional problems on function. However, accounting for these reasonable dependencies by including the correlations between those items in the model did not improve model fit to acceptable levels (RMSEA = 0.13, CFI = 0.99). This prompted the use of a restricted bifactor model, in which a general underlying latent construct is retained, along with several smaller latent subfactors. 31 All items load onto the general factor and also onto only one of the subfactors (in our case were the PCS-12 and MCS-12 scales). This model fit well (RMSEA = 0.064, CFI = 0.998) with the general factor explaining 69% of the common variance. These fit statistics indicated that there is a strong underlying general factor, and thus the RAND-12 was sufficiently unidimensional to move forward with the linking of the RAND-12 and the HUI3.
IRT-based linking
Supplemental Table e1 shows the crosswalk produced by linking the RAND-12 and HUI3 using the IRT-based approach. The predicted and observed values from the IRT-based approach were moderately correlated (Pearson r = 0.76) with moderate concordance (ICC = 0.72). The Bland–Altman plots showed an asymmetric distribution suggesting biased prediction, which was not constant across the range of HUI3 values (Figure 1).
Bland–Altman plot of observed versus predicted values of the Health Utilities Index—Mark III (HUI3) using IRT linking.
Equipercentile linking
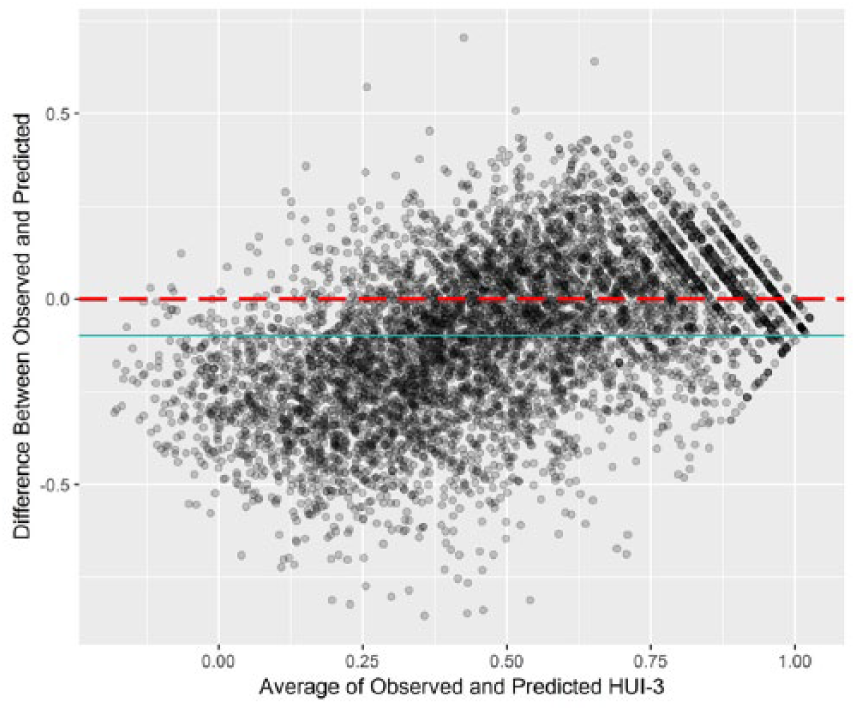
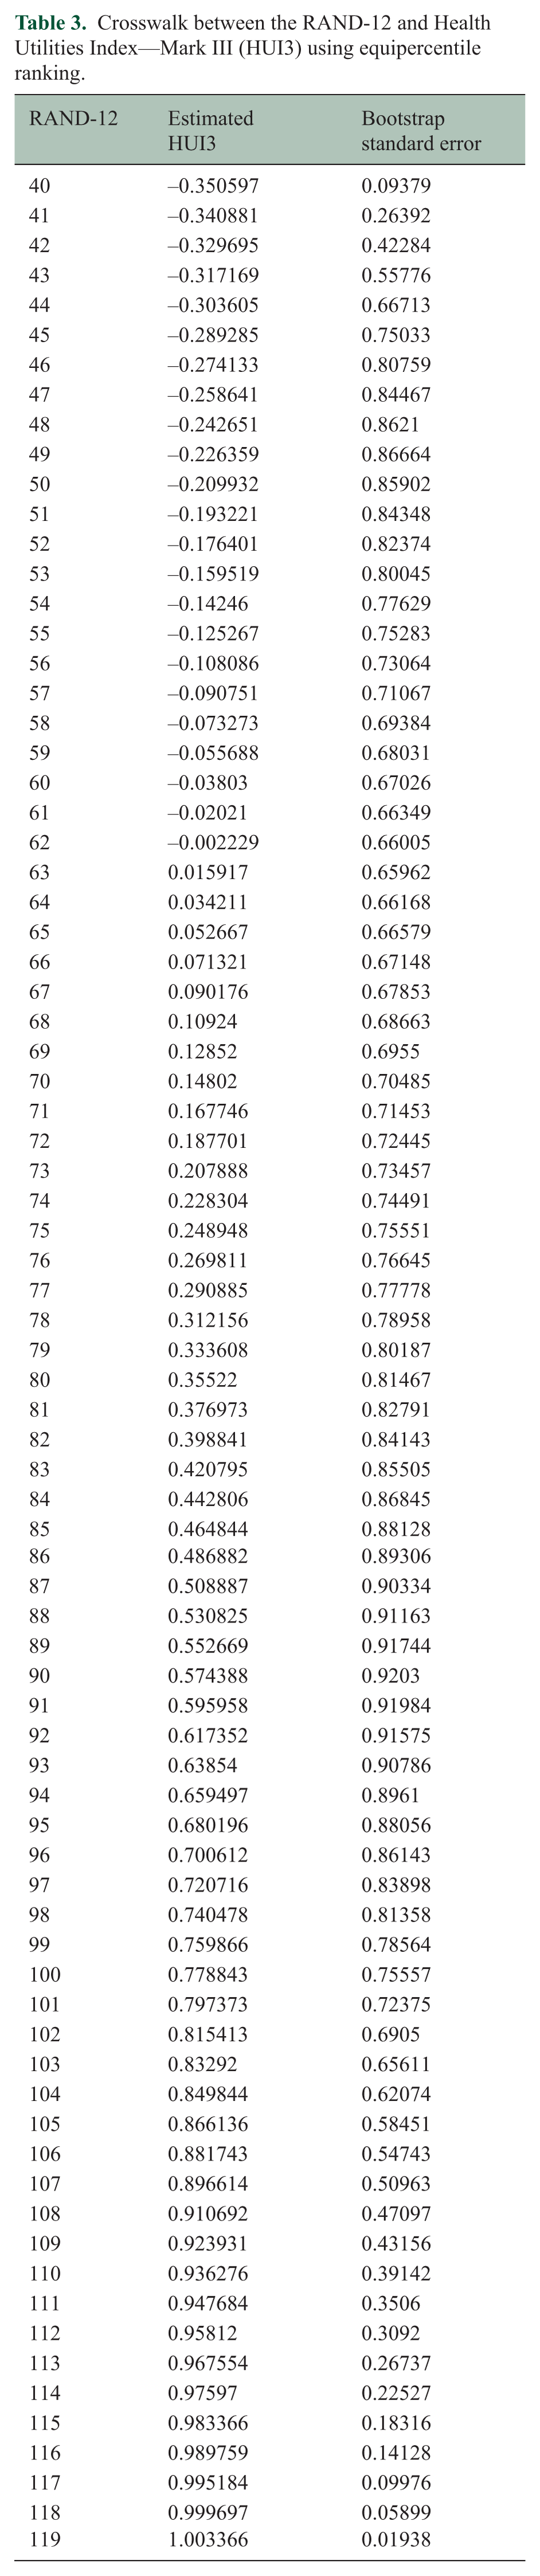
Table 3 shows the crosswalk produced by linking the RAND-12 and HUI3 using equipercentile linking. The predicted and observed values from the equipercentile method were moderately correlated (Pearson r = 0.78, ICC = 0.78). The Bland–Altman plots showed a reasonably symmetric distribution suggesting no bias. However, some residuals remain large, indicating poor prediction for some scores (Figure 2). The bootstrap standard errors were lower at the extremes of the RAND-12 scale, suggesting some variation in the predictive accuracy of the crosswalk (Table 3).
Crosswalk between the RAND-12 and Health Utilities Index—Mark III (HUI3) using equipercentile ranking.
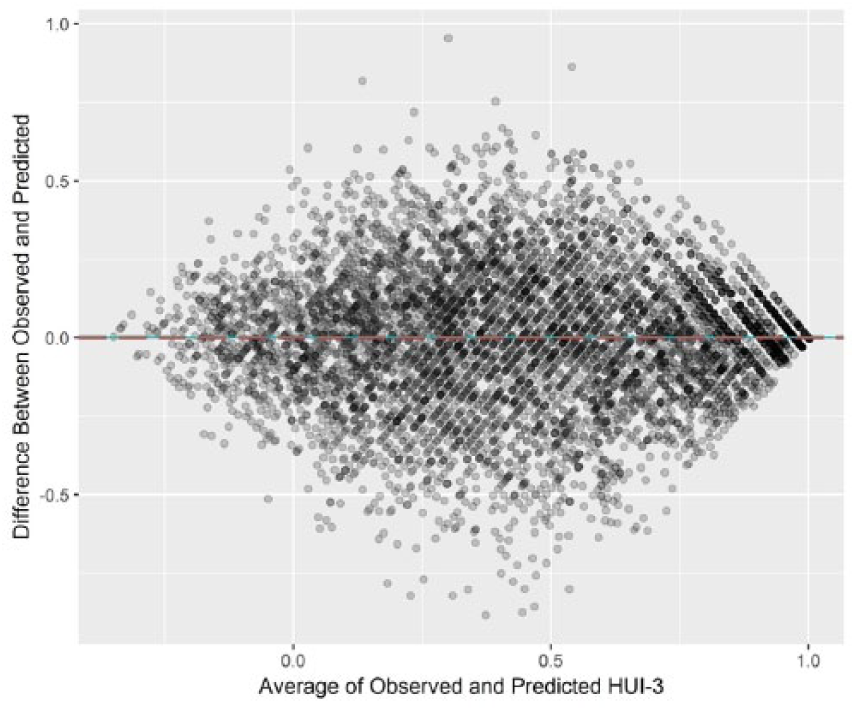
Bland–Altman plot of observed versus predicted values of the Health Utilities Index—Mark III (HUI3) using equipercentile linking.
Complementary analysis
Supplemental Table e2 shows the crosswalks produced by linking the MCS-12 and HUI3, and for the PCS-12 and HUI3 using equipercentile linking. The crosswalks produced were not as accurate as the crosswalk based on the combined MCS-12 and PCS-12 scores. When we compared predicted and observed values for the MCS-12 crosswalk, we found that they were moderately correlated (Pearson r = 0.46, ICC = 0.46). The Bland–Altman plot showed a reasonably symmetric distribution suggesting no bias (data not shown), but some of the residuals were large. When we compared predicted and observed values for the PCS-12 crosswalk, we found that they were more strongly correlated (Pearson r = 0.66, ICC = 0.66 (0.65, 0.67)) than for the MCS-12. The Bland–Altman plot showed a reasonably symmetric distribution suggesting no bias (data not shown), but some of the residuals were large.
Discussion
Interest in data harmonization is increasing, as investigators seek opportunities to pool data to replicate findings, increase statistical power and address novel questions. 32 Although data harmonization can be done prospectively, that is, before data are collected, retrospective harmonization is more common. In this situation, comparability of measures collected across different studies must be achieved after data collection. Retrospective harmonization can be particularly challenging when different instruments have been used to measure the same underlying construct because of differences in their measurement properties. We used two different methods to link the RAND-12 to the HUI3 and found that the equipercentile method performed better than IRT linking. We also found that combining the two summary scores of the RAND-12 (MCS-12, PCS-12) produced a more accurate crosswalk with the HUI3 than the crosswalks produced for each of the two component summary scores. The “combined” crosswalk should facilitate future studies that seek to pool data from studies using these two HRQOL measures. Multiple validated instruments exist to assess other key constructs in MS such as depression, and similar approaches could be employed to facilitate harmonization of those instruments.
Previous studies have mapped the SF-12 rather than the RAND-12 to the HUI3 using regression-based methods; both studies had potential limitations with respect to their application in MS. Neither employed an MS population, and the relationship of the RAND-12 and HUI3 may differ in the MS population versus the general population. In 240 individuals attending a community health center in New York, the two component scores of the SF-12 explained about 50% of the variance in the HUI3, and the authors reported a conversion function to generate HUI3 scores given PCS-12 and MCS-12 scores. 33 In 8000 persons aged 20–84 years, the general health question of the SF-12 was mapped to the HUI3, adjusting for age and gender. The relationship between the response categories for the general health question and the HUI3 was non-linear. 34 The information from the other SF-12 questions was not incorporated into the crosswalk, potentially making the crosswalk less robust. Thus a consistent conversion equation from the complete SF-12 and HUI3 is lacking.
Strengths of this study included the use of a single-group design. 35 This allowed us to directly assess the accuracy of the crosswalk by comparing actual and predicted scores. In addition, we developed crosswalks using two different approaches. Our sample was also large, with a range of income, education, and disability levels. Limitations of the study should also be recognized. The linking of the two scales was determined by our sample, which was not population-based, and which did not report the full range of values on either scale, although this was a bigger concern with the RAND-12. Moreover, the standard errors varied across the scale’s range indicating variable predictive accuracy. Given the variability of the standard errors and that we did not perform split half-validation of our findings, overfitting is possible; it would be valuable to test the performance of our preferred crosswalk in another sample of people with MS.
We developed a crosswalk between two HRQOL measures, the RAND-12 and the HUI3, in the MS population. This crosswalk will facilitate future data harmonization efforts.
Supplemental Material
MSJ852722_supplemental_material – Supplemental material for Developing a crosswalk between the RAND-12 and the health utilities index for multiple sclerosis
Supplemental material, MSJ852722_supplemental_material for Developing a crosswalk between the RAND-12 and the health utilities index for multiple sclerosis by Ruth Ann Marrie, Brenden Dufault, Tuula Tyry, Gary R Cutter, Robert J Fox and Amber Salter in Multiple Sclerosis Journal
Footnotes
Acknowledgements
NARCOMS is a project of the Consortium of Multiple Sclerosis Centers (CMSC).
Declaration of Conflicting Interests
The author(s) declared the following potential conflicts of interest with respect to the research, authorship, and/or publication of this article: R.F. receives consultant fees from Actelion, Biogen, Genentech, Novartis, and Teva. He has served on advisory committees for Biogen and Novartis. He also receives research support from Biogen (clinical trial contracts) and Novartis (research study support). G.R.C. serves on Data and Safety Monitoring Boards for AMO Pharmaceuticals, Apotek, Gilead Pharmaceuticals, Horizon Pharmaceuticals, Modigenetech/Prolor, Merck, Merck/Pfizer, Opko Biologics, Neurim, Sanofi-Aventis, Reata Pharmaceuticals, Receptos/Celgene, Teva pharmaceuticals, NHLBI (Protocol Review Committee), NICHD (OPRU oversight committee). He also serves on consulting or advisory boards for Atara Biotherapeutics, Bioeq GmBH, Cerespir Inc, Consortium of MS Centers (grant), Genzyme, Genentech, Innate Therapeutics, Jannsen Pharmaceuticals, Klein-Buendel Incorporated, Medimmune, Medday, Nivalis, Novartis, Opexa Therapeutics, Roche, Savara Inc., Somahlution, Teva pharmaceuticals, Transparency Life Sciences, and TG Therapeutics. R.A.M. receives research funding from CIHR, the National MS Society, the MS Society of Canada, the MS Scientific Research Foundation, Research Manitoba, the Consortium of MS Centers, Crohn’s and Colitis Canada and the Waugh Family Chair in Multiple Sclerosis. The remaining authors have nothing to disclose.
Funding
The author(s) declared receipt of the following financial support for the research, authorship, and/or publication of this article: NARCOMS is funded in part by the CMSC and the Foundation of the CMSC. The study was also supported in part by the Waugh Family Chair in Multiple Sclerosis (to RAM). The funding source(s) had no role in the study design, collection, analysis or interpretation of the data, nor in the decision to submit the article for publication.
Supplemental material
Supplemental material for this article is available online.
References
Supplementary Material
Please find the following supplemental material available below.
For Open Access articles published under a Creative Commons License, all supplemental material carries the same license as the article it is associated with.
For non-Open Access articles published, all supplemental material carries a non-exclusive license, and permission requests for re-use of supplemental material or any part of supplemental material shall be sent directly to the copyright owner as specified in the copyright notice associated with the article.