
Abstract
Background:
The biological mechanism of depression in multiple sclerosis (MS) is not well understood. Based on work in major depressive disorder, fronto-limbic disconnection might be important.
Objective:
To investigate structural and functional fronto-limbic changes in depressed MS (DMS) and non-depressed MS (nDMS) patients.
Methods:
In this retrospective study, 22 moderate-to-severe DMS patients (disease duration 8.2 ± 7.7 years), 21 nDMS patients (disease duration 15.3 ± 8.3 years), and 12 healthy controls underwent neuropsychological testing and magnetic resonance imaging (MRI; 1.5 T). Brain volumes (white matter (WM), gray matter, amygdala, hippocampus, thalamus), lesion load, fractional anisotropy (FA) of fronto-limbic tracts, and resting-state functional connectivity (FC) between limbic and frontal areas were measured and compared between groups. Regression analysis was performed to relate MRI measures to the severity of depression.
Results:
Compared to nDMS patients, DMS patients (shorter disease duration) had lower WM volume (p < 0.01), decreased FA of the uncinate fasciculus (p < 0.05), and lower FC between the amygdala and frontal regions (p < 0.05). Disease duration, FA of the uncinate fasciculus, and FC of the amygdala could explain 48% of variance in the severity of depression. No differences in cognition were found.
Conclusion:
DMS patients showed more pronounced (MS) damage, that is, structural and functional changes in temporo-frontal regions, compared to nDMS patients, suggestive of fronto-limbic disconnection.
Keywords
Introduction
Depression is present in 30% of patients with multiple sclerosis (MS) 1 and thereby more common than in other chronic diseases among young adults (e.g. rheumatoid arthritis). 2 The clinical manifestation of depression in MS is very similar to that of patients with major depressive disorder (MDD) without MS. 3 The etiology of depression in MS is still poorly understood, but it could be hypothesized that specific MS pathology triggers the onset of depressive symptoms. In MDD, brain abnormalities such as limbic and frontal atrophy,4,5 decreased fractional anisotropy (FA) of fronto-limbic tracts,6–8 and decreased functional connectivity (FC) between limbic and frontal regions9–11 have been found, suggestive of fronto-limbic disconnection. 11
In MS, studies have shown that, compared to non-depressed MS (nDMS) patients, depressed MS (DMS) patients show more severe atrophy of frontal regions12,13 and frontal white matter (WM) damage (atrophy and decreased FA).14,15 Furthermore, higher scores on depression questionnaires have been related to decreased FC between the hippocampus and amygdala with frontal regions during emotional processing 16 and between the hippocampus with default mode network at rest. 17
However, multimodal imaging studies investigating the fronto-limbic system and depression in MS are lacking. To better understand the etiology of depression in MS, combining these structural and functional measures within individual patients is essential, as is the inclusion of MS patients with profound depressive symptoms. Hence, we investigated structural and functional differences in the fronto-limbic system in DMS and nDMS patients and healthy controls (HCs). We hypothesize that DMS patients will show more severe structural and functional fronto-limbic disconnection compared to nDMS patients and HCs.
Methods
Participants
Participants were selected and matched for age, sex, and educational level from two different study cohorts. Both cohorts followed identical protocols for neuropsychology and magnetic resonance imaging (MRI). Cohort 1 consisted of DMS patients of a randomized controlled trial investigating the effect of cognitive behavioral therapy for depression. 18 Inclusion criteria were as follows: (1) aged ⩾18 years, (2) scoring ⩾20 on the Beck Depression Inventory, Second Edition (BDI-II) indicating moderate-to-severe depression, 19 (3) MS diagnosis (>3 months) confirmed by a neurologist, and (4) no contra-indications for MRI. Exclusion criteria were as follows: (1) elevated suicide risk, (2) psychotherapy, and (3) using antidepressants for <6 weeks. Note that these patients had not yet started with the cognitive behavioral therapy. Hence, no effects of this intervention are measured in this study. Cohort 2 consisted of MS patients and HCs that were prospectively recruited for a longitudinal study (data not published yet) but retrospectively added to the DMS sample to answer our post hoc research question. The inclusion criteria for this study were as follows: (1) aged 18–65 years, (2) no presence or history of neurological or psychiatric diseases (for patients other than MS), (3) scoring <8 on the Hospital Anxiety and Depression Scale—Depression (HADS-D), 20 indicative of absence of depression, (4) MS diagnosis according to the revised McDonald criteria, and (5) no contra-indications for MRI. Both study protocols were approved by the local ethical committee and conducted in accordance with the ethical standards laid down in the Declaration of Helsinki. All participants gave written informed consent prior to participation.
Clinical measures
The HADS—Anxiety (HADS-A) questionnaire was used to assess the level of anxiety. 20 All DMS patients underwent the Composite International Diagnostic Interview to diagnose a depressive disorder. 21 Neuropsychological testing was performed in all subjects, covering the following domains: verbal memory, visuospatial memory, information processing speed, short-term and working memory, and verbal fluency (see Supplementary Methods for all tests). For each test, the raw score was converted into a Z score relative to HCs.
Physical disability was assessed using the telephone version of the Expanded Disability Status Scale (EDSS), consisting of 10 questions that can be used to estimate the EDSS score. 22 We excluded the subjective rating of the severity of MS-related symptoms from the questionnaire, in order to keep the estimated EDSS score as objective as possible. As a result, the EDSS score was categorized in the following bins: 0–1.5 (no restrictions by MS in daily life), 2–4 (some restrictions by MS in daily life), 4.5–6, and ⩾6.5.
MRI acquisition
All participants were scanned on a 1.5-T whole-body MRI system (Siemens Avanto, Erlangen, Germany) using a 12-channel phased array head coil. The protocol included a three-dimensional T1-weighted magnetization prepared rapid acquisition gradient-echo sequence for brain volume measurements and an axial turbo spin-echo proton density (PD)/T2-weighted sequence for WM lesion detection. Diffusion-weighted echo-planar images were obtained with 60 volumes with noncollinear diffusion gradients (b value: 700 s/mm2) and 10 volumes without directional weighting. For FC analysis, resting-state (RS) functional magnetic resonance imaging (fMRI) was performed (200 volumes of echo-planar images; see Supplementary Methods for acquisition parameters).
The fronto-limbic system
The fronto-limbic system was defined based on previous studies.5–8 The amygdala, hippocampus, and thalamus were defined as key limbic subcortical gray matter (GM) structures. 5 Fronto-limbic WM connections included the bilateral anterior thalamic radiation, cingulum, superior longitudinal fasciculus, and uncinate fasciculus.6–8 The corticospinal tract was selected as a control tract. Functional fronto-limbic connections included the FC between key limbic structures and frontal regions, namely, the anterior cingulate cortex, medial prefrontal cortex (PFC), dorsolateral PFC, and ventral PFC. 5
Volumetric measures
All MRI-processing steps were performed in FSL5.0 (FMRIB’s Software Library, http://www.fmrib.ox.ac.uk/fsl). Lesion segmentation was applied using the PD/T2-weighted scans and subsequently filled as previously described.23,24 Next, GM and WM volumes were obtained using SIENAx. 25 Volumes of key limbic regions were obtained using FIRST. 26 All volumetric measurements were normalized for head size.
Fronto-limbic damage: WM integrity and lesion load
Processing of diffusion tensor imaging (DTI) data included motion and eddy current correction, after which a diffusion tensor was fitted for each voxel using FMRIB’s Diffusion Toolbox. From the tensor, FA and mean diffusivity (MD) images were obtained. For atlas registration purposes, all participants’ FA images were non-linearly registered to the FMRIB58_FA using the standard tract-based spatial statistics pipeline. Next, the JHU white matter tractography atlas 27 in standard space was thresholded, so that voxels with a probability ≤15% were excluded to measure tracts with more spatial accuracy. Each tract was then non-linearly registered to the native space FA and MD images. SIENAx’s WM mask and the FIRST segmentation were used to only select WM voxels for each tract. Subsequently, average FA and MD values for each tract were obtained. For each patient, the lesion mask was linearly registered to native DTI space, and for each WM tract, the number of lesioned voxels was calculated (expressed as a percentage of the total tract size).
RS FC analysis
For a detailed description of the FC pipeline, see Supplementary Methods. In short, the subject’s fMRI data were preprocessed in Melodic. The Automated Anatomical Labeling (AAL) atlas 28 was registered to each subject’s fMRI scan and complemented with the subcortical areas segmented by FIRST. For each region (92 in total), the average time series was obtained and imported into MATLAB R2012a. Pearson correlation coefficients were used to correlate activity between all regions and subsequently normalized for each participant’s average correlation strength and standard deviation of the entire correlation matrix. Finally, average FC between each limbic region with all frontal areas was calculated (see Figure 1).
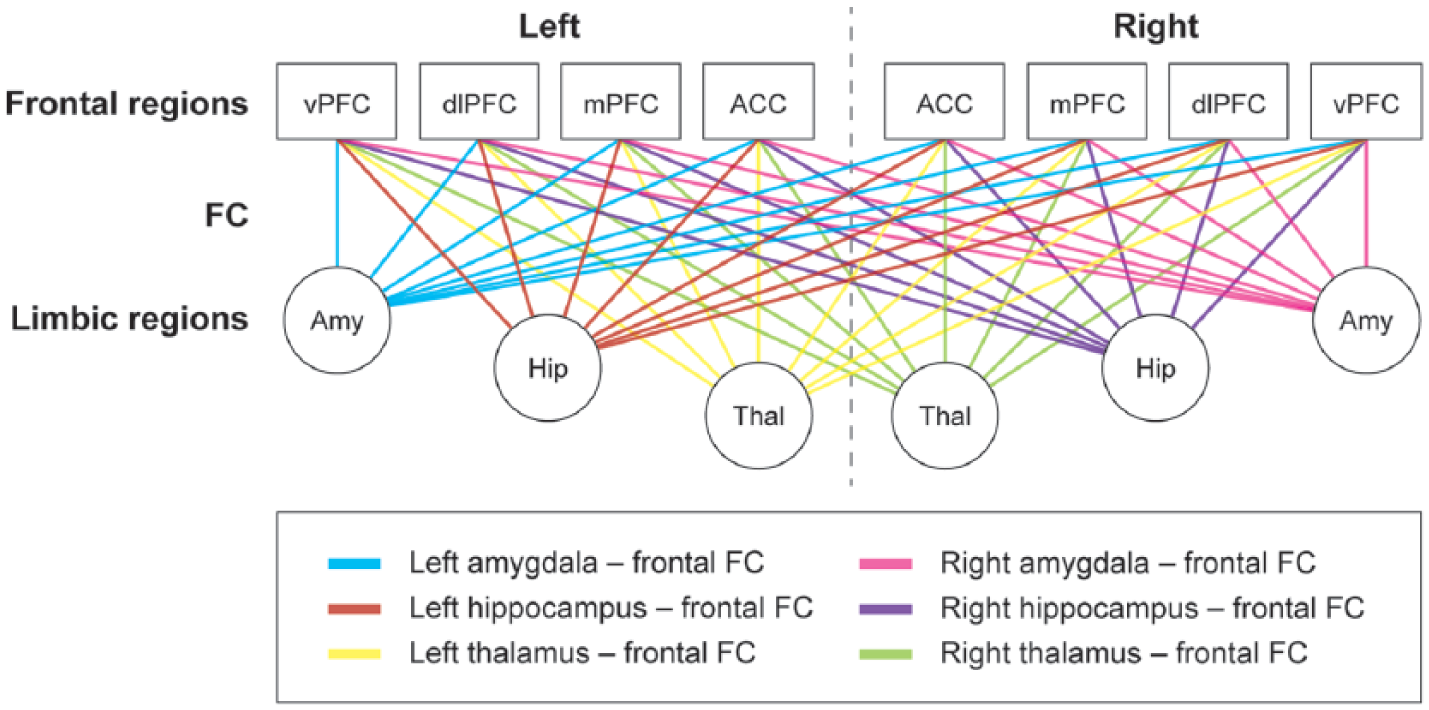
Schematic overview of functional connectivity between limbic and frontal regions.
Relationship between depression and MRI
To combine data from the two cohorts (HADS-D and BDI-II), we calculated a depression rank score. Subjects were assigned a rank score starting from 1 (subject with lowest depression score) with incremental steps of 1 toward the subject with the highest depression score. Subjects with identical depression scores were assigned similar rank scores (maximum score: 24).
Statistical analyses
The statistical analyses were performed in SPSS 20 (Chicago, IL, USA). Normality of data was assessed with visual inspection of histograms. Demographic data were analyzed using univariate analysis of variance (for normally distributed data) or a Mann–Whitney U test (two groups) or Kruskal–Wallis test (three groups) for not normally distributed data. The main analysis consisted of group comparisons in cognitive performance and imaging measures, analyzed using linear regression with two dummy variables to contrast all three groups, corrected for age and sex. In addition, a direct comparison was made between DMS and nDMS patients with correction for disease duration instead of age to better control for disease-specific changes. Hierarchical regression analysis was performed to investigate the added value of FC on top of structural MRI (including all MRI measures in the model that showed group differences between DMS and nDMS patients in the main analysis) to predict the depression rank score (covariate: disease duration). Benjamini–Hochberg false discovery rate (FDR)-corrected p values for each family of multiple test statistics are reported in the tables and main text, and a corrected p value of 0.05 was considered statistically significant.
Post hoc analysis: impact of MDD diagnosis
In order to be increasingly sensitive to detect differences between DMS and nDMS patients, all analyses were repeated in a subsample consisting of DMS patients with a current (i.e. past 6 months) MDD diagnosis (MSDMDD) and nDMS patients with an HADS-D score (⩽4) that did not exceed those of HCs (nDMSlowHADS). These analyses were corrected for disease duration and sex.
Results
Demographics and clinical measures
For information on demographic data for DMS patients (n = 22), nDMS patients (n = 21), and HCs (n = 12), see Table 1. In total, 18 DMS patients had a lifetime MDD diagnosis, and in 9 of these patients, the onset was 14.6 ± 10.9 years before MS diagnosis. In addition, 14 DMS patients had a current MDD diagnosis. No significant group differences were found for age (p = 0.06) and sex (p = 0.72). Disease duration in nDMS patients was shorter (8.2 ± 7.7 years) than in DMS patients (15.3 ± 8.3 years; p < 0.01), while physical disability (EDSS) was similar (p = 0.16). Performance on verbal memory was lower in both patient groups compared to HCs (p < 0.01). In addition, DMS patients performed worse on information processing speed and working memory compared to HCs (p = 0.01 and p = 0.05, respectively; see Supplementary Table 1).
Demographics and clinical data of depressed and non-depressed patients with MS and healthy controls.
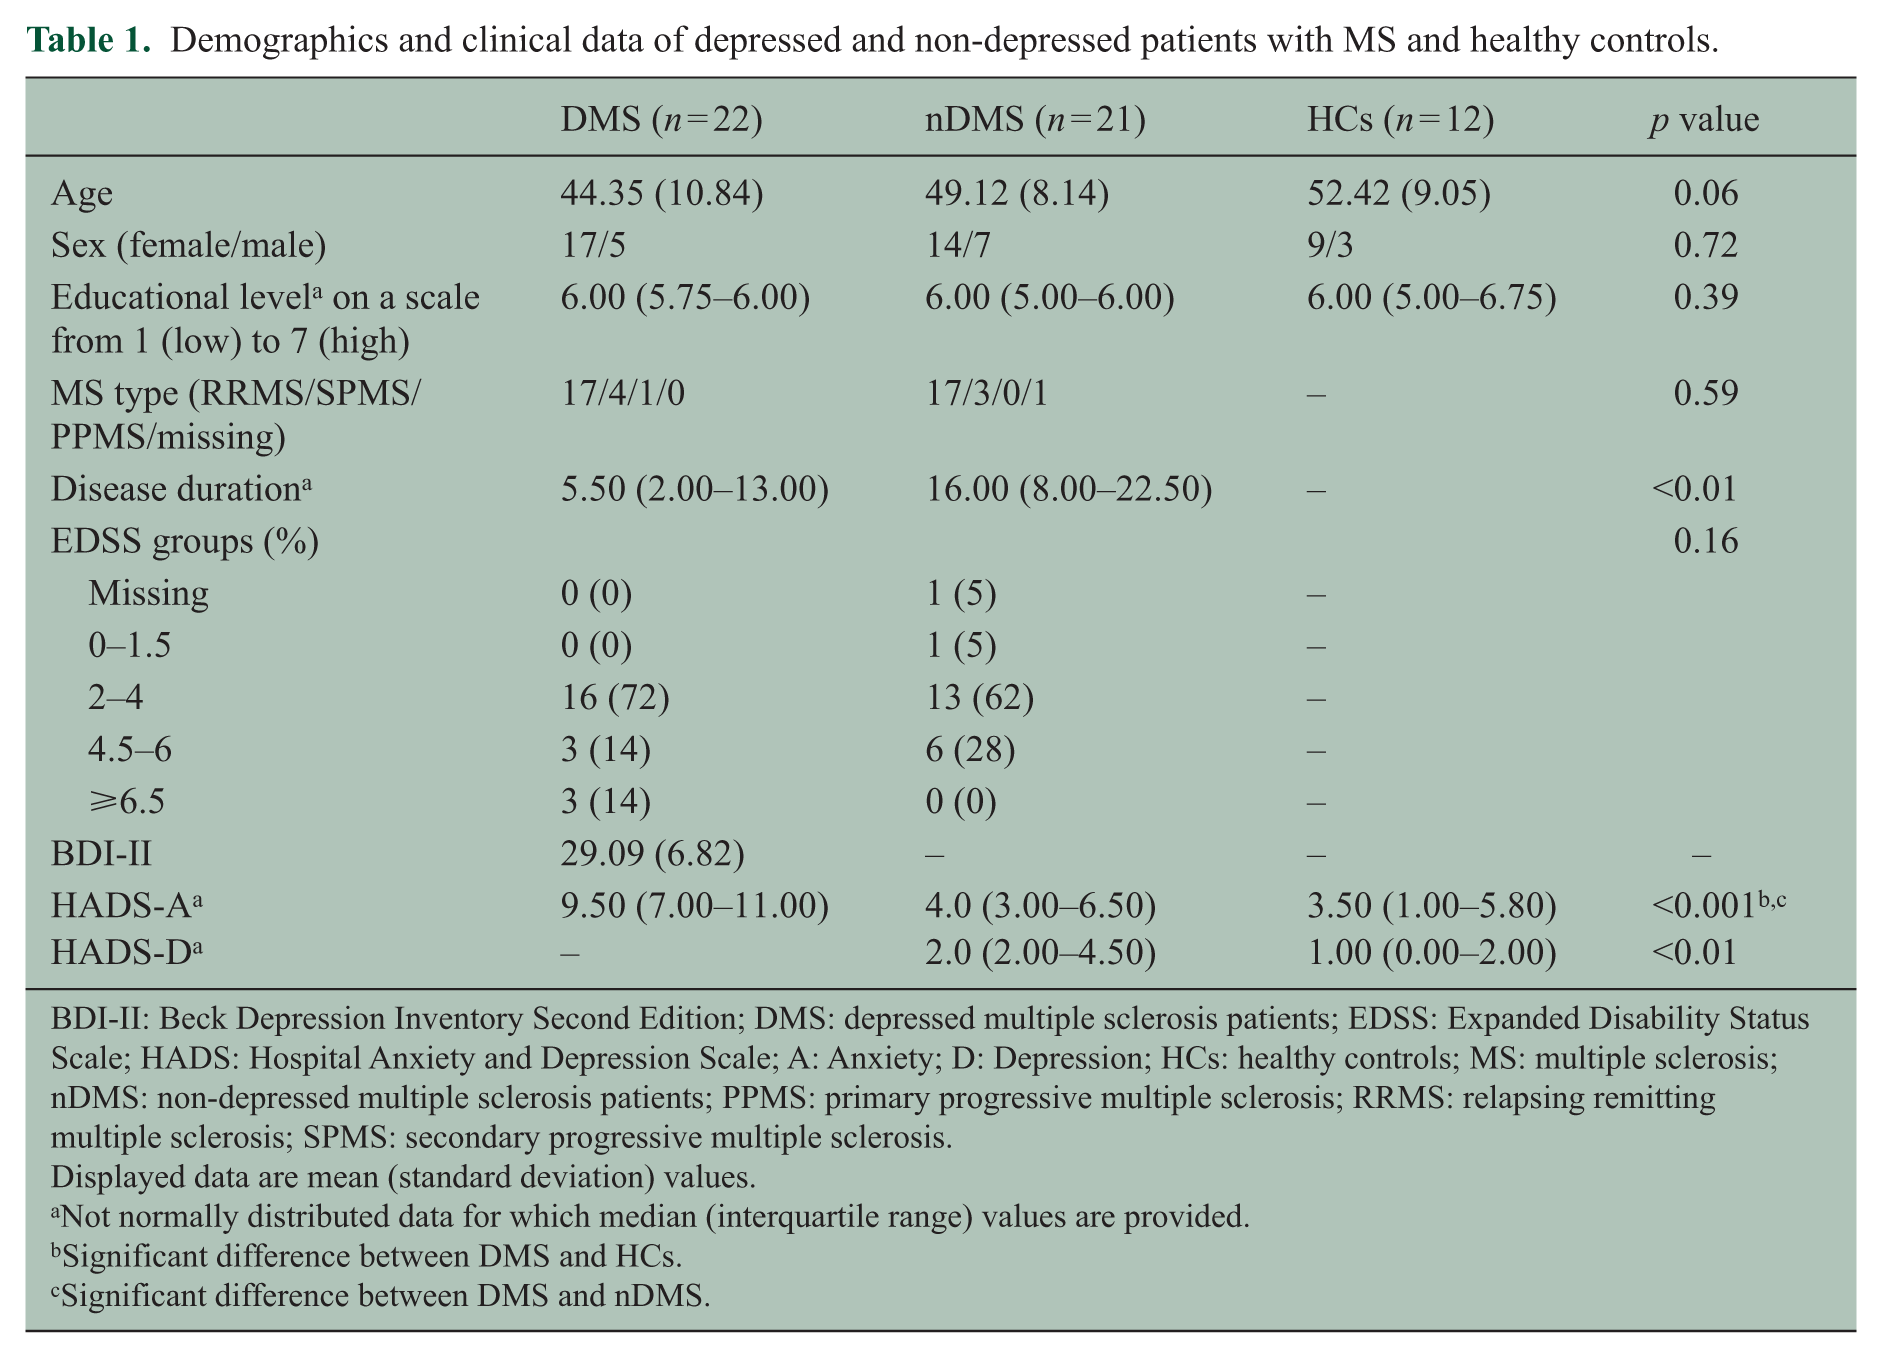
BDI-II: Beck Depression Inventory Second Edition; DMS: depressed multiple sclerosis patients; EDSS: Expanded Disability Status Scale; HADS: Hospital Anxiety and Depression Scale; A: Anxiety; D: Depression; HCs: healthy controls; MS: multiple sclerosis; nDMS: non-depressed multiple sclerosis patients; PPMS: primary progressive multiple sclerosis; RRMS: relapsing remitting multiple sclerosis; SPMS: secondary progressive multiple sclerosis.
Displayed data are mean (standard deviation) values.
Not normally distributed data for which median (interquartile range) values are provided.
Significant difference between DMS and HCs.
Significant difference between DMS and nDMS.
MRI variables
Brain volumes
Compared to HCs, lower GM, WM, and limbic volume were observed in both patient groups (Table 2), except for volume of the WM and left amygdala which did not significantly differ between nDMS and HCs (p = 0.06 and p = 0.08, respectively). In DMS compared to nDMS patients, WM volume was lower (p < 0.01), whereas lesion load and GM volume were similar.
Structural MRI data from depressed and non-depressed patients with MS and healthy controls.
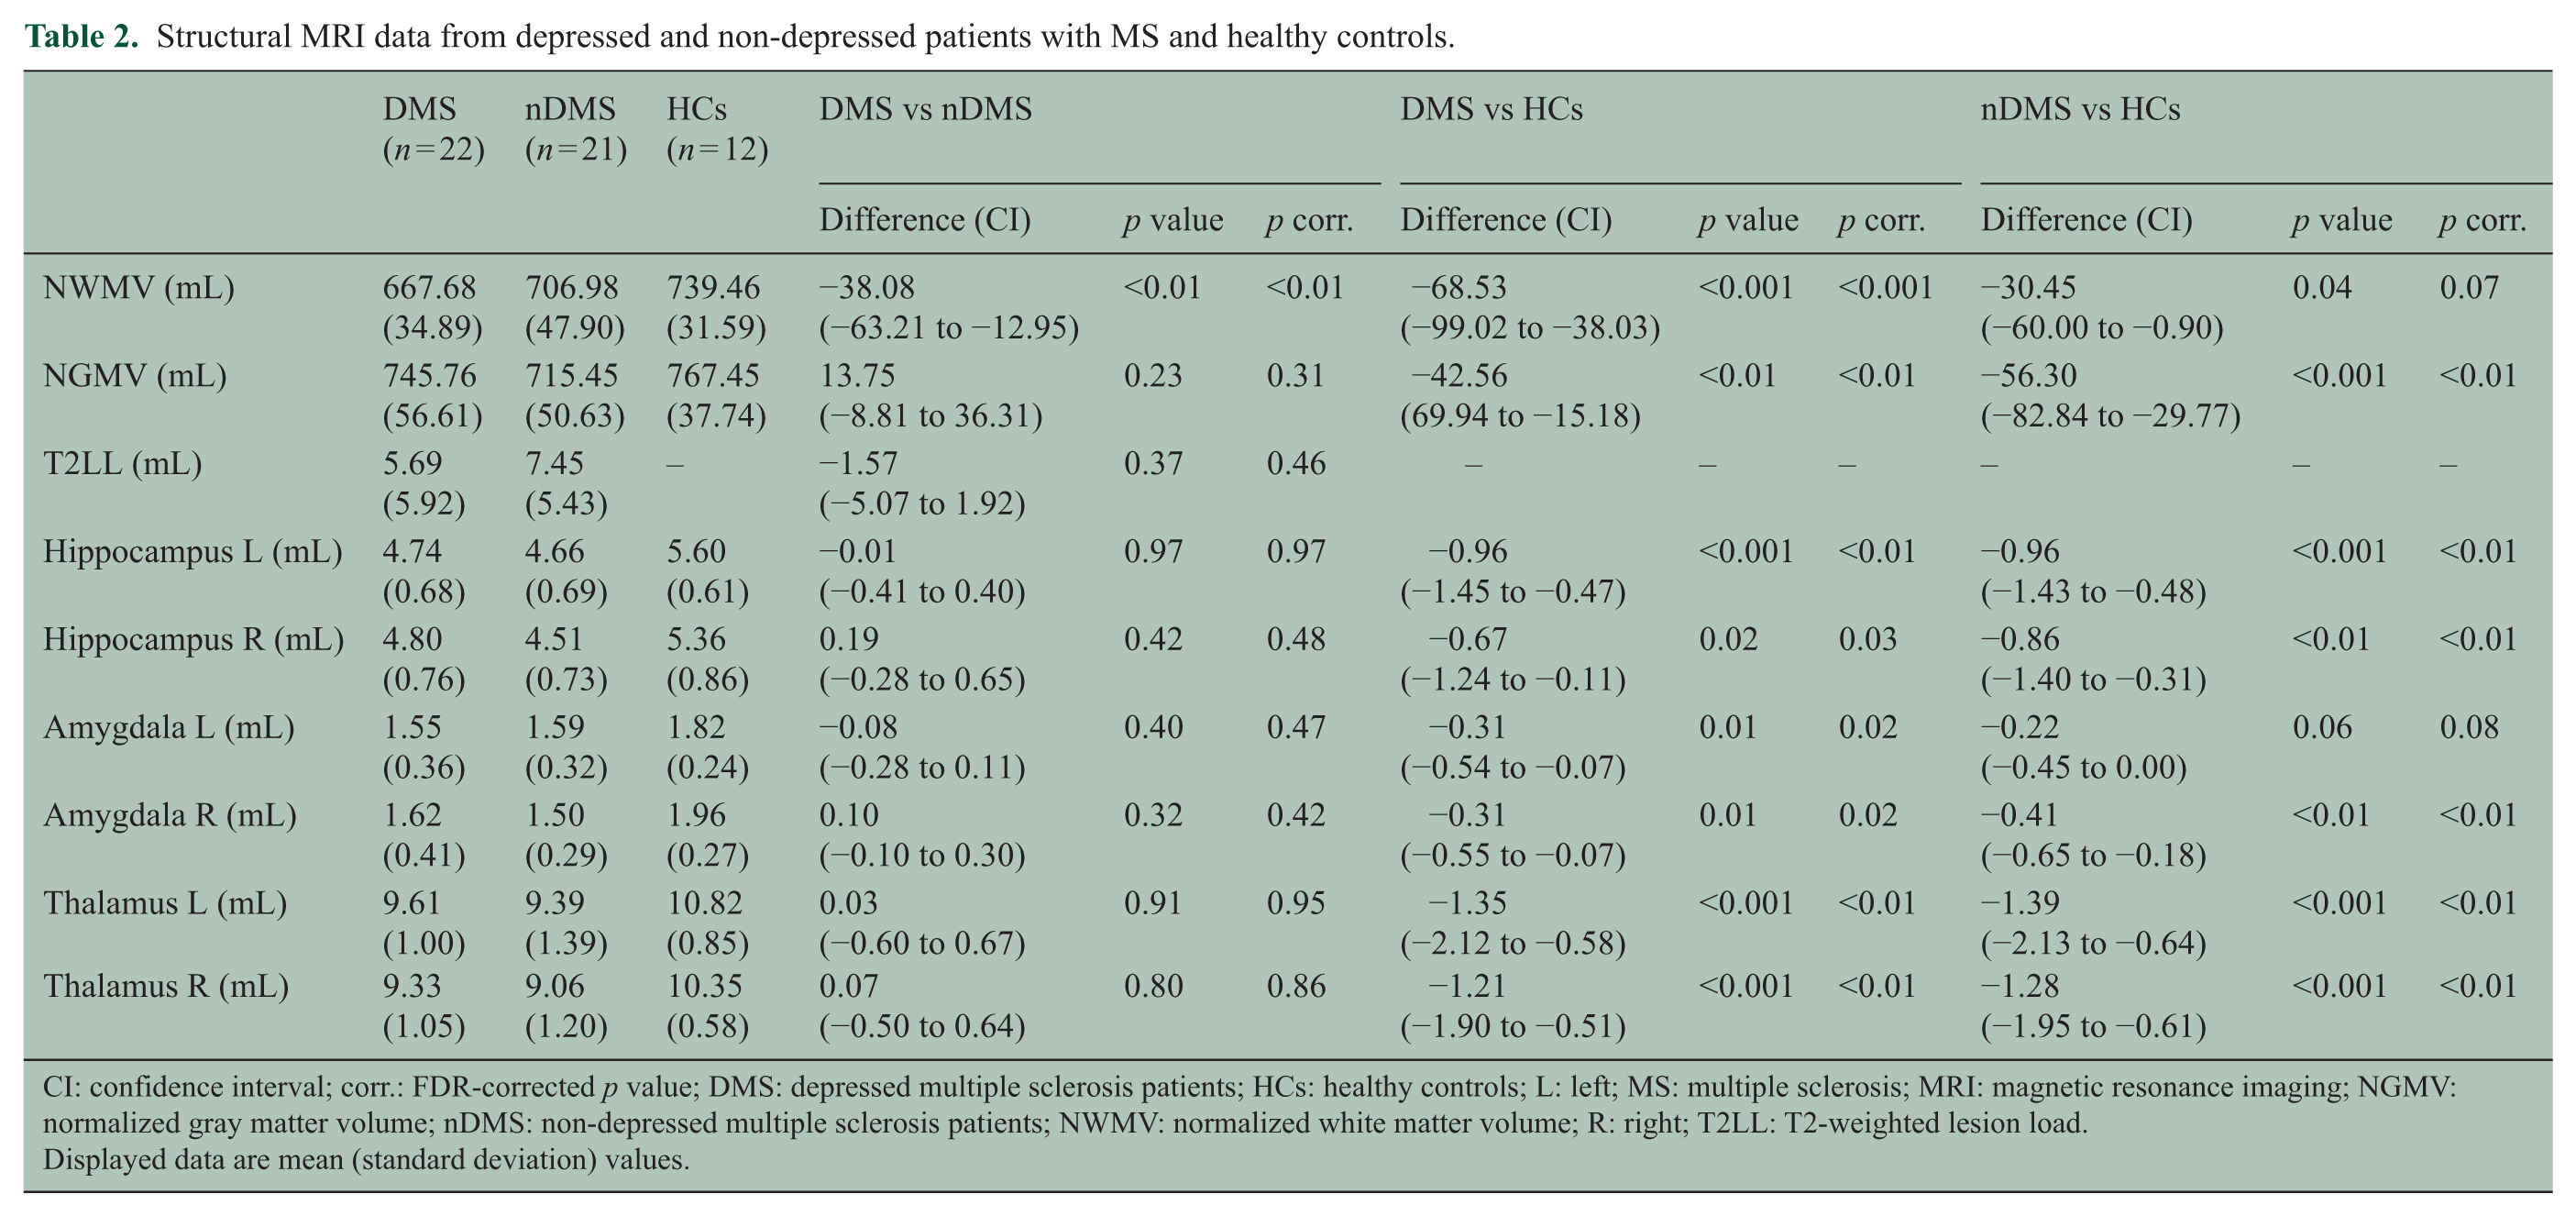
CI: confidence interval; corr.: FDR-corrected p value; DMS: depressed multiple sclerosis patients; HCs: healthy controls; L: left; MS: multiple sclerosis; MRI: magnetic resonance imaging; NGMV: normalized gray matter volume; nDMS: non-depressed multiple sclerosis patients; NWMV: normalized white matter volume; R: right; T2LL: T2-weighted lesion load.
Displayed data are mean (standard deviation) values.
Fronto-limbic WM integrity and lesion load
DMS patients displayed decreased FA compared to HCs in the left cingulum (p = 0.04) and left uncinate fasciculus (p = 0.03), whereas no differences were found between nDMS patients and HCs (Table 3). Compared to nDMS patients, DMS patients showed lower FA in the left uncinate fasciculus (p = 0.05). No differences were found for the corticospinal tract between DMS and nDMS patients. Furthermore, no differences between both MS groups were found for MD and lesion load of fronto-limbic tracts (Supplementary Table 2).
Fractional anisotropy and mean diffusivity for each white matter tract of depressed and non-depressed patients with MS and healthy controls.
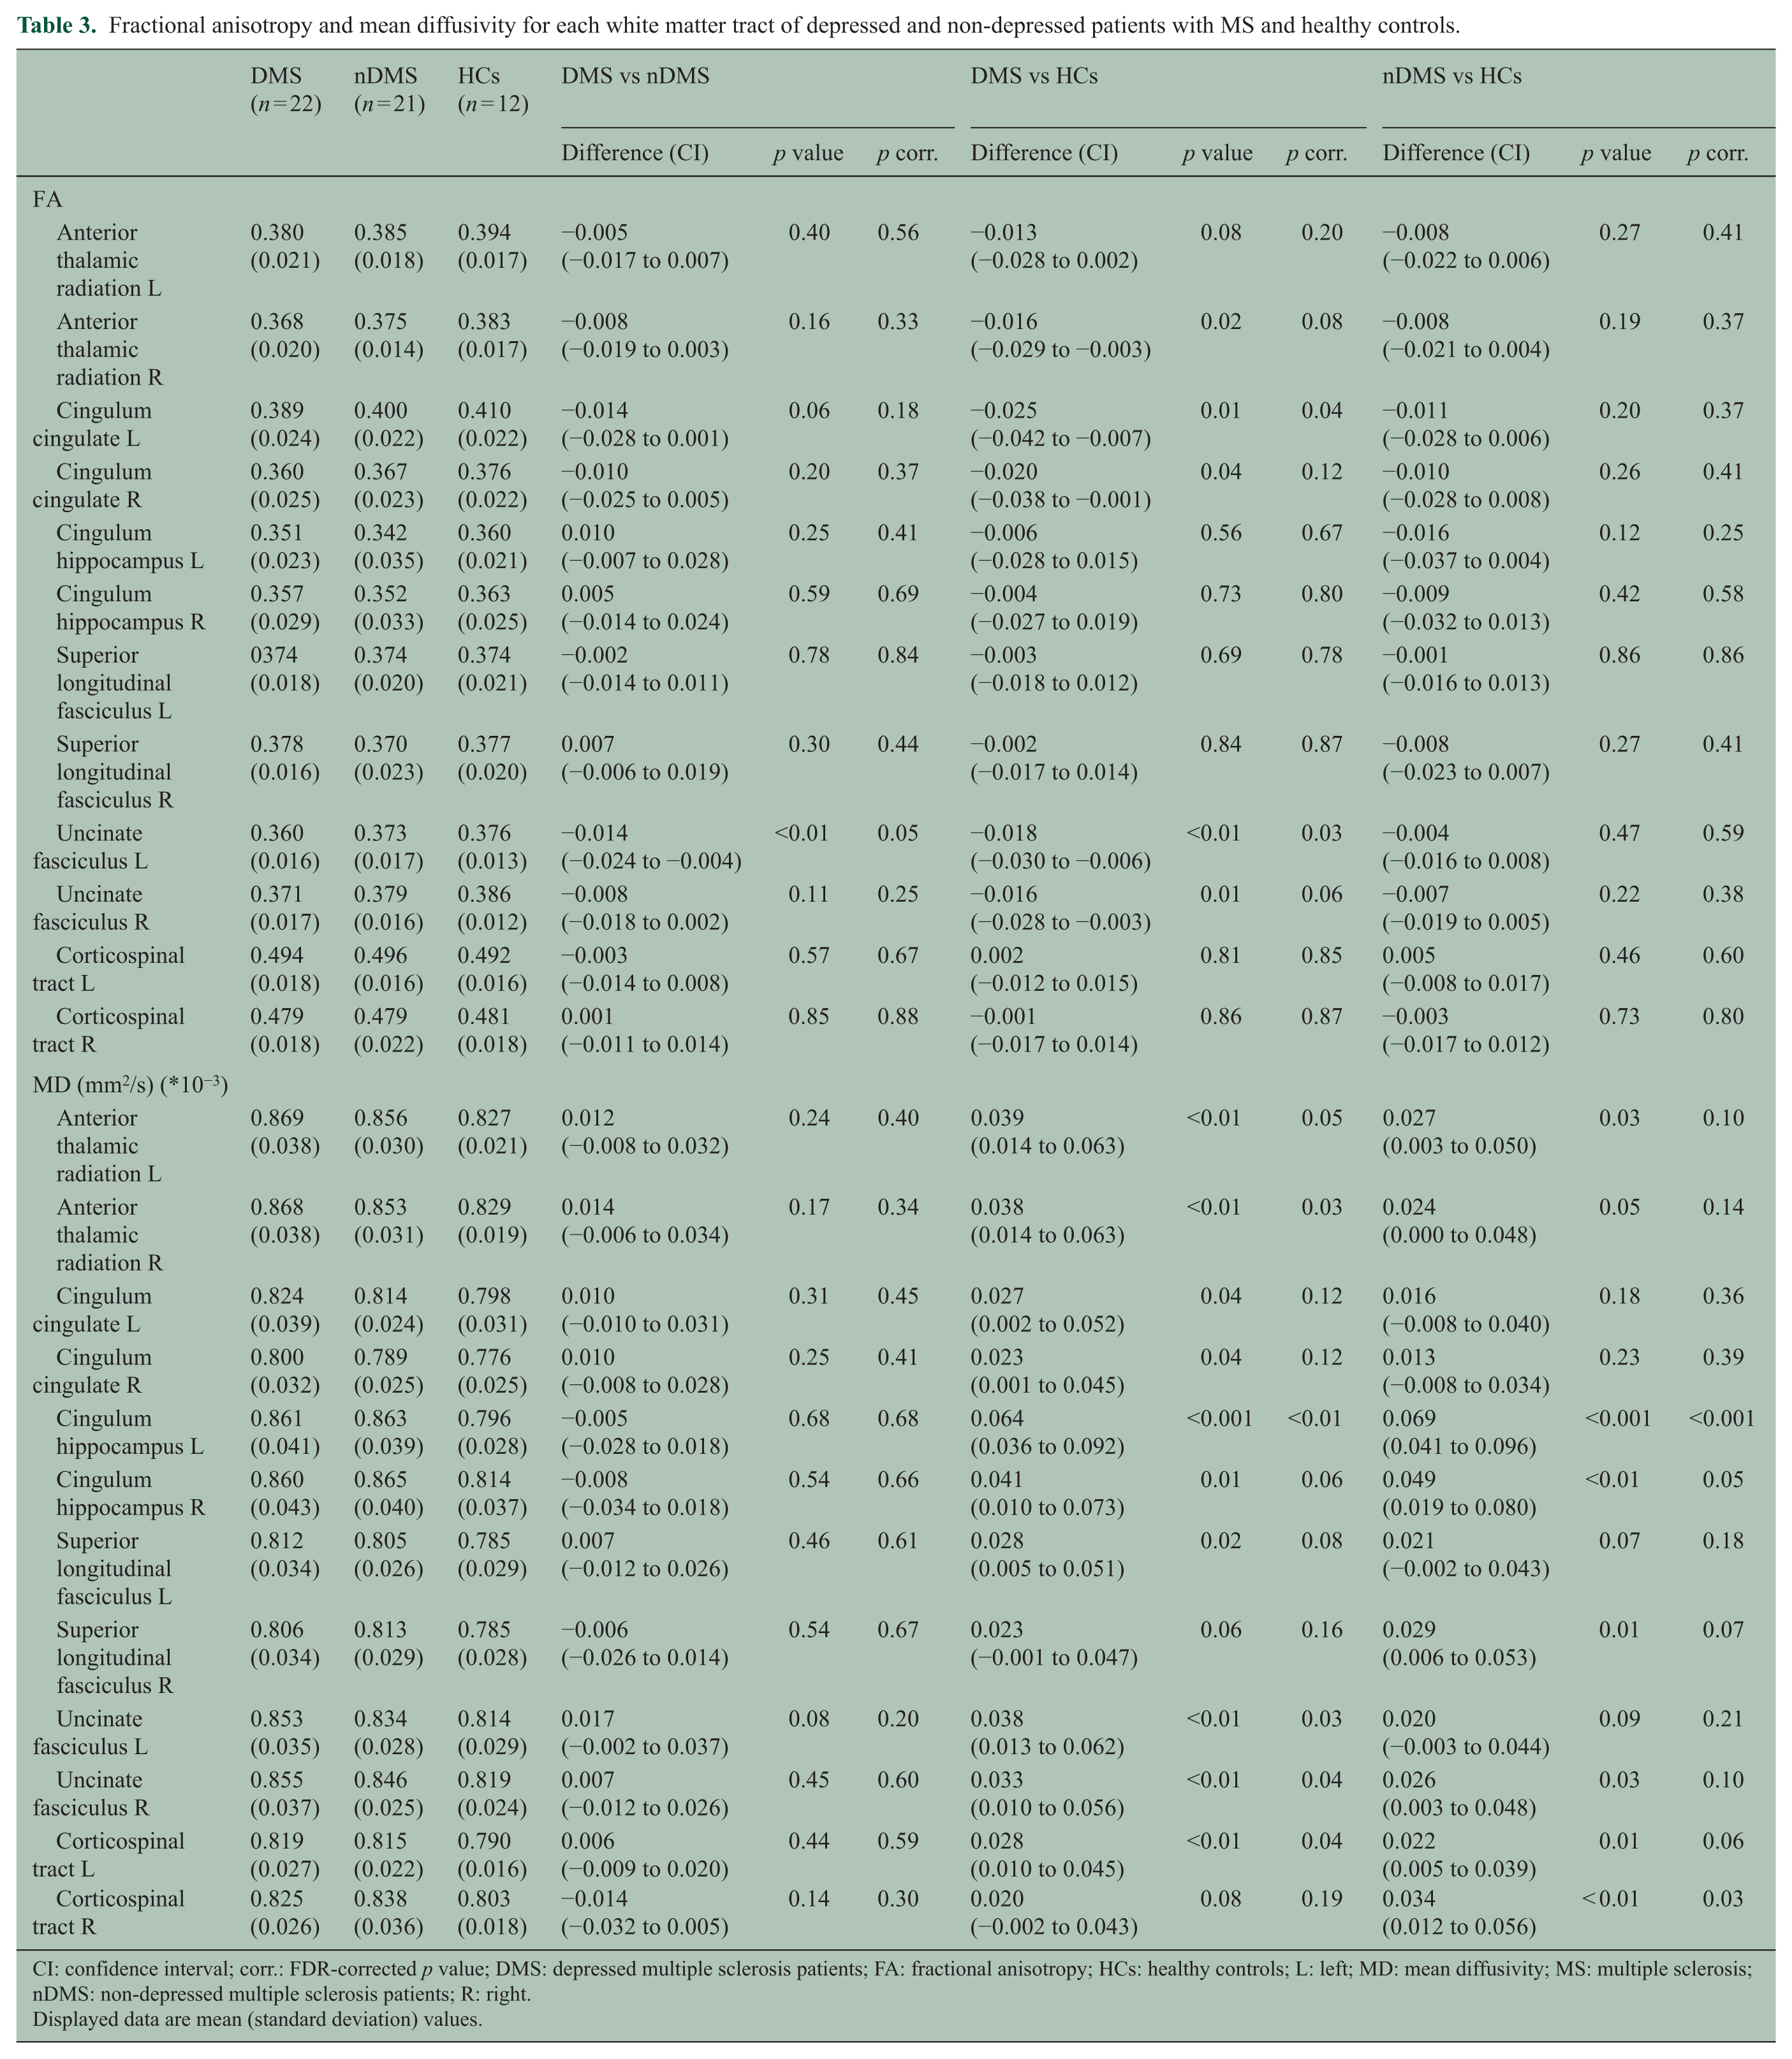
CI: confidence interval; corr.: FDR-corrected p value; DMS: depressed multiple sclerosis patients; FA: fractional anisotropy; HCs: healthy controls; L: left; MD: mean diffusivity; MS: multiple sclerosis; nDMS: non-depressed multiple sclerosis patients; R: right.
Displayed data are mean (standard deviation) values.
Fronto-limbic FC
Compared to HCs, DMS and nDMS patients did not show differences in FC between limbic and frontal regions (Table 4). However, FC of the right amygdala with frontal regions was lower in DMS compared nDMS patients (p = 0.04).
Functional connectivity between limbic and frontal brain regions of depressed and non-depressed patients with MS and healthy controls.
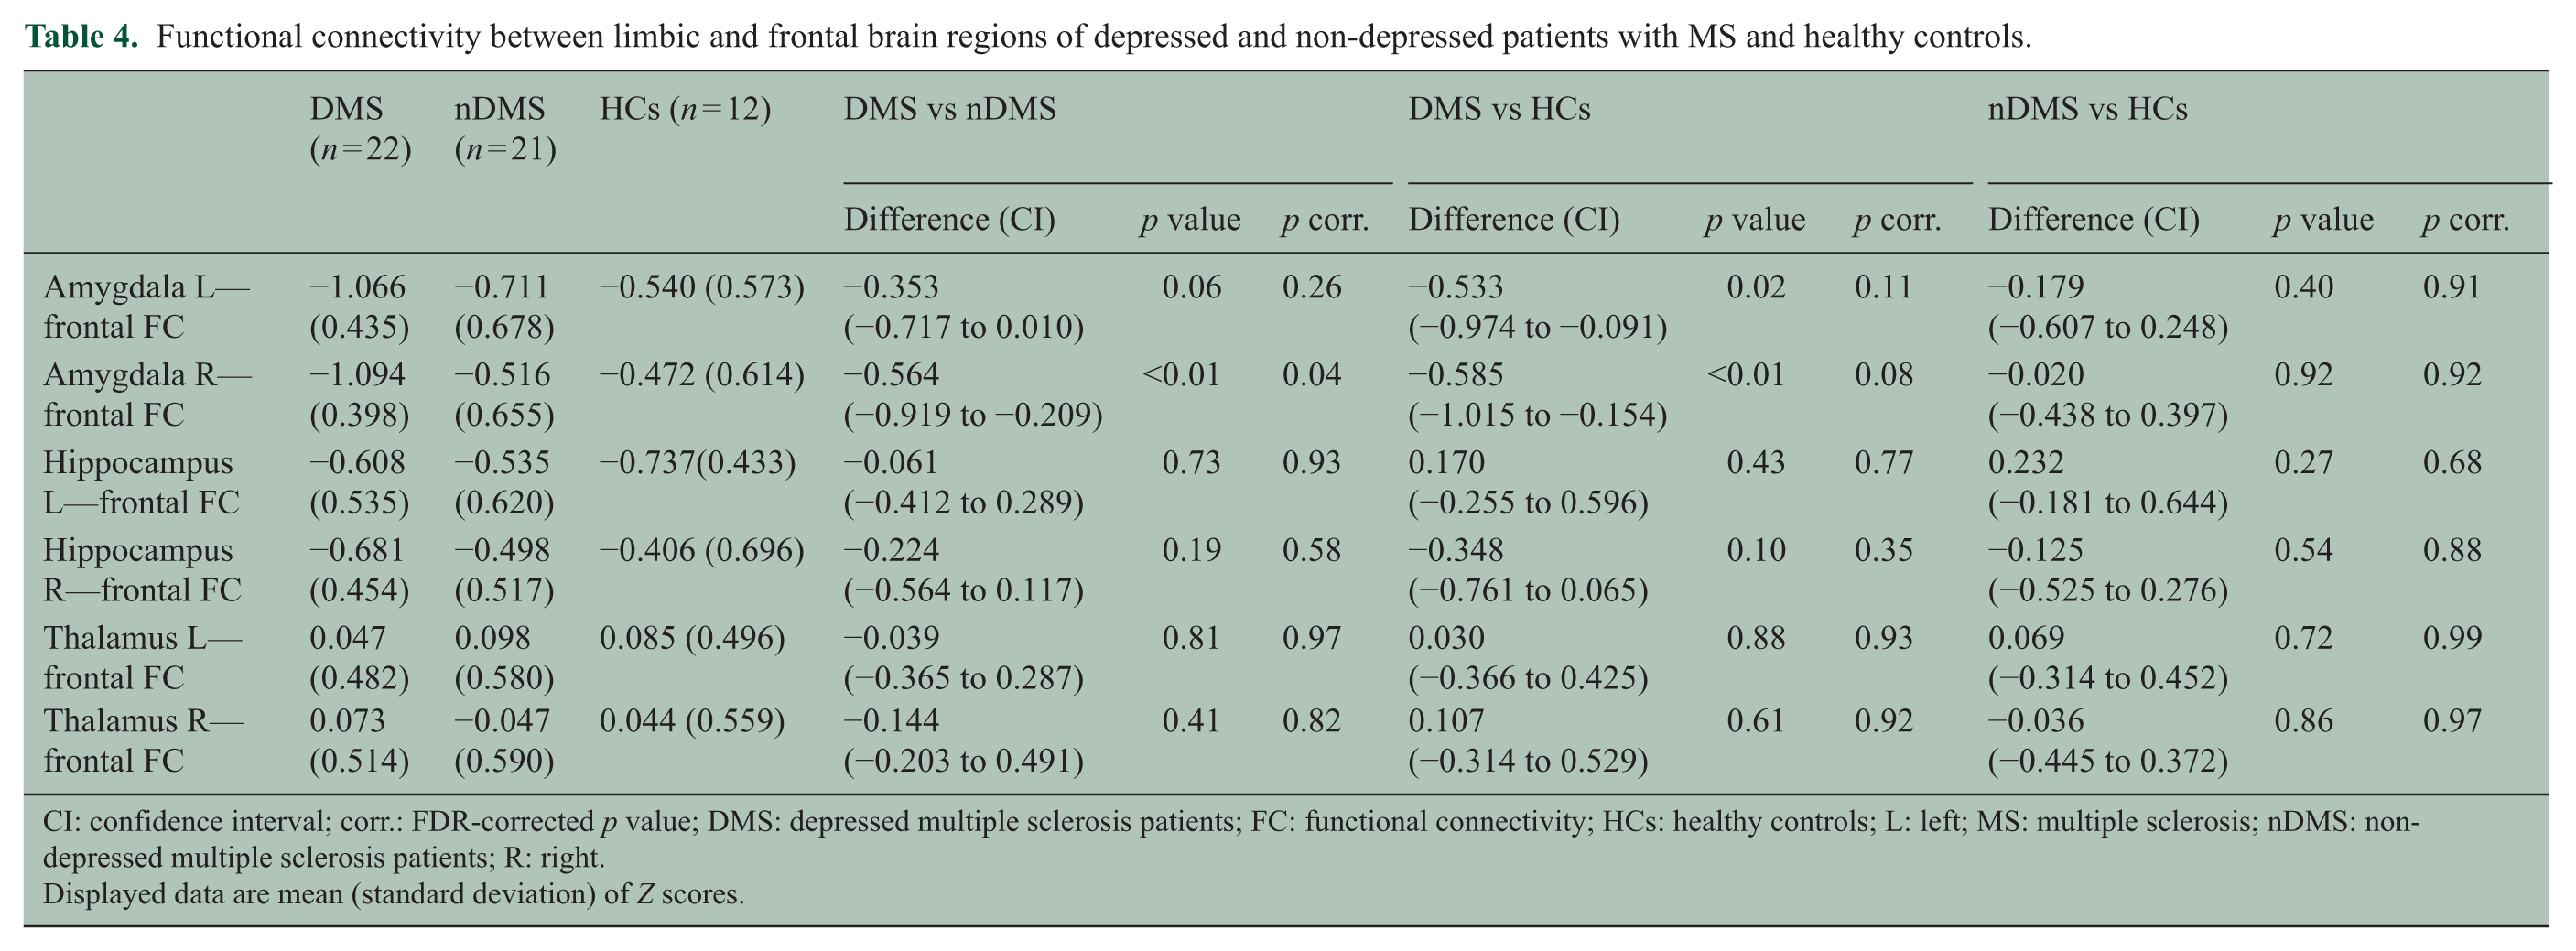
CI: confidence interval; corr.: FDR-corrected p value; DMS: depressed multiple sclerosis patients; FC: functional connectivity; HCs: healthy controls; L: left; MS: multiple sclerosis; nDMS: non-depressed multiple sclerosis patients; R: right.
Displayed data are mean (standard deviation) of Z scores.
DMS vs nDMS with correction for disease duration
Direct comparisons between DMS and nDMS patients with correction for disease duration and sex revealed significant group differences for WM volume (p < 0.001) and FC of the right amygdala (p = 0.05; see Supplementary Tables 3–5).
Relationship between depression and MRI
A hierarchical regression analysis was performed in all patients to investigate the added value of FC of the right amygdala on top of structural MRI measures (WM volume and FA of the left uncinate fasciculus) in predicting depression rank score. Structural MRI measures could explain 41% of variance in depression rank score, with disease duration (β =−0.48, p < 0.001), WM volume (β =−0.32, p = 0.02), and FA of the left uncinate fasciculus (β =−0.28, p = 0.04) as significant predictors. Adding FC of the right amygdala to the model increased the explained variance in depression rank score with 7% to a total of 48%. The significant predictors in this model were as follows: disease duration (β =−0.35, p = 0.01), FA of the left uncinate fasciculus (β =−0.35, p = 0.01), and FC of the right amygdala (β =−0.32, p = 0.02).
The impact of MDD diagnosis
Compared to nDMSlowHADS patients (n = 16; average disease duration 15.0 ± 8.7 years), DMSMDD patients (n = 14; average disease duration 6.5 ± 6.7 years) had lower WM volume (p < 0.001). However, no difference was found for FA of the left uncinate fasciculus (p = 0.64). In addition, DMSMDD patients showed a borderline significant decrease in FC between the right amygdala and frontal areas, as well as between the right hippocampus and frontal areas (p = 0.06 and p = 0.07, respectively). For all differences, see Supplementary Tables 6–10.
Discussion
In this study, we investigated structural and functional disconnection between limbic and frontal regions and depression in MS, using a multimodal approach. Both patients groups were statistically similar on several variables, including demographics, cognitive performance, GM volume and lesion load. However, in comparison with nDMS patients, DMS patients, with nearly half the disease duration of nDMS patients, had decreased WM volume, decreased FA of the uncinate fasciculus, and lower FC between the amygdala and frontal regions. Patients with a current MDD diagnosis did not show significant differences on FA of fronto-limbic WM tracts, but did display lower WM volume and a borderline significant decrease in FC between the right hippocampus and amygdala with frontal regions compared to nDMSlowHADS patients (p = 0.06). Together, these findings support our hypothesis that DMS patients have more severe structural and functional disconnection than nDMS patients in areas associated with depression and that combining structural and functional measures increases the explained variance in depressive symptoms.
Microstructural WM changes
Similar to findings in MDD (without MS),6–8 decreased FA of the uncinate fasciculus was found in DMS compared to nDMS patients. The uncinate fasciculus connects the temporal lobe, in which the amygdala and hippocampus are located, with the PFC, and is thought to be involved in cognitive and social-emotional functions. 29 Previously, lower FA in the anterior temporal lobe has been linked to depression in MS, 14 and structural network alterations including the amygdala, hippocampus, and frontal regions have been found in DMS compared to nDMS patients and HCs. 30 In addition, a higher depression rank score was related to lower FA of the left uncinate fasciculus. FA of the corticospinal tract was not different between the three groups, suggesting that the observed FA differences might be specific for depression (in MS) and perhaps do not reflect “general” changes due to MS.
Volumetric differences
Despite a shorter disease duration, DMS patients showed more severe WM atrophy than nDMS patients, but similar lesion load. In addition, WM atrophy was related to a higher depression rank score (when FC of the right amygdala was not included in the model). This is in line with previous studies that reported more severe central atrophy 31 and WM atrophy 14 in DMS compared to nDMS patients, with spatial preference for frontal and temporal regions.14,31 Lesion and GM volume were not significant predictors for depression rank score (data not shown), which is not in line with previous studies reporting higher lesion volume and more severe GM atrophy in DMS compared to nDMS patients.32,33 This is probably due to differences in sample characteristics (i.e. early or late MS and MS type).
The volume of subcortical limbic structures was similar between patient groups and lower than that of HCs, although the left amygdala of nDMS patients did not differ from that of HCs. One longitudinal study in MS showed that volume loss of the thalamus over a period of 17 months was related to more depressive symptoms in MS. 34 Thalamic atrophy in this study was observed in both patient groups relative to HCs, suggesting it to be an MS-related abnormality not specific for depression.
Functional alterations
Previous studies in patients with MDD have led to the hypothesis that FC between limbic and frontal regions is abnormal. 11 In line with this hypothesis, we observed decreased FC between the amygdala and frontal regions in DMS compared to nDMS patients, which was related to a higher depression rank score. Our results are in line with a previous study that found higher depression scores in MS to be related to lower RS FC between the hippocampus and orbitofrontal cortex. 17 Also during emotional processing, decreased FC between the amygdala and hippocampus can be observed relative to HCs, while within MS patients, lower FC between the amygdala with dorsolateral PFC and the hippocampus with orbitofrontal cortex was related to higher BDI scores. 16 Taken together, decreased FC between the amygdala with frontal regions might be a fingerprint of MS with comorbid depression.
Cognitive functioning
Although depression can be a confounder of cognitive performance in MS, 13 DMS and nDMS patients performed similar on cognitive tests. In the post hoc analysis, DMSMDD patients performed worse than nDMSlowHADS patients on verbal memory. This is in line with a previous study in MS that related higher BDI scores with worse performance on verbal memory. 13 Future studies should follow DMS patients over time to see whether fronto-limbic changes make them more prone to develop cognitive impairment.
While our study has several strengths (i.e. multimodal approach, inclusion of moderate-to-severe DMS patients), our results have to be interpreted carefully due to sample sizes. We cannot conclude whether DMS patients already had a predisposition to develop a depression (nine DMS patients had a lifetime diagnosis of MDD with the onset prior to MS diagnosis) or whether MS pathology in fronto-limbic regions resulted in a depression. On average, in the group of nine patients with MDD diagnosis before MS diagnosis, the MDD diagnosis was 15 years prior to MS diagnosis. Furthermore, the first MS-related complaints (self-report) in this group were on average 7 years before MS diagnosis, thereby not completely coinciding with the time of MDD diagnosis. This might suggest that the MDD is an unrelated condition in this group. However, a previous study also suggested that depression might be a prodromal symptom of MS. 35 Ideally, we would have included MDD patients (without MS), in order to determine whether the changes we observed in DMS patients are similar to that in MDD (suggestive of a primary MDD) or whether the changes are more pronounced in our MS patients (suggestive of an interaction effect). Another limitation of the study is that the nDMS patients and HCs were prospectively recruited in the context of another study (no prior publications) but retrospectively added to the DMS patients in this study. As both patient groups differed in disease duration, we corrected for age (significantly correlated to disease duration; ρ = 0.59) and performed additional analyses with direct comparison between DMS and nDMS patients and correction for disease duration. Although we applied an FDR correction, the subgroup analyses are still prone to possible false-positive results given the small group sizes, and therefore, the findings have to be interpreted carefully. The results from the subgroup analyses were rather similar to that of the main analyses, except for FA of the left uncinate fasciculus that did not survive the correction for multiple testing. Finally, the depression rank score has to be interpreted carefully, as two different questionnaires were used.
To conclude, DMS patients showed more severe WM atrophy, decreased FA of the uncinate fasciculus, and decreased FC between the amygdala and frontal areas than nDMS patients, suggestive of fronto-limbic disconnection. The latter two measures were complementary predictors for the severity of depression and explained almost 50% of the variance, thereby highlighting the importance of a multimodal approach in understanding the etiology of depression in MS.
Supplemental Material
MSJ767051_supplementary_methods – Supplemental material for Fronto-limbic disconnection in patients with multiple sclerosis and depression
Supplemental material, MSJ767051_supplementary_methods for Fronto-limbic disconnection in patients with multiple sclerosis and depression by Quinten van Geest, Rosa E Boeschoten, Matthijs J Keijzer, Martijn D Steenwijk, Petra JW Pouwels, Jos WR Twisk, Johannes H Smit, Bernard MJ Uitdehaag, Jeroen JG Geurts, Patricia van Oppen and Hanneke E Hulst in Multiple Sclerosis Journal
Supplemental Material
MSJ767051_supplementary_tables – Supplemental material for Fronto-limbic disconnection in patients with multiple sclerosis and depression
Supplemental material, MSJ767051_supplementary_tables for Fronto-limbic disconnection in patients with multiple sclerosis and depression by Quinten van Geest, Rosa E Boeschoten, Matthijs J Keijzer, Martijn D Steenwijk, Petra JW Pouwels, Jos WR Twisk, Johannes H Smit, Bernard MJ Uitdehaag, Jeroen JG Geurts, Patricia van Oppen and Hanneke E Hulst in Multiple Sclerosis Journal
Footnotes
Acknowledgements
Q.v.G. has contributed to the design and conceptualization of the study, acquisition of data, analysis and interpretation of the data, and drafting/revising the manuscript. R.E.B. has contributed to the design and conceptualization of the study, analysis and interpretation of the data, and drafting/revising the manuscript. M.J.K. has contributed to the design and conceptualization of the study, acquisition of data, interpretation of the data, and drafting/revising the manuscript. M.D.S. has contributed to the interpretation of the data and drafting/revising the manuscript. P.J.W.P. has contributed to the interpretation of the data and drafting/revising the manuscript. J.W.R.T. has advised on the statistical analyses and contributed to the interpretation of the data and revising the manuscript. J.H.S. has contributed to the interpretation of the data and drafting/revising the manuscript. B.M.J.U. has contributed to the interpretation of the data and drafting/revising the manuscript. J.J.G.G. has contributed to the design and conceptualization of the study, analysis and interpretation of the data, and drafting/revising the manuscript. P.v.O. has contributed to the design and conceptualization of the study, analysis and interpretation of the data, and drafting/revising the manuscript. H.E.H. has contributed to the design and conceptualization of the study, acquisition of data, analysis and interpretation of the data, and drafting/revising the manuscript.
Declaration of Conflicting Interests
The author(s) declared the following potential conflicts of interest with respect to the research, authorship, and/or publication of this article: Q.v.G., R.E.B., M.J.K., M.D.S., J.H.S., J.W.R.T., and P.v.O. have nothing to disclose. P.J.W.P. receives research support from the Dutch MS Research Foundation, grant number 14-876. B.M.J.U. has received personal compensation for consulting from Biogen Idec, Genzyme, Merck Serono, Novartis, and Roche en TEVA. J.J.G.G. serves on the editorial boards of MS Journal, BMC Neurology, MS International and Neurology and the Scientific Advisory Board of the Dutch MS Research Foundation and of MS Academia, Merck Serono, and has served as a consultant for Merck Serono, Biogen Idec, Novartis, Sanofi Genzyme, and Teva Pharmaceuticals. H.E.H. receives research support from the Dutch MS Research Foundation, grant number 12-799, and serves as a consultant for Sanofi Genzyme, Merck Serono, Roche, and Novartis.
Funding
The author(s) disclosed receipt of the following financial support for the research, authorship, and/or publication of this article: This study was funded by the Department of Research & Innovation of the VU University Medical Center/Psychiatry and GGZ inGeest.
References
Supplementary Material
Please find the following supplemental material available below.
For Open Access articles published under a Creative Commons License, all supplemental material carries the same license as the article it is associated with.
For non-Open Access articles published, all supplemental material carries a non-exclusive license, and permission requests for re-use of supplemental material or any part of supplemental material shall be sent directly to the copyright owner as specified in the copyright notice associated with the article.