
Abstract
Background:
Coordinated patterns of gray matter morphology can be represented as networks, and network disruptions may explain cognitive dysfunction related to multiple sclerosis (MS).
Objective:
To investigate whether single-subject gray matter network properties are related to impaired cognition in MS.
Methods:
We studied 148 MS patients (99 female) and 33 healthy controls (HC, 21 female). Seven network parameters were computed and compared within MS between cognitively normal and impaired subjects, and associated with performance on neuropsychological tests in six cognitive domains with regression models. Analyses were controlled for age, gender, whole-brain gray matter volumes, and education level.
Results:
Compared to MS subjects with normal cognition, MS subjects with cognitive impairment showed a more random network organization as indicated by lower lambda values (all p < 0.05). Worse average cognition and executive function were associated with lower lambda values. Impaired information processing speed, working memory, and attention were associated with lower clustering values.
Conclusion:
Our findings indicate that MS subjects with a more randomly organized gray matter network show worse cognitive functioning, suggesting that single-subject gray matter graphs may capture neurological dysfunction due to MS.
Keywords
Introduction
Multiple sclerosis (MS) is a chronic inflammatory, demyelinating, and degenerative disease of the central nervous system that is frequently accompanied by cognitive decline. 1 Although a demyelinating disease, conventional magnetic resonance imaging (MRI) measures of white matter lesions and damage only show limited correspondence with cognitive deficits. 2 Traditional structural MRI measures such as white matter lesion volumes 3 and localized atrophy 4 show associations with cognitive decline. Still, these measures explain only part of the variance in cognitive performance, probably because these measurements do not take into account the inherent structural connectivity of the brain, highlighting the importance of developing more sensitive and comprehensive tools to study the relationship between clinical status and changes in brain structure.
We recently showed that specific patterns of brain atrophy in MS show an improved relationship with clinical and cognitive observed profiles in MS. 5 One way to precisely describe such patterns of gray matter morphology is by representing them as a network. 6 Brain areas that show co-variation in cortical volume, thickness, and/or surface area often belong to recognized cognitive systems. 6 For example, hippocampal volume covaries with other areas involved in memory systems, such as the amygdala, perirhinal, entorhinal, and orbitofrontal cortices. 7 Previous studies showed that gray matter networks become abnormal in several neurological and psychiatric disorders, such as Alzheimer disease 8 and schizophrenia. 9 Moreover, these alterations have been associated with cognitive impairment, suggesting that gray matter networks capture pathophysiologically and cognitively relevant information.10,11 The first gray matter network studies in MS based on cortical thickness inter-regional correlation analysis have demonstrated that gray matter networks become disorganized,12,13 which seems to be associated with white matter lesion load 12 and disrupted functional connectivity. 13 However, since these studies have used methodologies that result in one network per group, those findings could not be further associated with individual patient measures of cognitive functioning.
In this study, we aimed to investigate single-subject gray matter networks in MS and their association with cognitive dysfunction. We hypothesized that more pronounced network disorganization would be related to worse cognitive impairment in MS.
Materials and methods
Participants
In total, 148 MS patients (99 female) and 33 healthy controls (HC, 21 female) were included in this study. Patients in the present sample were part of an early inception cohort in which patients were included at (or closely before) diagnosis and subsequently followed annually. 14 By the time of image acquisition, MS patients were all around 7 years post-diagnosis. All patients were diagnosed with clinically definite MS following the revised McDonald criteria. 15 Physical disability was measured with the Expanded Disability Status Scale (EDSS). MS subtypes included relapsing–remitting multiple sclerosis (RRMS; 124 patients), primary progressive multiple sclerosis (PPMS; 15 patients), and secondary progressive multiple sclerosis (SPMS; 9 patients). A total of 87 patients (58.8% of all patients) had taken disease-modifying therapy (DMT), with mean treatment duration of 50.9 months. At the time of the scan, patients were relapse-free and without steroid treatment for at least 2 months. A scale (1–7) from the lowest to the highest level was used to determine the educational level of all subjects. The study was approved by the institutional ethics review board, and all subjects gave written informed consent prior to participation.
Neuropsychological evaluation
Subjects underwent a comprehensive set of neuropsychological tests that comprised a modified version of the Brief Repeatable Battery for Neurological disease 16 as well as the concept shifting test (CST), the Stroop color-word test, and the memory comparison test (MCT). The paced auditory serial addition test (PASAT) was excluded from the battery as all patients had performed this task repeatedly in the past and showed significant learning effects. 17 Cognitive test scores were Z-transformed and were used to analyze the following six cognitive domains: 14 executive functioning (CST, word list generation), verbal memory (Selective Reminding Test), information processing speed (Symbol Digit Modalities Test (SDMT)), visuospatial memory (Spatial Recall Test), working memory (MCT), and attention (Stroop). Average cognition was obtained by averaging z-scores across all cognitive tests. Next, we labeled MS patients as being cognitively impaired when they scored at least 2.0 z-scores below the standard average for each test in two or more cognitive domains, and the remaining MS patients were labeled as cognitively normal.
MRI acquisition and preprocessing
Patients underwent MRI in a 3-T whole body scanner (GE Signa HDxT, Cleveland, OH, USA) using an eight-channel phased-array head coil. Network analysis was performed on a 3DT1-weighted fast spoiled gradient echo sequence (repetition time 7.8 ms, echo time 3 ms, inversion time 450 ms, flip angle 12°, sagittal 1.0 mm slices, 0.94 × 0.94 mm2 in-plane resolution), which was also used for volumetric measures. This sequence was previously lesion-filled with LEasion Automated Preprocessin (LEAP) 18 using lesion maps generated with automated lesion segmentation (k nearest neighbor classification with tissue type priors (kNN-TPP) 19 ) on a three-dimensional fluid attenuated inversion recovery sequence (3D FLAIR; repetition time 8000 ms, echo time 125 ms, inversion time 2350 ms, sagittal 1.2 mm slices, 0.98 × 0.98 mm2 in-plane resolution). To determine lesion volumes for correlations, two-dimensional (2D) imaging techniques were used instead of 3D FLAIR, in order to allow simultaneous T2 hyperintense and T1-black-hole lesion detection at the same resolution and orientation. Thus, lesion segmentation was performed on 2D-T2-weighted dual echo (repetition time 9680 ms, echo time 22/112 ms, flip angle 90º, 3-mm contiguous axial slices, in-plane resolution 0.6 × 0.6 mm2) and 2D T1-weighted spin echo sequences (repetition time 475 ms, echo time 9 ms, flip angle 90º, 3 mm contiguous axial slices, in-plane resolution 0.7 × 1 mm2), respectively, using Alice (Perceptive Informatics, East Windsor, NJ, USA) as described previously. 14 Whole-brain volumes were obtained with SIENAX (part of FSL 5, http://www.fmrib.ox.ac.uk/fsl), providing whole-brain, white matter, and gray matter normalized volumes. Gray matter segmentations for network analysis were obtained from the lesion-filled 3DT1-weighted images using the optimized FSL voxel-based morphometry (VBM) protocol. The quality of all segmentations was visually inspected, and none of the scans had to be excluded. Gray matter segmentations were resliced to 2 mm3 isotropic voxels.
Single-subject gray matter networks
Single-subject gray matter networks were extracted from the native space partial volume gray matter segmentations (https://github.com/bettytijms/Single_Subject_Grey_Matter_Networks). 20 First small regions of interest of 3 ×3 × 3 voxel cubes were extracted from the gray matter segmentation, based on the minimal resolution that can capture both cortical folding and thickness. 20 This resulted in similarity matrices with an average size across individuals of 7000 rows and columns corresponding to cortical regions of interest. Statistical similarity between the regions of interest was determined with the Pearson’s correlation. Since the cortex is a curved object, regions of interest that are statistically similar might be placed at angle from each other, which might lead to an underestimation of their similarity. Therefore, we maximized the correlation coefficient between any two regions by rotating with 45° across all axes, as well as reflection, which we have previously demonstrated is sufficient to recover 99% of expected similarities. 20 Next, the resulting similarity matrices were binarized to construct unweighted and undirected networks after determining a subject-specific threshold based on permutation testing that ensures a similar chance of including 5% spurious correlations for all individuals. 21 For each network, we computed the following seven network parameters: degree (i.e. average number of connections of network nodes over the number of nodes), connectivity density (i.e. percentage of existing connections compared to the maximum number of possible connections), characteristic path length ((L), that is, the minimum number of edges between any pair of nodes), and characteristic clustering coefficient (C). 22 Additionally, we computed the small-world coefficients by normalizing the C and L of each network with those averaged from 20 randomized reference networks with identical size and degree distribution. Normalized C was denoted as γ, and normalized L was denoted as λ. When γ/λ > 1, a network’s topology shows a more ordered pattern of connectivity than that of a random network (i.e. “small world”). 23 To aid comparability across individual subjects in their regional network properties and to reduce dimensionality of the data, we averaged local network property values across the nodes within each of the 90 anatomical areas that were defined with the automated anatomical labeling (AAL) atlas. 24
Statistical analysis
Distributions of all variable values were checked for normality using Kolmogorov–Smirnov tests, together with visual inspection of the histograms. T1 and T2 lesion volumes were log-transformed before statistical analyses to approximate normality. Demographic characteristics were compared between groups with analyses of variance (ANOVAs), chi-square, and non-parametric Kruskal Wallis tests when appropriate. Analysis of covariance (ANCOVA) was used to assess group differences in network parameters between controls and MS subjects, and for the comparison within the MS group between subjects with normal and impaired cognition. All models were adjusted for age, gender, educational level, and whole-brain gray matter volume. Previous studies showed that size, degree, and connectivity density might influence other network properties.10,25 Therefore, we first tested group effects for the network defining properties size, connectivity density, and average degree. In the case of significance, these properties were added as an additional covariate to more complex network properties. ANCOVA models were repeated for gray matter network properties at a regional AAL level, additionally correcting for regional gray matter volume and degree. False discovery rate (FDR) correction was used to adjust for multiple comparisons. Multivariate stepwise elimination regression models were used in order to determine which predictors (age, gender, educational level, disease duration, normalized gray and white matter volumes, T1 and T2 lesion loads, and network measures) explained the most variance in cognitive functioning. Z-scores of each cognitive domain and average cognition entered as dependent variables of each model. All analyses were performed in SPSS 20 for Windows.
Results
Sample characteristics
Table 1 summarizes the descriptive characteristics of the control and MS groups. Network extraction failed for one patient due to technical issues, and this person was excluded from further analysis. Of all MS subjects, 122 (82%) were labeled as cognitively normal and 25 (17%) as cognitively impaired. Compared to the other groups, cognitively impaired MS subjects had a higher percentage of male subjects and were older (p < 0.01). These subjects also showed higher EDSS, had higher T1 and T2 lesion load, and lower gray matter volumes (p < 0.01), and had a higher percentage of patients with progressive MS subtypes (i.e. SPMS and PPMS) (46.1%) compared to MS subjects with normal cognition (all p < 0.05). Groups showed comparable levels of education and disease duration. As per definition, cognitively impaired MS subjects showed worse performance in all cognitive domains, with executive functioning showing the worst impairment. Cognitively preserved MS subjects were comparable with controls in all cognitive domains.
Demographical and clinical characteristic of healthy controls (HC) and multiple sclerosis (MS) patients.
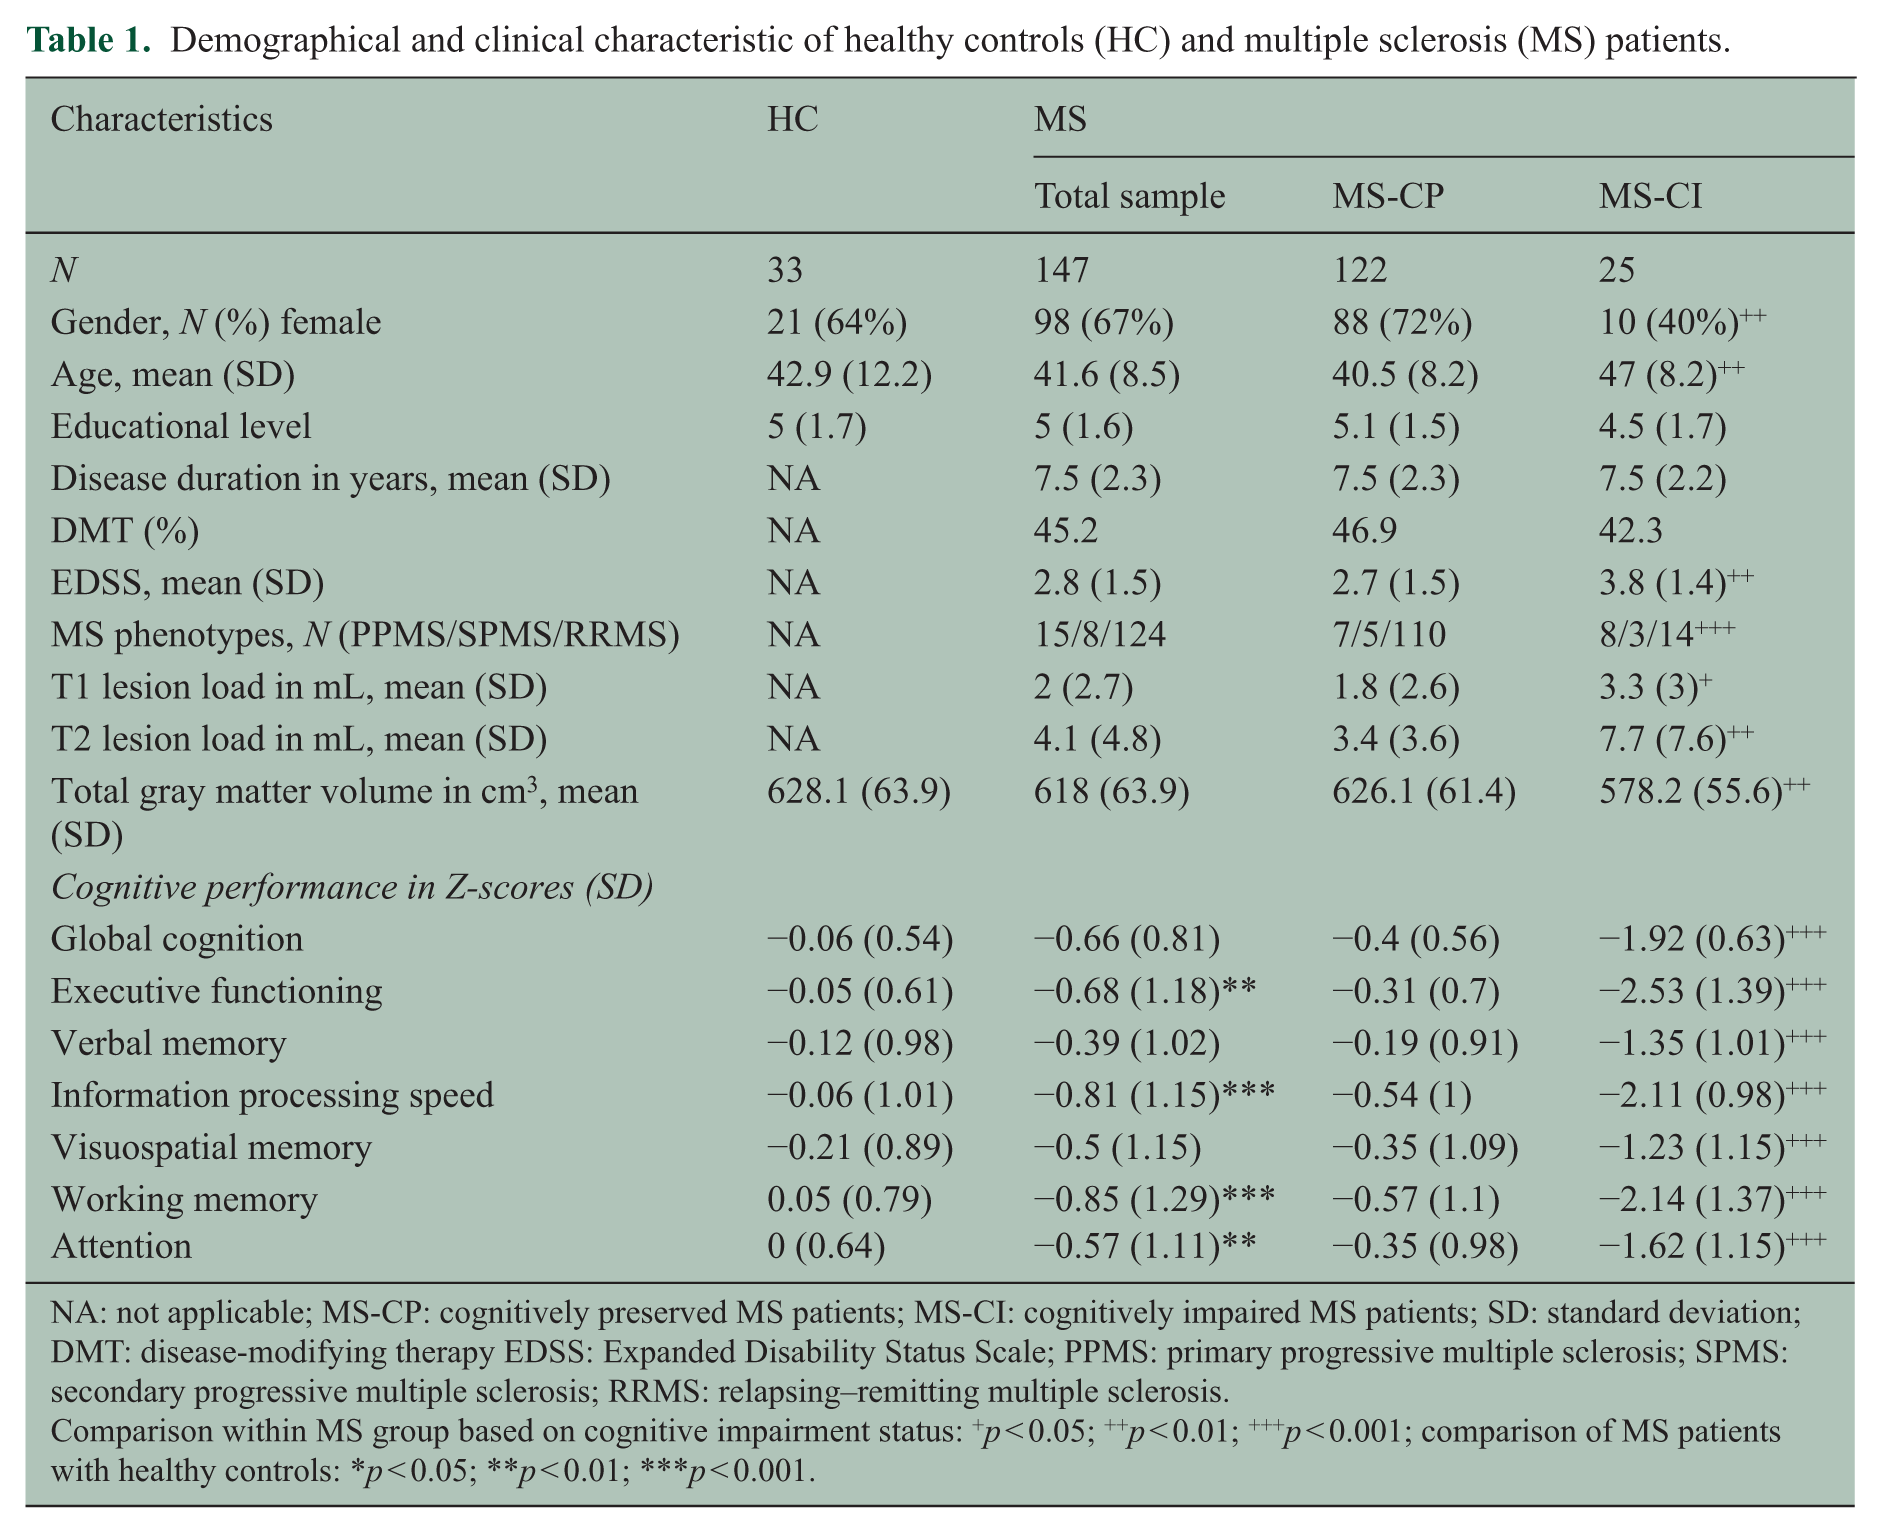
NA: not applicable; MS-CP: cognitively preserved MS patients; MS-CI: cognitively impaired MS patients; SD: standard deviation; DMT: disease-modifying therapy EDSS: Expanded Disability Status Scale; PPMS: primary progressive multiple sclerosis; SPMS: secondary progressive multiple sclerosis; RRMS: relapsing–remitting multiple sclerosis.
Comparison within MS group based on cognitive impairment status: +p < 0.05; ++p < 0.01; +++p < 0.001; comparison of MS patients with healthy controls: *p < 0.05; **p < 0.01; ***p < 0.001.
Gray matter network comparisons
Compared to controls, MS subjects had a lower degree (p = 0.02) and connectivity density (p < 0.001; Table 2). Within the MS group, subjects with impaired cognition showed lower degree (p = 0.04) and connectivity density values (p < 0.001). The unnormalized path length value was higher in the cognitively impaired group (p < 0.05). However, path length values can be trivially increased in the case of less connections or lower connectivity density values. When additionally correcting for connectivity density, cognitively impaired MS patients showed lower values of path length, similar to the relationship observed for λ (see residual path length values after correction for connectivity density in Figure 1). The clustering coefficient also tended to be lower in cognitively impaired MS subjects; however, after correcting for connectivity density, this difference lost significance (p = 0.11). Repeating analyses including only subjects with RRMS showed largely similar results (Supplementary Table 1).
Values of global gray matter network properties between healthy controls (HC) and multiple sclerosis (MS) patients, and within MS sample based on cognitive status.
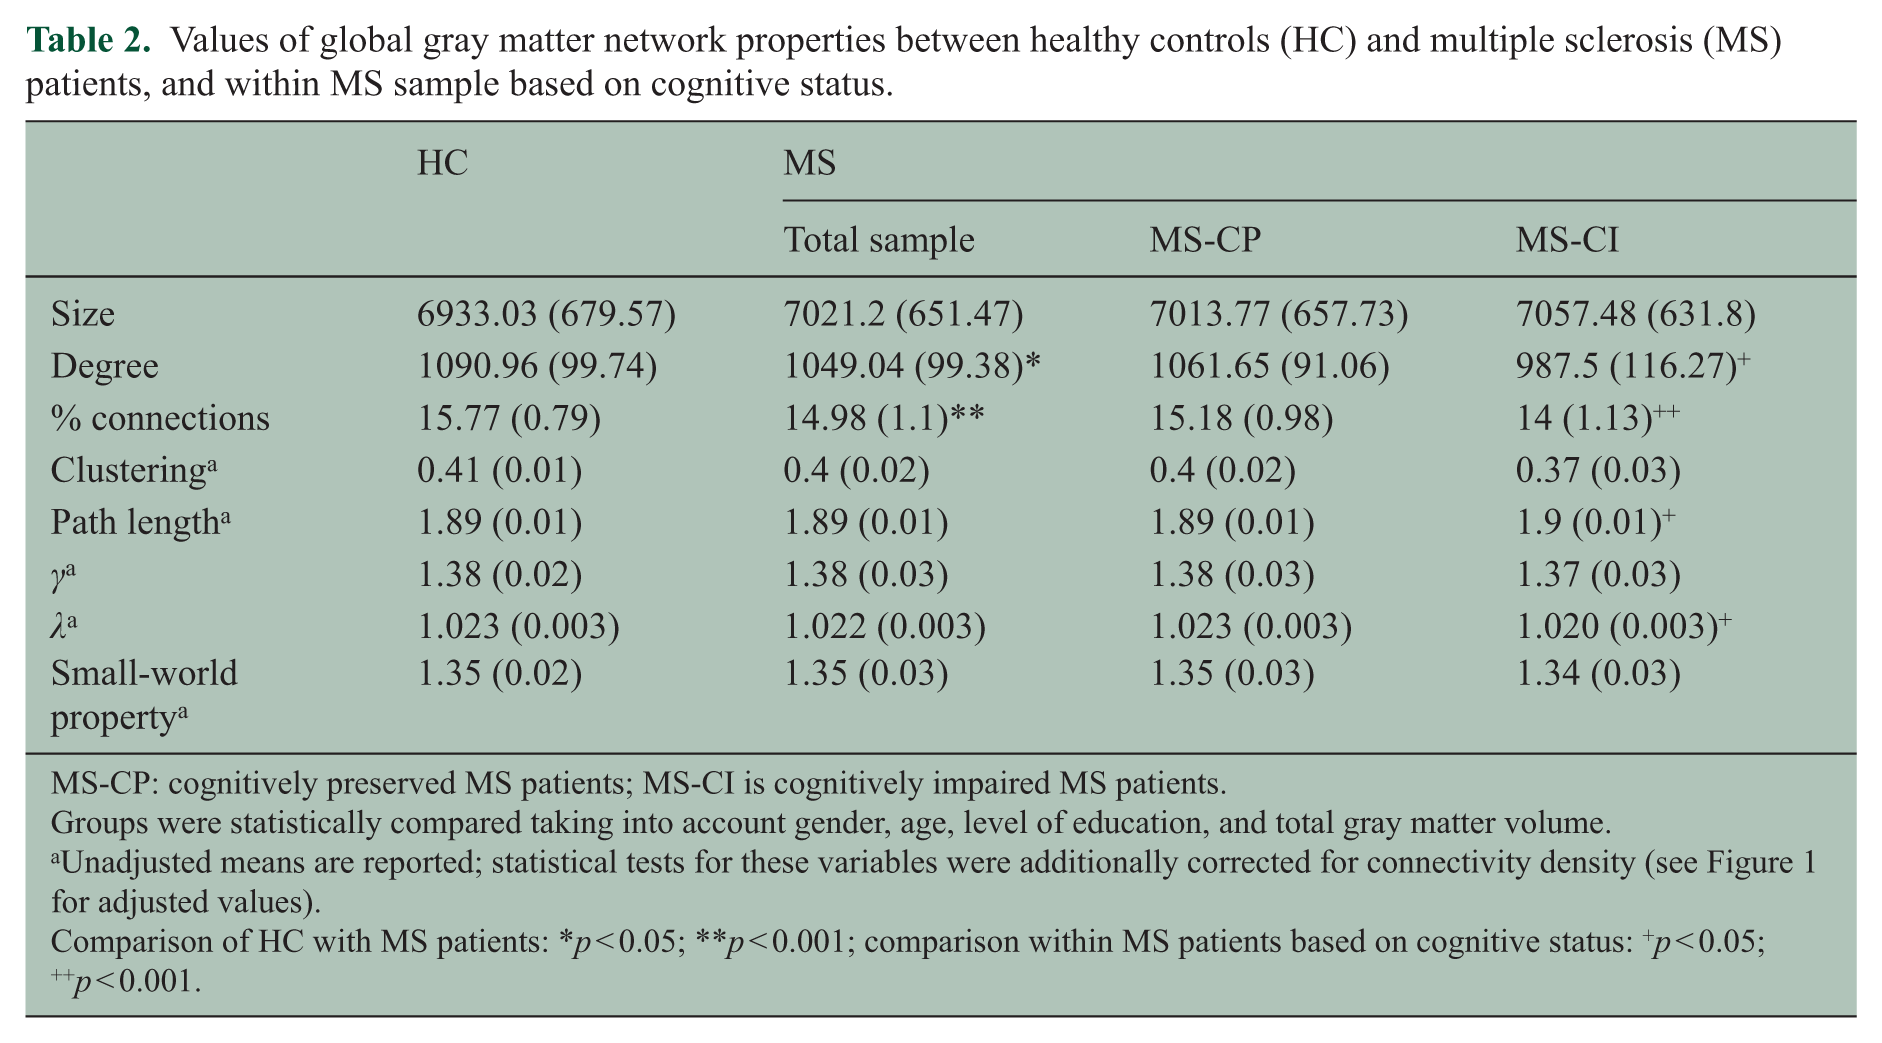
MS-CP: cognitively preserved MS patients; MS-CI is cognitively impaired MS patients.
Groups were statistically compared taking into account gender, age, level of education, and total gray matter volume.
Unadjusted means are reported; statistical tests for these variables were additionally corrected for connectivity density (see Figure 1 for adjusted values).
Comparison of HC with MS patients: *p < 0.05; **p < 0.001; comparison within MS patients based on cognitive status: +p < 0.05; ++p < 0.001.
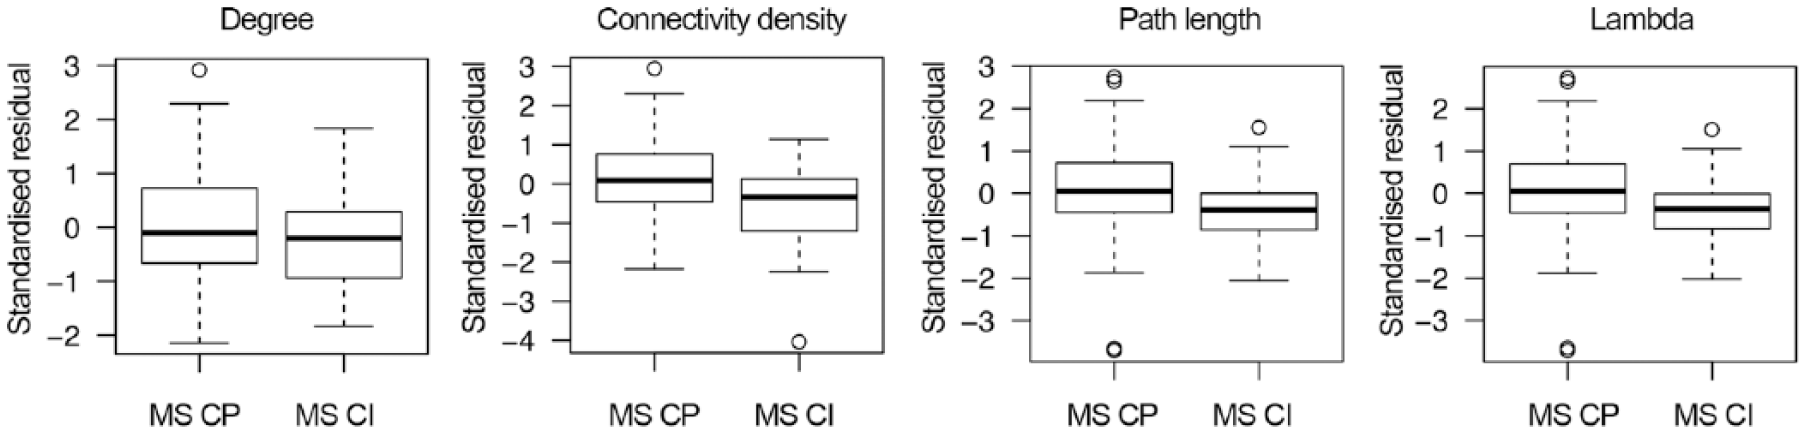
Global path length differences within multiple sclerosis (MS) groups after correction for connectivity density. Degree and connectivity density were lower in cognitively impaired MS patients (MS-CI) compared to the cognitively preserved group (MS-CP). To minimize the influence of the number of connections in the other network parameters, we applied an additional correction for the percentage of connections (i.e. connectivity density). After this correction, the standardized residual path length values were lower in MS-CI, and similar to the relationship observed for λ (i.e. characteristic path length normalized to path length values of 20 random graphs).
At a regional level, MS subjects showed compared to controls lower degree values in six AAL areas, affecting mostly temporal and occipital lobes, including bilateral hippocampus and left parahippocampal gyrus (Figure 2(a); Supplementary Table 2). Within the MS group, we observed that cognitively impaired subjects showed higher characteristic path length compared to cognitively normal MS subjects in several areas in the frontal (including the left anterior and middle cingulum), parietal and occipital lobes, as well as the thalamus (Figure 2(b); Supplementary Table 3).
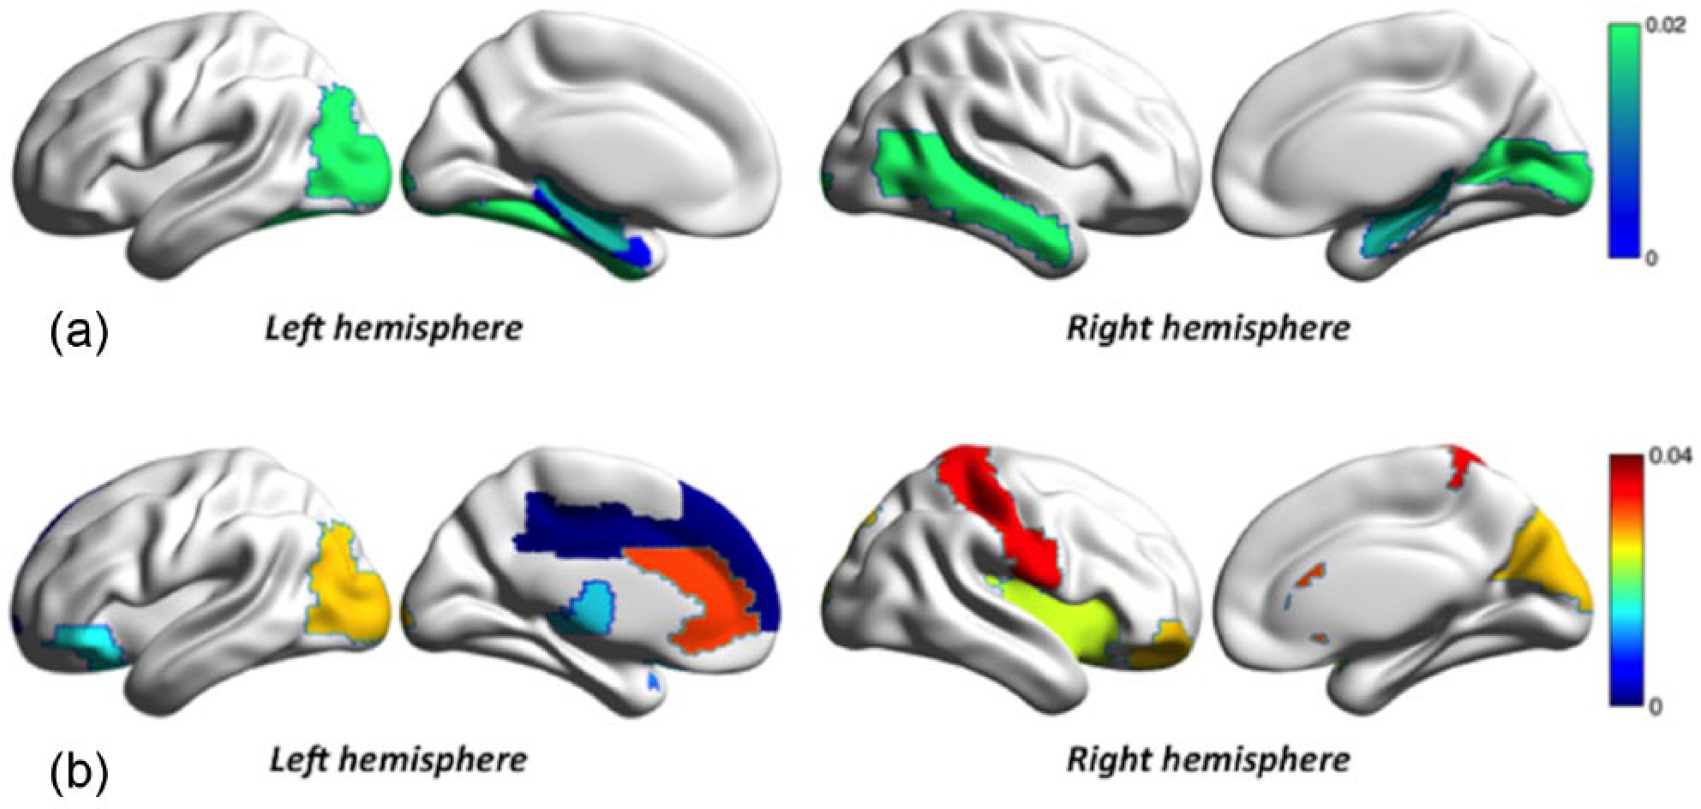
Regional network differences in multiple sclerosis (MS) groups: (a) the first row show gray matter regions with lower degree in MS patients compared to healthy controls, in a blue to green color scale (show in the top right) representing the p values after false discovery rate (p-FDR) correction and (b) the bottom row shows regions with significant different path length in MS-CI patients compared to MS-CP. The color scale (show in the right) represents the p-FDR values.
Correlations between global graph properties and cognitive performance
We further studied the relationship of gray matter network property values and cognitive functioning in six domains within the MS group. Table 3 shows that lower connectivity density values were related to worse global cognition, verbal memory, and information processing speed. After additional correction for connectivity density, lower clustering coefficient values still showed associations with worse average cognition, information processing speed, and working memory. Lower path length and λ values were associated with worse average cognition, executive functioning, and information processing speed. We reran analyses additionally correcting for EDSS, as this variable differed between the groups. The observed associations between network measures and cognitive functioning remained comparable, although of somewhat decreased strength (Supplementary Table 4). Variables selected by stepwise regression models included in addition to other traditional parameters gray matter graph parameters as predictors for cognitive functioning in several domains (Table 4).
Associations, β (standard deviation (SD)), between global gray matter network property values and global cognitive functioning and functioning in six cognitive domains in total group of multiple sclerosis (MS) patients.
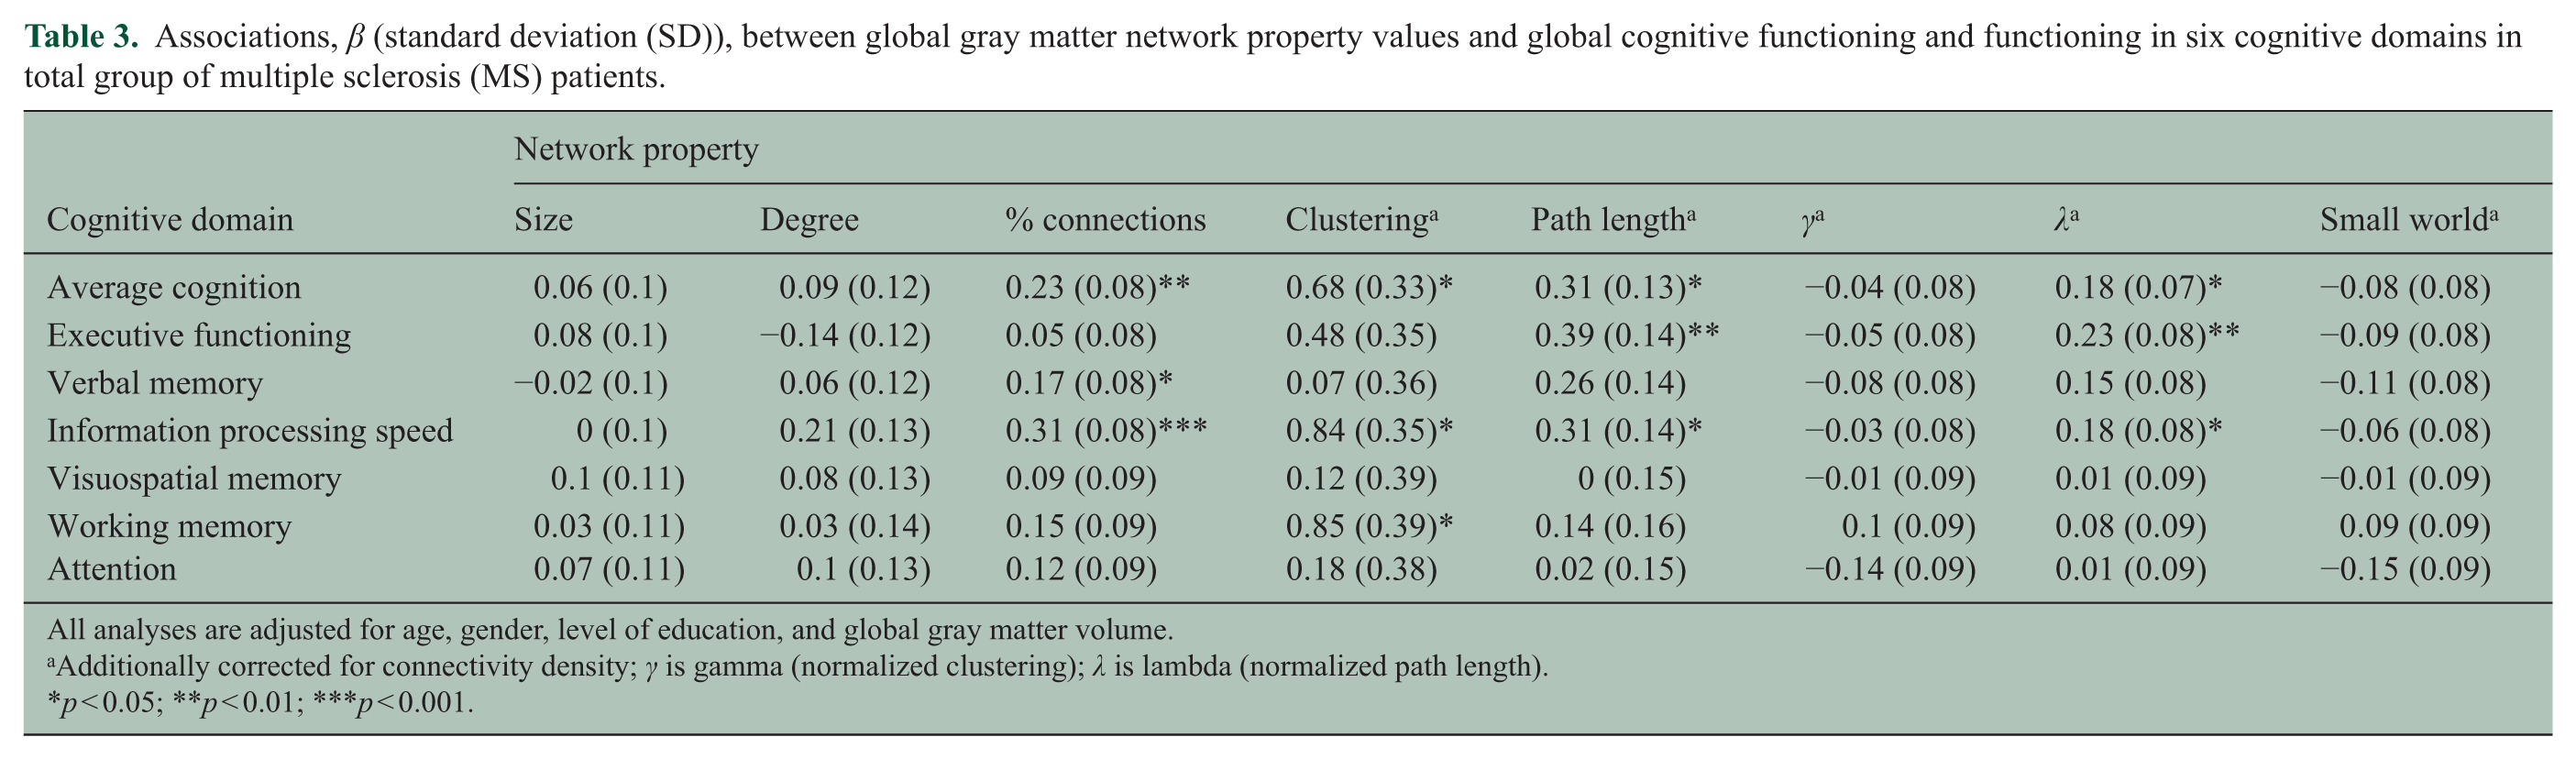
All analyses are adjusted for age, gender, level of education, and global gray matter volume.
Additionally corrected for connectivity density; γ is gamma (normalized clustering); λ is lambda (normalized path length).
p < 0.05; **p < 0.01; ***p < 0.001.
Predictors of neuropsychological performance and disability in multiple sclerosis (MS) patients.
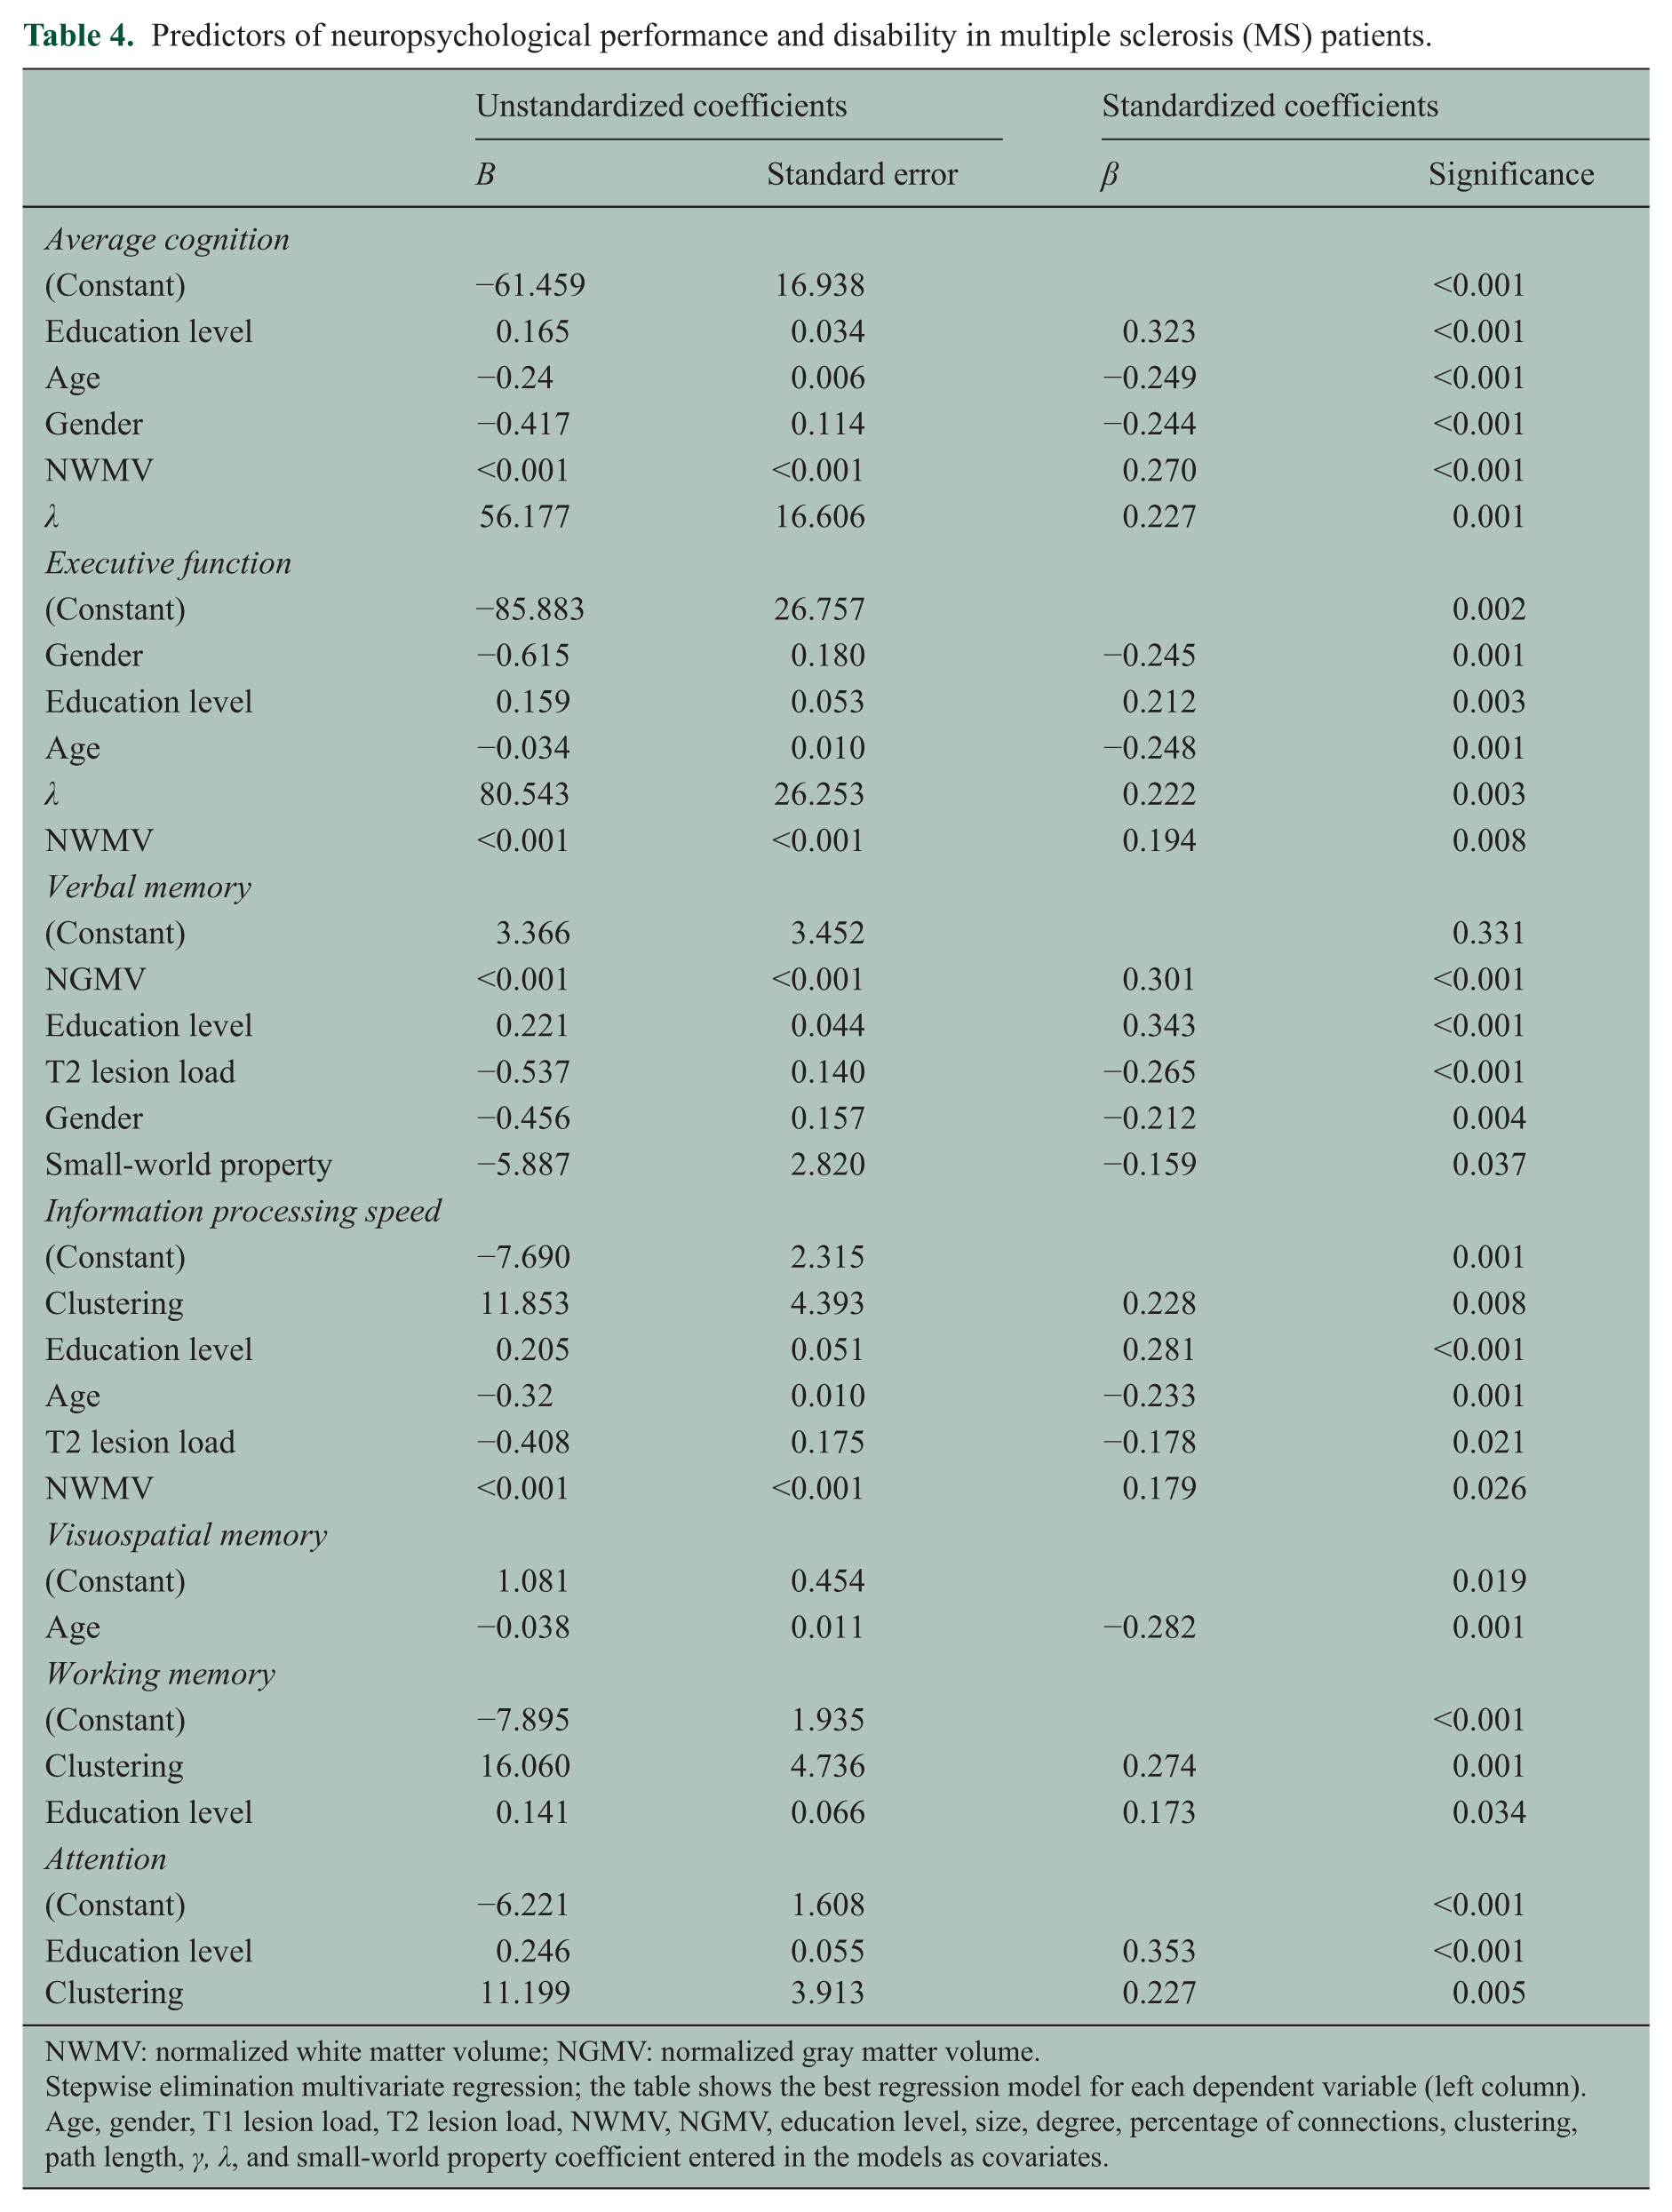
NWMV: normalized white matter volume; NGMV: normalized gray matter volume.
Stepwise elimination multivariate regression; the table shows the best regression model for each dependent variable (left column).
Age, gender, T1 lesion load, T2 lesion load, NWMV, NGMV, education level, size, degree, percentage of connections, clustering, path length, γ, λ, and small-world property coefficient entered in the models as covariates.
At a regional level lower clustering values in the superior frontal gyrus were correlated with worse average cognition (beta (standard error (SE)) = 0.41 (0.11); pfdr = 0.04). There was also a tendency of associations between path length in the middle cingulum (beta (SE) = –0.45 (0.13); pfdr = 0.07) and clustering in the right amygdala (beta (SE) = 0.28 (0.09); pfdr = 0.07) with average cognition. Worse information processing speed tended to be associated with path length in the left paracentral lobule (beta (SE) = –0.73 (0.23); pfdr = 0.07) (Supplementary Table 3).
Discussion
Our results show that single-subject gray matter networks in a large sample of MS subjects have fewer connections compared to controls, with the most pronounced differences shown by the cognitively impaired group. When comparing MS patients based on cognitive status, those with cognitive impairment showed lower values of clustering and λ, which is suggestive of a more random network topology. Several associations were found between lower values of λ and clustering with worse global cognitive functioning and the performance in executive function, verbal memory, information processing speed, working memory, and attention. At a regional level, changes in clustering and path length were most strongly associated with worse impaired global cognition in the right frontal superior gyrus, right amygdala, left middle cingulated, and left paracentral lobule. Gray matter parameters were associated with worse cognitive functioning, alongside with white and gray matter volumes, age, gender, education, and T2 lesion loads, suggesting that gray matter networks capture additional information on cognitive impairment in MS.
Our results are line with those reported by previous studies that observed lower local efficiency (i.e. comparable to lower clustering) and/or global efficiency (i.e. comparable to higher unnormalized characteristic path length) in MS compared to healthy control. 12 We observed that MS patients had lower degree and connectivity density values than controls, which suggests that higher path length values we observed might be a (trivial) consequence of the loss of connections. After correcting for connectivity density, we observed a lower path length values which are in line with observed lower λ values, which indicate that the path length observed were more similar those of random reference networks. Still, another structural network study observed increased γ and λ values in MS when compared to healthy controls, suggesting a more regular network topology. 13 Possibly, those results might be explained by the notion that MS and control networks were forced to have identical connectivity density values, which, when subjects differ in the amount of significant connections, can introduce bias to having more or less noise in the network. We further extend on previous research, by showing through our single-subject approach that a more random network organization is related to inter-individual worsening of cognitive functioning.
Some regions where we observed gray matter network disruptions in MS have been reported to be components of specific cognitive systems. For example, the regions where we identified the most significant loss of gray matter connections (i.e. lower degree) in MS patients, the bilateral fusiform gyrus and the mesial temporal-occipital region, have been implicated in visual, categorical, and semantic recognition. 26 In a previous study of functional connectivity in the same cohort of MS patients, we observed decreased eigenvector centrality (indicating lower connectivity) in ventral mesial temporal–occipital regions, which was also correlated with worse cognitive performance, suggesting a link between gray matter graphs disorganization and functional brain changes. 27
Studies using other imaging modalities, that is, functional MRI and diffusion tensor imaging (DTI), have also reported that networks become increasingly disorganized in MS and that these measures might be related to cognitive impairment. A previous study showed decreased resting-state activity in the anterior cingulate cortex in cognitively impaired MS patients, and this was correlated with lower PASAT scores, indicating poorer attention, concentration, and information processing speed. 28 The middle cingulum and superior frontal gyrus in particular were brain areas where we found the strongest correlation with worse cognitive performance. These regions have also been observed in a DTI studies to have important connections with other areas of the prefrontal cortex, thalami, and hippocampi. 29 Also, these regions have been implicated in executive function, attention, and working memory. 30 Our results seem to be in line with other DTI-based network studies in MS that have consistently reported higher path length and lower clustering values 31 in similar areas we observed, as well as loss of connections and communicability in frontal, temporal, occipital, and deep gray matter regions, affecting hippocampal, parahippocampal, anterior, and middle cingulum. 29
It has been proposed that the existence of cortical morphology correlations might arise as a result of tension forces exerted by axons pulling connected areas together, 32 a theory that is supported by previous studies showing that the cortical morphology correlations qualitatively match DTI connectivity maps.33,34 This hypothesis is further reinforced by the observations from a previous study showing that structural small-world efficiency disruption seems to be associated with increased white matter lesion volumes, 12 suggesting that gray matter reorganization might in part be dependent on transection of axons and subsequent retrograde degeneration. A recent study that assessed both DTI white matter and gray matter structural connectivity in MS, showed an increased modularity in both white matter and gray matter connectivity in early MS. 35 They reported increased intra-modular connectivity in the very early stages (0–18 months of disease duration) of MS. These inter-modular connections decreased in subjects with a longer disease duration, which seems to parallel our findings of increased unnormalized path length values in subjects with worse cognitive impairment that is suggestive of a disruption of long distance connections in more severe or long-standing disease. Future research should aim to further investigate in this sample of subjects how network measures of different imaging modalities are inter-related with each other, as well as the influence of lesion load on brain connectivity measures. 12
A potential limitation of our study is that we used a conservative definition of cognitive impairment, in order to include only subjects with more severe cognitive dysfunction in the cognitively impaired group, based on a previous study. 36 As a consequence, our cognitively impaired group was small, which could have contributed to an underestimation of our results. Nevertheless, we were able to identify signs of network disruption toward a more random organization, even after adjusting for gray matter volumes. Furthermore, effect sizes decreased after correcting for EDSS, even though motor performance was taken into account during the neuropsychological evaluations. Possibly a common network-based pathology may lead to cognitive and physical disability, which needs to be addressed in future research. Another limitation is the cross-sectional design of our study, which may not generalize to changes over time in clinical and cognitive functioning. Longitudinal studies are required to further investigate if these network properties are predictive of cognitive decline.
Conclusion
A more random topology in MS patients was related to cognitive impairment, explaining variance beyond conventional MRI and volumetric measures. This suggests that single-subject gray matter networks contain neuropathophysiological information that is associated with cognitive impairment in MS.
Footnotes
Acknowledgements
C.M.R. thanks São Paulo Research Foundation (FAPESP 2014/23299-4) for receiving a post-doc research grant.
Declaration of Conflicting Interests
The author(s) declared no potential conflicts of interest with respect to the research, authorship, and/or publication of this article.
Funding
The author(s) disclosed receipt of the following financial support for the research, authorship, and/or publication of this article: This study was supported by the Dutch MS Research Foundation, grant numbers 08-650, 13-820 and 14-358e, as well as a research grant from the São Paulo Research Foundation (FAPESP, grant number 2014/23299-4). FB is supported by the NIHR UCLH biomedical research centre. BMT received funding from the Memorabel Grant program of ZonMW (number 733050506).
References
Supplementary Material
Please find the following supplemental material available below.
For Open Access articles published under a Creative Commons License, all supplemental material carries the same license as the article it is associated with.
For non-Open Access articles published, all supplemental material carries a non-exclusive license, and permission requests for re-use of supplemental material or any part of supplemental material shall be sent directly to the copyright owner as specified in the copyright notice associated with the article.