
Abstract
Background:
Epstein–Barr virus (EBV) infection and vitamin D insufficiency are potentially interacting risk factors for multiple sclerosis (MS).
Objectives:
To investigate the effect of high-dose vitamin D3 supplements on antibody levels against the EBV nuclear antigen-1 (EBNA-1) in patients with relapsing-remitting multiple sclerosis (RRMS) and to explore any underlying mechanism affecting anti-EBNA-1 antibody levels.
Methods:
This study utilized blood samples from a randomized controlled trial in RRMS patients receiving either vitamin D3 (14,000 IU/day; n = 30) or placebo (n = 23) over 48 weeks. Circulating levels of 25-hydroxyvitamin-D, and anti-EBNA-1, anti-EBV viral capsid antigen (VCA), and anti-cytomegalovirus (CMV) antibodies were measured. EBV load in leukocytes, EBV-specific cytotoxic T-cell responses, and anti-EBNA-1 antibody production in vitro were also explored.
Results:
The median antibody levels against EBNA-1, but not VCA and CMV, significantly reduced in the vitamin D3 group (526 (368–1683) to 455 (380–1148) U/mL) compared to the placebo group (432 (351–1280) to 429 (297–1290) U/mL; p = 0.023). EBV load and cytotoxic T-cell responses were unaffected. Anti-EBNA-1 antibody levels remained below detection limits in B-cell cultures.
Conclusion:
High-dose vitamin D3 supplementation selectively reduces anti-EBNA-1 antibody levels in RRMS patients. Our exploratory studies do not implicate a promoted immune response against EBV as the underlying mechanism.
Introduction
The questions when and how multiple sclerosis (MS) starts have been captivating researchers for decades, and in search for the trigger of MS two environmental risk factors have consistently been identified: infection with the Epstein–Barr virus (EBV) and a poor vitamin D status.
EBV is a human γ-herpesvirus, which infects and latently persists in B lymphocytes. The majority of the general population (±90%) shows serologic signs of EBV infection, but virtually all MS patients are EBV-seropositive. 1 EBV infection occurs often asymptomatically during childhood, but primary infection after childhood can cause infectious mononucleosis. 2 The occurrence of infectious mononucleosis is associated with an increased risk of developing MS. 3 Moreover, higher antibody titers against EBV antigens have been found in MS, with the most dominant response against the Epstein–Barr nuclear antigen-1 (EBNA-1) (reviewed by Pender and Burrows 4 ). Higher anti-EBNA-1 immunoglobulin (Ig) G levels are associated with an increased risk of MS, 5 and in some but not all studies with a higher probability of conversion from clinically isolated syndrome (CIS) to clinically definite MS.6,7 Several but not all studies found associations between anti-EBNA-1 antibodies and neurological disability6–8 as well as disease activity and cortical atrophy on magnetic resonance imaging (MRI).7–10
A poor vitamin D status, reflected by low 25(OH)D-levels, has been associated with an increased risk of developing MS, 11 incidence of relapses, 12 neurological disability,13,14 and MRI activity. 15 This is thought to be the result of a lack of immune regulation by vitamin D. Experimental studies have demonstrated regulatory properties of vitamin D on several immune cells, including inhibition of IgG production by plasma cells. 16 Some small studies have shown that vitamin D3 supplementation may have beneficial effects on immune parameters in MS.17,18 Moreover, the SOLAR trial, a randomized controlled trial (RCT) on high-dose vitamin D3 supplementation as add-on therapy to interferon-beta, showed reduced MRI activity upon vitamin D3 supplementation in relapsing-remitting multiple sclerosis (RRMS) patients as compared to placebo. 19
Studies have shown that EBV infection and a poor vitamin D status are independently associated with MS risk. 20 However, data suggesting an interaction between these two factors are also available. Increased anti-EBNA-1 IgG and reduced 25(OH)D-levels have been observed prior to MS onset. 21 Also, Wergeland et al. 22 recently showed a seasonal fluctuation in anti-EBNA-1 IgG levels in RRMS patients, inversely to the fluctuation of 25(OH)D-levels. Furthermore, we previously found that 12 weeks of high-dose vitamin D3 supplementation reduced anti-EBNA-1 IgG levels in RRMS. 23 In a recent RCT, vitamin D3 supplements likewise selectively reduced anti-EBNA-1 IgG. 24 We attempted to replicate these findings and to study the potential underlying mechanism by performing several exploratory studies using samples collected from a recent RCT with vitamin D3 supplements in RRMS. In addition to the influence of vitamin D on the EBV-specific antibody response, we assessed whether the viral load in leukocytes was affected, potentially by increased cytotoxic responses, and examined in vitro effects of vitamin D on antigen-specific antibody production.
Methods
Study and subject details
The effect of vitamin D3 supplementation on anti-EBNA-1 IgG levels was studied as a secondary outcome measure of the Dutch SOLARIUM, a sub-study of the SOLAR trial (NCT01285401). Detailed study procedures are described elsewhere.18,19 Participants were patients with RRMS according to the McDonald criteria, 25 aged 18–55 years and treated with interferon-β1α (Rebif®, Merck, Geneva, Switzerland), who had a first clinical event in the previous 5 years and active disease, but no relapse 30 days before inclusion. Patients were randomized and allocated to a placebo or vitamin D3 group. Patients in the vitamin D3 group received cholecalciferol drops (Vigantol Oil, Merck) 7000 IU/day in the first 4 weeks, followed by 14,000 IU/day up to week 48. To study the in vitro effect of vitamin D on total and anti-EBNA-1 IgG production, blood samples were obtained from EBV-seropositive healthy volunteers (HVs). Written informed consent was acquired and the study was approved by the Ethical Committee METC-Z (Heerlen, the Netherlands).
Vitamin D and antibody measurements
From SOLARIUM participants, blood was drawn before and after a 48-week study period for measurements of several analytes, including serum 25(OH)D-levels. 18 Levels of IgG against the EBV antigens EBNA-1 and viral capsid antigen (VCA) and against the cytomegalovirus (CMV) were measured in plasma samples, which were stored at −20°C until analyses. Tests were performed using the quantitative LIAISON® EBNA, VCA, or CMV IgG assays (DiaSorin, Saluggia, Italy), which use chemiluminescence immunoassay technology. Results ⩾22 U/mL were considered positive. EBV seropositivity of HVs was assessed with the VIDAS® test for qualitative detection of anti-EBNA-1 IgG (Biomerieux, Marcy-l’Étoile, France). Samples were considered positive in case of sample/standard indexes ⩾0.21.
Cell isolation
Peripheral blood mononuclear cells (PBMC) were isolated from venous blood as described previously. 18 PBMC of SOLARIUM participants were partly stored at −80°C in TRIzol® (Invitrogen, Paisley, Scotland, UK) until use for viral load assessments and partly stored in liquid nitrogen until use for detection of EBV-specific CD8+ T cells. PBMC of HVs were used for further B cell purifications, using an EasySep™ human B cell enrichment kit (Stemcell technologies, Vancouver, Canada) for negative selection of B lymphocytes. B cells were >98% pure in all but one (86.6%) of the suspensions.
Quantification of EBV viral loads with qPCR
DNA was extracted from 200 µL of the TRIzol samples, containing up to 2.5 × 10⁶ PBMC in 1 mL, using the MagnaPure 96 DNA and Viral NA small-volume kit (Roche Diagnostics, Mannheim, Germany) and the Pathogen Universal 200 protocol. The polymerase chain reaction (PCR) protocol and use of controls was described previously; 26 for this study, an ABI 7900 real-time quantitative PCR (RT-qPCR) apparatus (Applied Biosystems, Foster City, CA, USA) was used. The detection range of this EBV DNA PCR was 200 – 1 × 10⁶ copies/mL. Since the number of PBMC varied per sample, results are calculated and presented as EBV copies per 1 × 10⁶ PBMC or 1 × 10⁵ B cells as described in the legend of Table 2. In addition, relative expression to the reference gene HPRT was analyzed. Hereto, RNA was extracted from the remainder of the TRIzol samples. Quantity and quality control was performed using a spectrophotometer (ND-2000, Nanodrop technologies, Rockland, DE, USA). Reverse transcription of total RNA was performed with the IScript cDNA Synthesis kit (BioRad Laboratories BV, Veenendaal, the Netherlands), and primers for HPRT (fw: 5′-GACCAGTCAACAGGGGACAT-3′, rv: 5′-CCTGACCAAGGAAAGCAAAG-3′) were obtained from Roche Diagnostics (Almere, the Netherlands). RT-qPCR was performed on a BioRad CFX96 (CFX Manager software 3.1), using IQ SYBR Green Supermix (BioRad). Samples contained 4 ng cDNA and were run in duplicates.
Detection of EBV-specific CD8+ T cells
An enzyme-linked immunospot (ELISPOT) assay detecting EBV-specific activated CD8+ T cells secreting IFN-γ was used to quantify the EBV-specific CD8+ T cell response. 27 PBMC were thawed and 1–2 × 10⁵ cells were incubated in triplicates in the presence of pools of CD8+-restricted EBV peptide epitopes (1 mg/mL). Peptide-free medium and phytohemagglutinin (PHA; 5 mg/mL) served as negative and positive controls, respectively. Responses were expressed as the mean number of spot-forming cells (SFC) of the three replicates per 106 PBMC. The assay was considered experimentally valid if, in the presence of the stimulating peptide, SFC was >50/106 cells and at least threefold higher than in the negative control. Background levels were subtracted from the data before analysis.
B cell cultures
The purified B cells from HVs were cultured in 96-well plates at 1 × 10⁶ cells/well in 200 µL culture medium (86% RPMI 1640 medium, 10% fetal bovine serum (FBS), 2% penicillin–streptomycin, 1% sodium pyruvate, 1% non-essential amino acids) alone or supplemented with 0.1 µM CpG oligodeoxynucleotide 2006 (Invivogen, San Diego, CA, USA) with or without 10 nM 1,25(OH)2D3 (Sigma Aldrich, Saint Louis, MO, USA). After 7 days, supernatants were collected and stored at −20°C until analysis of (anti-EBNA-1) IgG.
Total IgG and anti-EBNA-1 IgG in culture supernatants
Enzyme-linked immunosorbent assays (ELISA) were performed to quantify the amount of total and anti-EBNA-1 IgG in culture supernatants. For the total IgG assay, 28 human serum with quantified IgG levels by nephelometry (Immage 800, Beckman Coulter, Mijdrecht, The Netherlands) was used as standard. The anti-EBNA-1 IgG ELISA was performed using a commercially available kit with recombinant EBNA-1 precoated plates (88 kDa, sf-9 baculovirus; IBL International, Hamburg, Germany). Additionally, a qualitative line blot (Euroline EBV profile 2, Euroimmun, Luebeck, Germany) was used for the detection of antibodies against EBV antigens, including EBNA-1 and VCA.
Statistical analyses
Due to non-normal data distribution, median values with 25th–75th percentile ranges (Q1–Q3) are provided for continuous data. Group differences were analyzed using the Mann–Whitney U test and within-group differences between week 0 (T0) and week 48 (T1) with the Wilcoxon signed-rank test. p-values <0.05 were considered statistically significant. Statistical analyses were performed using SPSS software version 23.0 (IBM Corp., Armonk, NY, USA).
Results
Patient characteristics and vitamin D3 supplementation effectiveness
In all, 53 RRMS patients completed the SOLARIUM study (F/M = 35/18; mean age = 37.5 (±8.2) years; median disease duration = 7.3 (4.4–12.0) months; mean 25(OH)D = 56.0 (±24.5) nmol/L), of which 30 were in the vitamin D3 group and 23 in the placebo group (Supplementary Table S1). After 48 weeks, an increase in serum 25(OH)D-levels was observed in the vitamin D3 group (60 (38–85) to 231 (162–250) nmol/L; p < 0.001), and not in the placebo group (54 (43–63) to 60 (36–85) nmol/L; p = 0.380). 18
Vitamin D3 supplementation selectively reduces anti-EBNA-1 IgG levels
All patients were EBV-seropositive (92% were positive for EBNA-1, 98% were positive for VCA, and none were negative for both), whereas 38% of the patients were CMV-seropositive. No significant differences in IgG levels against EBNA-1, VCA, and CMV were found between the groups at T0 or T1 (data not shown). However, anti-EBNA-1 IgG levels were significantly reduced at T1 compared to T0 in the vitamin D3 group (p < 0.001), but not in the placebo group (p = 0.626). No significant change between T1 and T0 was instead present for anti-EBV VCA and anti-CMV IgG levels in either group (Table 1). Moreover, when comparing the T1–T0 differences in anti-EBNA-1 IgG between the groups, the median difference was significantly larger in the vitamin D3 group (−88 (−397 to −5) U/mL) than in the placebo group (0 (−66 to +48) U/mL; p = 0.023; Figure 1). These effects remained unchanged when outliers with very high anti-EBNA-1 IgG levels were removed from the analysis (not shown). Within the size limits of the patient cohort, further analyses on the patients in the vitamin D3 group with the most pronounced decreases of anti-EBNA-1 IgG did not reveal differences in 25(OH)D levels, EBV viral load, or EBV-specific CD8+ T cell response (see below).
Plasma IgG levels of the patients with RRMS.
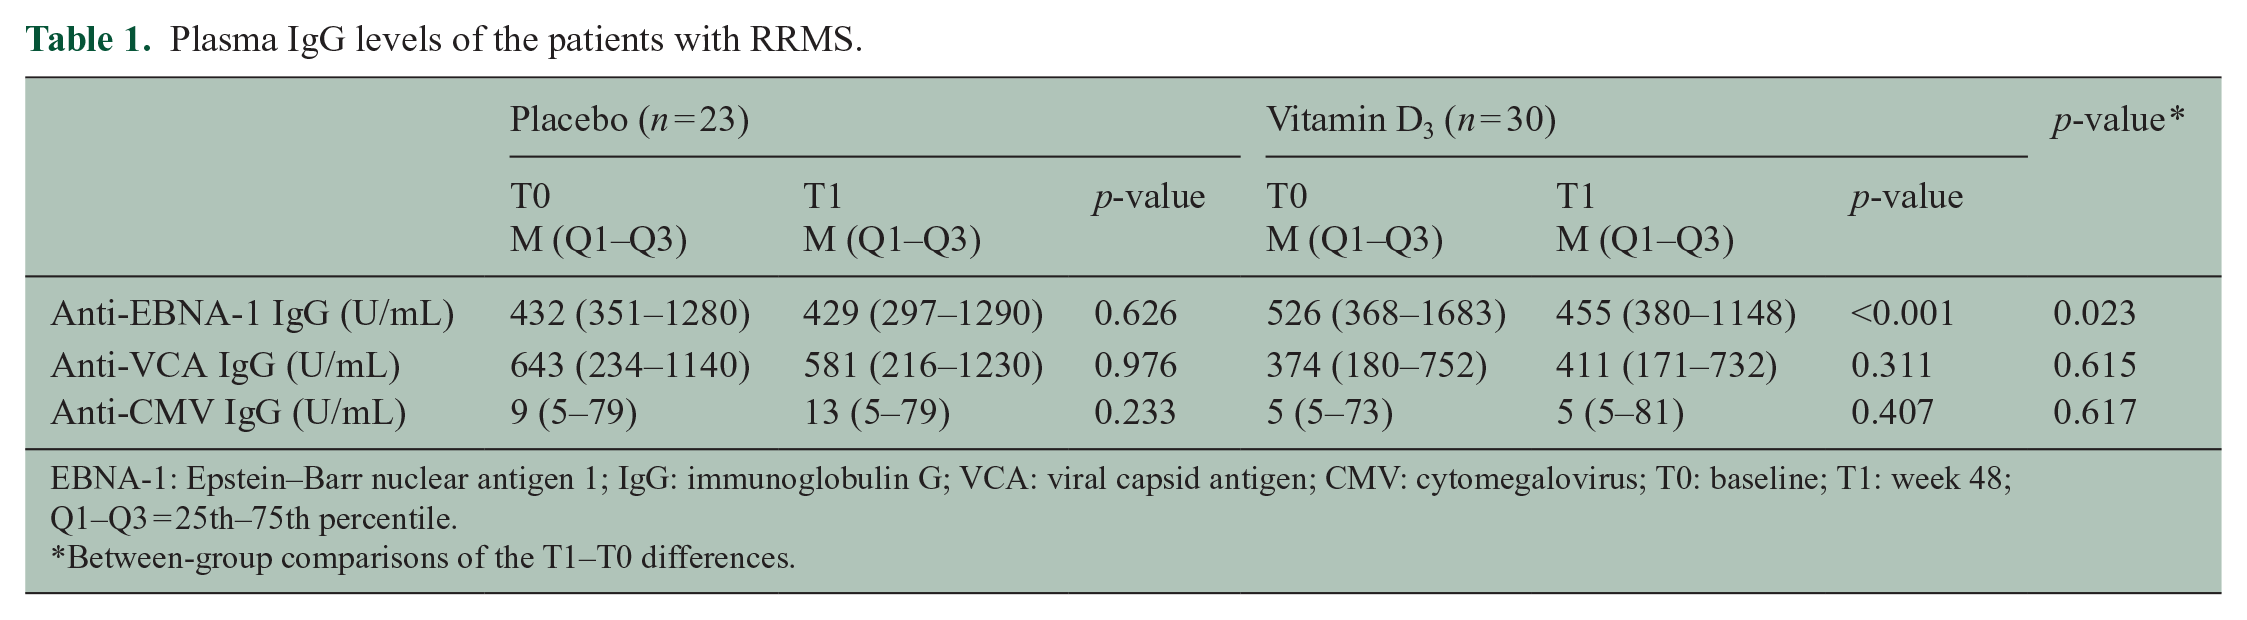
EBNA-1: Epstein–Barr nuclear antigen 1; IgG: immunoglobulin G; VCA: viral capsid antigen; CMV: cytomegalovirus; T0: baseline; T1: week 48; Q1–Q3 = 25th–75th percentile.
Between-group comparisons of the T1–T0 differences.
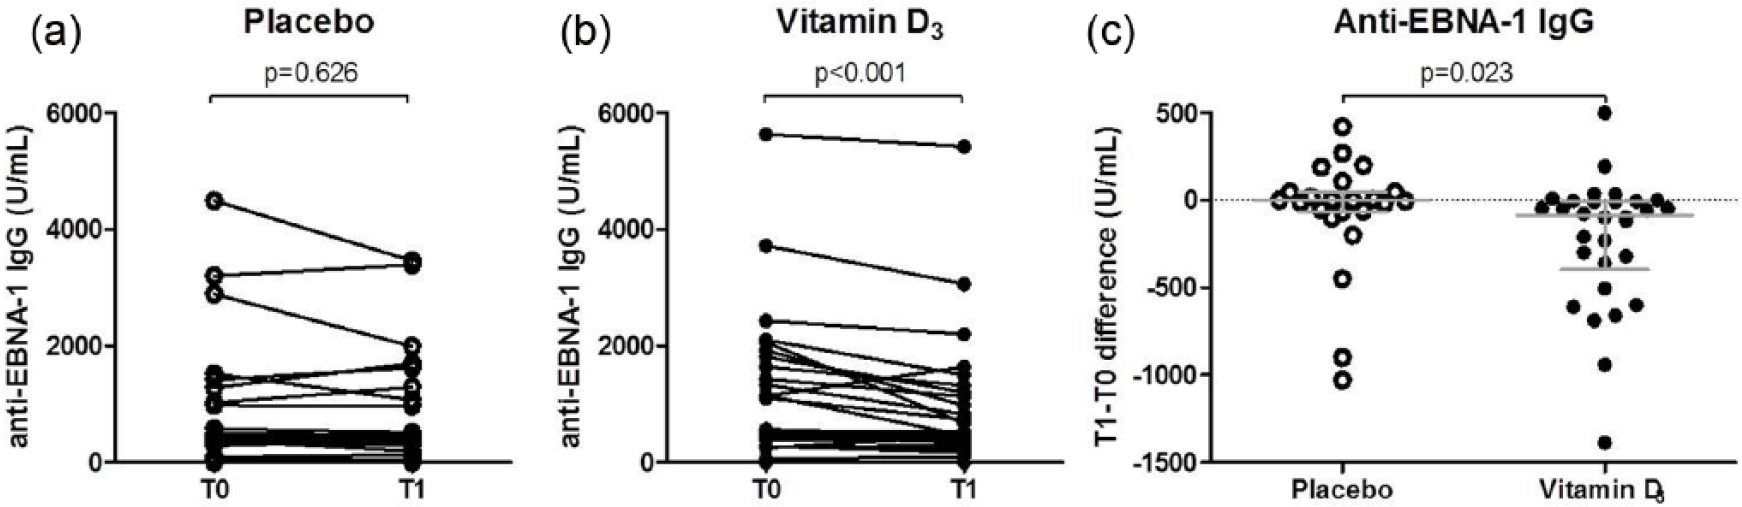
Anti-EBNA-1 IgG levels of patients with RRMS before and after treatment. (a) Within-group comparisons at T0 and T1 in the placebo group (n = 23), (b) within-group comparisons at T0 and T1 in the vitamin D3 group (n = 30), and (c) between-group comparisons of the anti-EBNA-1 IgG level differences between T1 and T0. Gray lines indicate the medians with interquartile ranges.
Vitamin D3 supplementation does not influence EBV viral load in PBMC or EBV-specific CD8+ T cells
We further explored the potential mechanisms underlying the selective reduction of anti-EBNA-1 IgG upon vitamin D3 supplementation. We hypothesized that vitamin D could reduce antigens available to trigger anti-EBNA-1 antibody responses by promoting eradication of EBV-infected cells (as measured by EBV viral load in PBMCs) via an increase in the cytotoxic T cell response against EBV (as measured by the number of EBV-specific CD8+ T cells). However, median EBV DNA copies in PBMC samples did not significantly change over 48 weeks in either of the groups (Table 2). PBMCs from 15 vitamin D3-supplemented and 15 placebo-administered patients were available for detection of activated EBV-specific CD8+ T cells secreting IFN-γ. We found that 11 vitamin D3 and 9 placebo patients were positive responders to the EBV peptide pool. The median amount of SFC/106 PBMC was similar for both groups at both time points. Also, no significant changes were found within groups (Figure 2). Therefore, we found no evidence supporting an effect of vitamin D supplements on the clearance of EBV in the circulation.
Between and within group comparisons for EBV load.
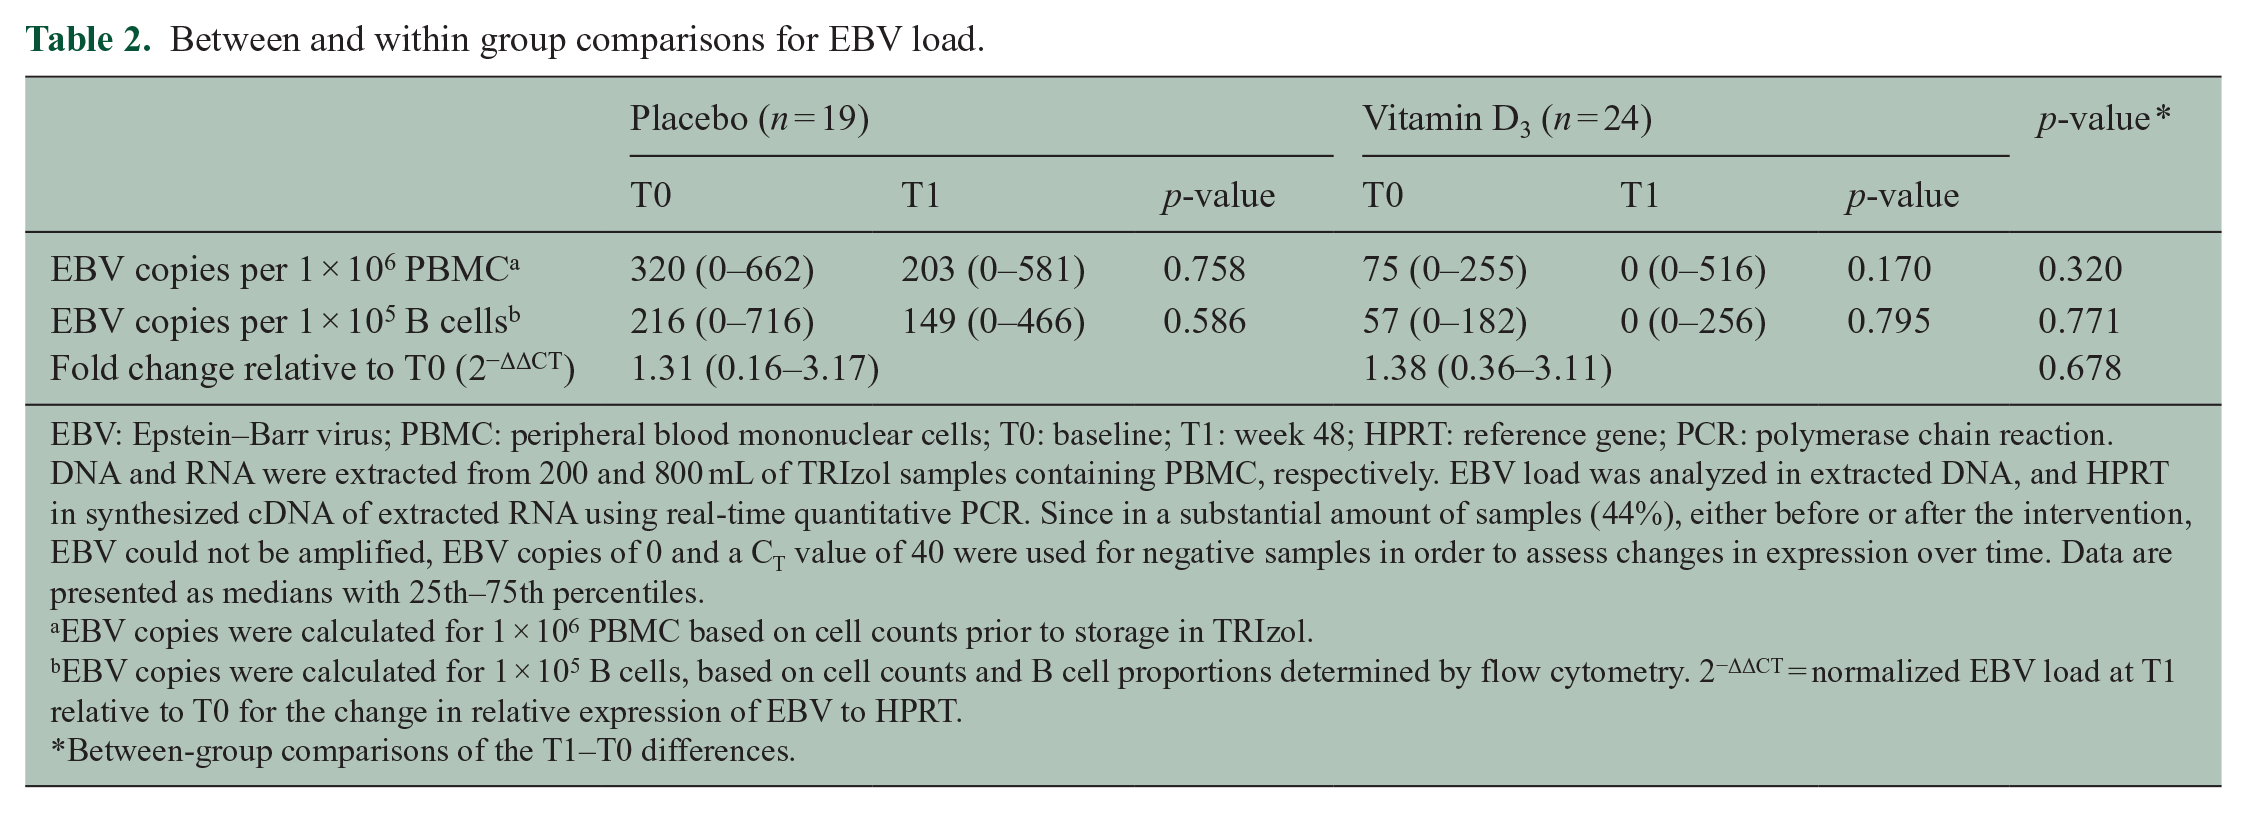
EBV: Epstein–Barr virus; PBMC: peripheral blood mononuclear cells; T0: baseline; T1: week 48; HPRT: reference gene; PCR: polymerase chain reaction.
DNA and RNA were extracted from 200 and 800 mL of TRIzol samples containing PBMC, respectively. EBV load was analyzed in extracted DNA, and HPRT in synthesized cDNA of extracted RNA using real-time quantitative PCR. Since in a substantial amount of samples (44%), either before or after the intervention, EBV could not be amplified, EBV copies of 0 and a CT value of 40 were used for negative samples in order to assess changes in expression over time. Data are presented as medians with 25th–75th percentiles.
EBV copies were calculated for 1 × 10⁶ PBMC based on cell counts prior to storage in TRIzol.
EBV copies were calculated for 1 × 10⁵ B cells, based on cell counts and B cell proportions determined by flow cytometry. 2−ΔΔCT = normalized EBV load at T1 relative to T0 for the change in relative expression of EBV to HPRT.
Between-group comparisons of the T1–T0 differences.
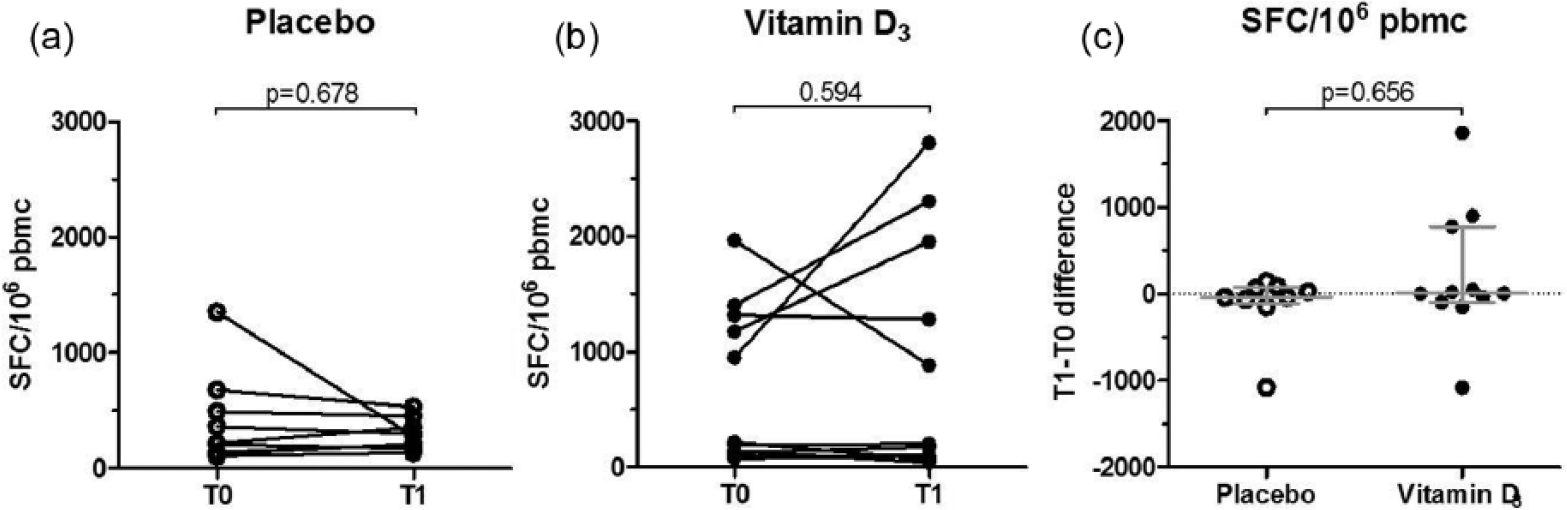
EBV-specific CD8+ T cells of patients with RRMS before and after treatment. ELISPOT assays were performed to detect activated EBV-specific CD8+ T cells secreting interferon-γ. Peripheral blood mononuclear cells (PBMC) of the patients with RRMS were thawed and cultured at 1–2 × 10⁵ cells per well in the presence of pools of CD8-restricted EBV peptides at a concentration of 1 mg/mL. The amount of activated cells is represented by SFC/106 PBMC. (a) Within-group comparisons at T0 and T1 in the placebo group (n = 9), (b) within-group comparisons at T0 and T1 in the vitamin D3 group (n = 11), and (c) between-group comparisons of the differences in SFC/106 PBMC between T1 and T0. Gray lines indicate the medians with interquartile ranges.
Vitamin D reduces total IgG secretion in vitro
Alternatively, antibody secretion of anti-EBNA-1 IgG itself may be affected directly by vitamin D. Therefore, we performed an in vitro study, aiming to compare the anti-EBNA-1 IgG/total IgG indexes. During 7 days, B cells of EBV-seropositive HVs (n = 12; F/M = 9/3; median age = 28.9 (21.5–34.6) years; median anti-EBNA-1 IgG index (range) = 8.38 (0.43–9.74)) were cultured and stimulated with CpG in the presence or absence of 1,25(OH)2D3. Supernatants of conditions with 1,25(OH)2D3 showed a significant median reduction of 48.2% (Q1–Q3 = 43.2%–53.9%; p = 0.002) in total IgG levels compared to the ones without 1,25(OH)2D3. However, in our assays anti-EBNA-1 IgG levels could not be detected in any of the culture supernatants, neither by ELISA nor by line blot (data not shown).
Discussion
This study confirmed a selective reduction of anti-EBNA-1 IgG levels after 48 weeks vitamin D3 supplementation in RRMS patients. Furthermore, we explored mechanisms by which vitamin D may affect the anti-EBNA-1 antibody response. Results with respect to the in vitro effects of vitamin D on antibody responses were not conclusive, but we found no ex vivo evidence that the number of EBV-specific CD8+ cytotoxic T cells and the EBV viral load in PBMC is affected by vitamin D3 supplements.
Likewise, Røsjø et al. 24 showed that 48 weeks of vitamin D3 supplementation reduced anti-EBNA-1 antibody levels in MS, but not anti-VCA, anti-CMV, or anti-Varicella Zoster virus (VZV) antibody levels. These and our current results are comparable to those of our earlier pilot study. 23 In this pilot study, we found a decrease of anti-EBNA-1 IgG, but not of total IgG levels or any change in B cell differentiation profile in general after 12-week high-dose vitamin D3 supplements in RRMS.23,29 The consistent findings of specific anti-EBNA-1 IgG reductions upon vitamin D supplementation in (early) MS may be clinically relevant, especially since several but not all studies showed that higher anti-EBNA-1 IgG levels predict a higher risk of active MRI-lesions in RRMS.7–10 Therefore, it is tempting to speculate that the reduction in anti-EBNA-1 IgG is instrumental for the vitamin D-associated reduction of active MRI-lesions in the SOLAR trial. 19 This radiological improvement in SOLAR may be the result of optimization of vitamin D-related immunological regulatory mechanisms, which either affects the anti-EBNA-1 serologic response to EBV or in which the immune response to EBV serves as a critical effector component. We think several mechanisms may explain the reduction in anti-EBNA-1 IgG by vitamin D, which may be antigen-specific in essence or not.
First, vitamin D may specifically affect the extent of EBNA-1 antigen expression (i.e. the trigger of anti-EBNA-1 antibody responses) by inducing a better elimination of EBV-infected B cells. Indeed, EBV viral load correlated positively with anti-EBNA-1 titers. 30 Possibly, vitamin D increases the EBV-specific CD8+ T cell response against latently infected B cells, because vitamin D has been reported to increase CD8+ T cell proportions. 4 Alternatively, vitamin D may directly target and impair viral replication in EBV-infected cells, which could explain why EBV has evolved with a protein (i.e. EBNA-3) that is able to block the vitamin D receptor. 31 Nonetheless, general anti-viral effects of vitamin D have been proposed, probably via induction of peptides disrupting viral envelopes (i.e. cathelicidin). 32 To explore these hypotheses, with the limitation of the available material, we quantified the number of EBV-specific CD8+ T cells and the EBV viral load in PBMC, but in neither of them we observed a difference between vitamin D-treated and placebo-treated patients. However, our sample sizes may have been too small to detect effects of vitamin D. Also, effects of vitamin D in lymphoid tissue may not be reflected by analysis of PBMC.
A second specific mechanism could be a direct effect of vitamin D on anti-EBNA-1 IgG secretion, which could also reflect an inhibition of plasma cell formation by vitamin D. 16 Therefore, we explored the in vitro effect of vitamin D on the anti-EBNA-1 IgG/total IgG index. In line with the results of Chen et al., 16 1,25(OH)2D3 clearly reduced total IgG production, but we could not detect any anti-EBNA-1 IgG with our assays. Sorting and cloning of anti-EBNA-1-specific B cells, as well as of already differentiated antigen-specific plasma cells, may be necessary to better study possible effects of vitamin D on the differentiation and IgG secretion of antigen-specific cells.
Interestingly, as in vitro but not in vivo total IgG levels are influenced by vitamin D,23,29 there is a difference in the in vitro and in vivo effects of vitamin D on IgG production. As a third scenario, we earlier speculated that the increased anti-EBNA1 IgG levels in MS may be the result of the generation of short-lived plasma cells in ectopic lymphoid follicles in the meninges of MS patients.33,34 The obtained materials in SOLARIUM were insufficient to address this hypothesis, which would rather require studies in complex (animal) models. Additionally, these hypotheses would predict the absence of an anti-EBNA-1 IgG reduction by vitamin D supplements in EBV-exposed healthy controls.
Fourth, the reduction of anti-EBNA-1 IgG upon vitamin D3 supplementation may not be antigen-specific, but rather represents a better control of inflammation in general. Reduced B cell activation in lymphoid tissue will result in reduced anti-EBNA-1 antibody responses, since the EBNA-1 protein is only expressed during mitosis (proliferation) of EBV-infected B cells. 4
In conclusion, our results confirm that high-dose vitamin D3 supplementation selectively reduces anti-EBNA-1 IgG levels in RRMS. Reflection of our data on several earlier studies on anti-EBNA-1 IgG levels and MS MRI outcomes suggests that this may be a clinically relevant effect. This observation may either support an interaction between vitamin D and EBV in MS or reflect a better control of inflammation by vitamin D in general. Additional studies are necessary to further elucidate the underlying mechanism of this effect, which may be multiple and complex. These studies should probably use (animal) models enabling assessment of local effects within lymphoid tissue and the central nervous system (CNS).
Footnotes
Acknowledgements
We are grateful to the patients for their participation. Also, we thank Stefan Neys, Yassin Jabri, Ruud Theunissen, Inge van Loo; S. Frequin (St. Antonius Hospital, Nieuwegein, the Netherlands), F. Verheul (Groene Hart Hospital, Gouda, the Netherlands), and J. Samijn (Maasstad Hospital, Rotterdam, the Netherlands); and the MS nurses of the participating centers for their contributions to the study.
Declaration of Conflicting Interests
The author(s) declared the following potential conflicts of interest with respect to the research, authorship, and/or publication of this article: L.R., A.-H.M., A.M., I.K., G.D., and J.D. report no disclosures. R.D.P. has served on scientific advisory boards and/or received funding for travel or speaker honoraria from Biogen, Merck, Novartis, Roche, and Sanofi-Genzyme. J.K.’s institution (University Hospital Basel) received and used exclusively for research support: consulting fees from Genzyme, Novartis, Protagen AG, Roche, and Teva; speaker fees from the Swiss MS Society, Biogen, Novartis, Roche, and Genzyme; travel expenses from Genzyme, Merck, Novartis, and Roche; and grants from ECTRIMS Research Fellowship Programme, University of Basel, Swiss MS Society, Swiss National Research Foundation, Bayer AG, Biogen, Genzyme, Merck, Novartis, and Roche. S.R. was a full-time employee at Evidera at the time of this study. J.S. received lecture and/or consultancy fees from Biogen, Merck, Sanofi-Genzyme, and Novartis. R.H. received honoraria for lectures and advisory boards and Research Grants from Merck, Biogen, Sanofi-Genzyme, Novartis, and Teva.
Funding
The author(s) disclosed receipt of the following financial support for the research, authorship, and/or publication of this article: The SOLARIUM study was supported by Merck and Nationaal MS Fonds Nederland.
References
Supplementary Material
Please find the following supplemental material available below.
For Open Access articles published under a Creative Commons License, all supplemental material carries the same license as the article it is associated with.
For non-Open Access articles published, all supplemental material carries a non-exclusive license, and permission requests for re-use of supplemental material or any part of supplemental material shall be sent directly to the copyright owner as specified in the copyright notice associated with the article.