
Abstract
Low-contrast letter acuity (LCLA) has emerged as the leading outcome measure to assess visual disability in multiple sclerosis (MS) research. As visual dysfunction is one of the most common manifestations of MS, sensitive visual outcome measures are important in examining the effect of treatment. Low-contrast acuity captures visual loss not seen in high-contrast visual acuity (HCVA) measurements. These issues are addressed by the MS Outcome Assessments Consortium (MSOAC), including representatives from advocacy organizations, Food and Drug Administration (FDA), European Medicines Agency (EMA), National Institute of Neurological Disorders and Stroke (NINDS), academic institutions, and industry partners along with persons living with MS. MSOAC goals are acceptance and qualification by regulators of performance outcomes that are highly reliable and valid, practical, cost-effective, and meaningful to persons with MS. A critical step is elucidation of clinically relevant benchmarks, well-defined degrees of disability, and gradients of change that are clinically meaningful. This review shows that MS and disease-free controls have similar median HCVA, while MS patients have significantly lower LCLA. Deficits in LCLA and vision-specific quality of life are found many years after an episode of acute optic neuritis, even when HCVA has recovered. Studies reveal correlations between LCLA and the Expanded Disability Status Score (EDSS), Multiple Sclerosis Functional Composite (MSFC), retinal nerve fiber layer (RNFL) and ganglion cell layer plus inner plexiform layer (GCL + IPL) thickness on optical coherence tomography (OCT), brain magnetic resonance imaging (MRI), visual evoked potential (VEP), electroretinogram (ERG), pupillary function, and King-Devick testing. This review also concludes that a 7-point change in LCLA is clinically meaningful. The overall goal of this review is to describe and characterize the LCLA metric for research and clinical use among persons with MS.
Keywords
Historical perspective
In the 1990s, the multiple sclerosis (MS) Clinical Outcome Assessments Task Force recommended a multidimensional composite outcome measure consisting of simple tests of walking, manual dexterity, and cognition, which is termed as the Multiple Sclerosis Functional Composite (MSFC). In pooling and analyzing clinical trial data sets leading to the MSFC recommendation, the Task Force found that neither high-contrast visual acuity (HCVA) nor the visual functional system score from EDSS were informative measures of visual dysfunction in MS. Additionally, HCVA did not show correlation with the Expanded Disability Status Scale (EDSS).1,2 Consequently, no visual measure was recommended. Instead, the Task Force recommended that the MS field identify and test the promising visual measures for inclusion in future disability metrics. Contrast sensitivity had already emerged as a promising measure for MS in the Optic Neuritis Treatment Trial (ONTT), where it captured visual dysfunction missed by HCVA using log minimum angle of resolution (logMAR) charts and research protocol tested VA measurements.3–6 Furthermore, deficits in contrast sensitivity and reduced vision-specific quality of life (QOL) were evident many years following acute optic neuritis (ON), even in patients with normal high-contrast VA. 7 In the ONTT, contrast sensitivity was measured using Pelli-Robson charts; however, these charts were out of print when a candidate visual measure was being sought for inclusion in the MSFC. Furthermore, Sloan low-contrast letter acuity (LCLA) charts followed a standardized format of the Early Treatment Diabetic Retinopathy Study (ETDRS) charts used in ophthalmology clinical trials.8,9 For these reasons, Sloan LCLA charts were chosen for later measurements of low-contrast vision (Figure 1).
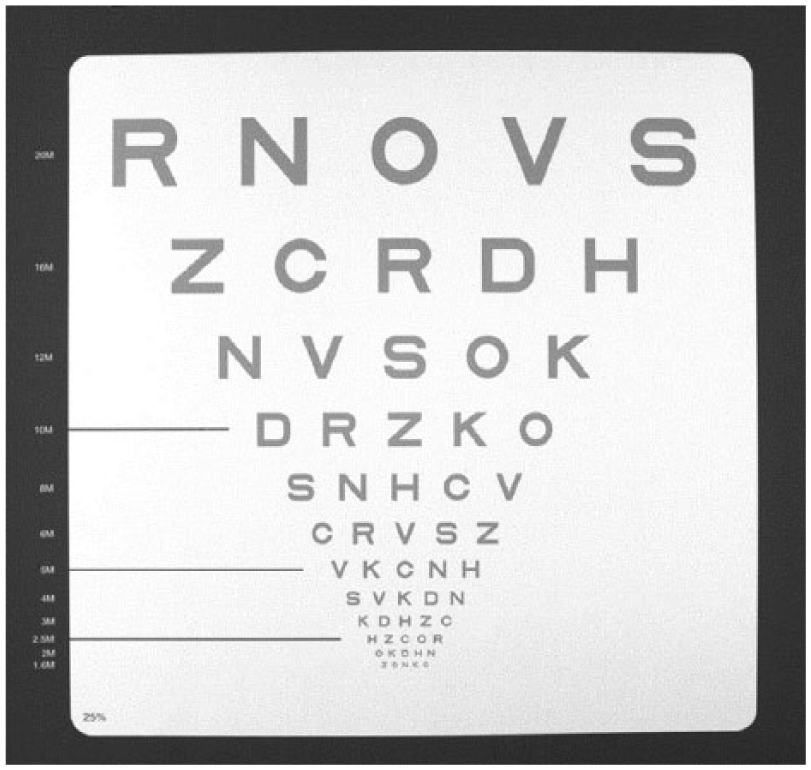
Low-contrast letter acuity chart (low-contrast Sloan letter chart, Precision Vision, LaSalle, IL). These charts have a standardized format based on Early Treatment Diabetic Retinopathy Study visual acuity charts, the standard used in ophthalmology clinical trials, and have several advantages over standard Snellen charts or near vision testing cards as traditionally used in MS trials: (1) letters (Sloan letters) are designed to be equally detectable for normal observers; (2) each line has an equal number of letters (five per line); (3) spacing between letters and lines is proportional to the letter size; (4) change in visual acuity from one line to another occurs in equal logarithmic steps (change of three lines constitutes a doubling of the visual angle); (5) visual acuity (for high-contrast (black letters on white) chart) may be specified by Snellen notation for descriptive purposes (i.e. 20/20), by the number of letters identified correctly. This figure shows the 25% contrast level for purposes of illustrating format; the actual contrast levels used in these trials, 2.5% and 1.25%, have substantially lighter gray letters. The charts measure 14 × 14 in for easy use and portability in the MS clinical trial setting; charts may also be mounted on a retro-illuminated cabinet, thus eliminating the need for standardization of room lighting levels.
There are a few important differences between the Pelli-Robson contrast sensitivity and Sloan LCLA charts. Pelli-Robson charts have uniformly large (20/680 Snellen equivalent size at 1 m, or approximately 5 cm tall) letters of decreasing contrast in a series of triplets (Figure 2), 11 and are a good measure of low and intermediate spatial frequencies as well as peak contrast sensitivity. 12 Sloan charts are the grey on white version of the standard ETDRS chart mentioned previously, with each line of letters decreasing in size while the contrast level remains constant. 13 The amount of contrast necessary to distinguish an object from its background is affected by the size of the object, 14 and the Sloan format allows detection of impaired low-contrast vision at multiple letter sizes. This is also known as “notch” loss of contrast and is apparent in some neurological disorders such as Parkinson’s disease.15–18 Thus, the Sloan LCLA format has advantages over the Pelli-Robson method; hence, the utilization of the former as a visual outcome measure in MS clinical trials.
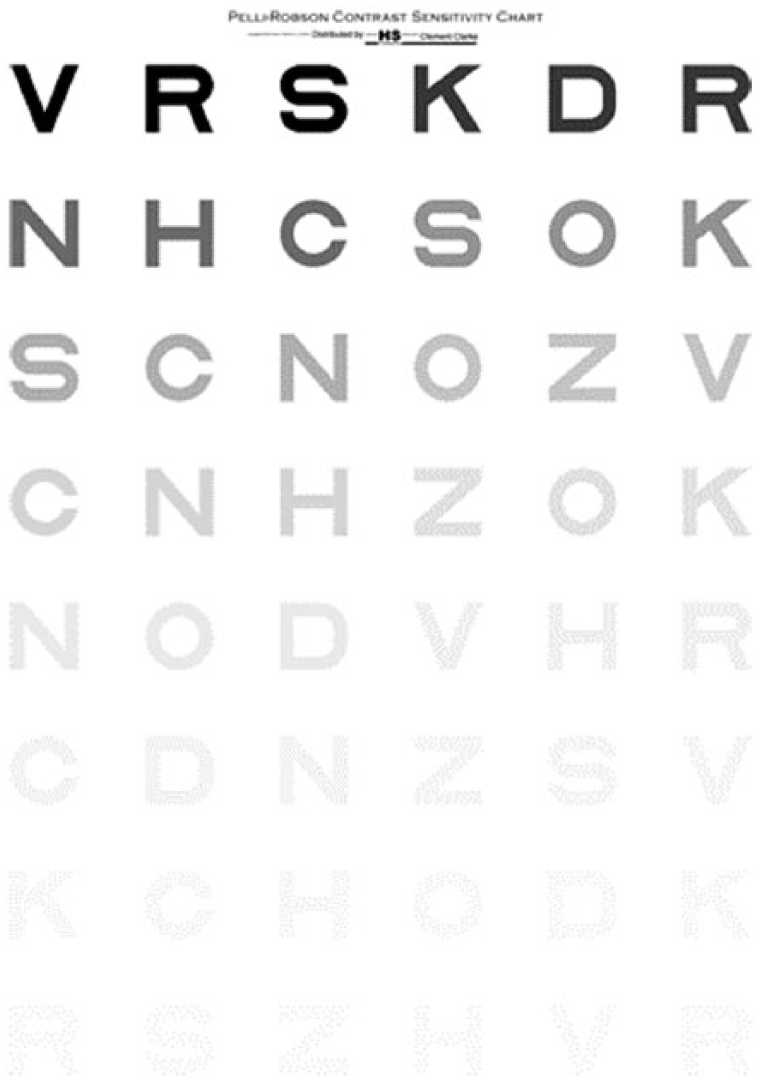
Pelli-Robson contrast sensitivity chart (Precision Vision, LaSalle, IL) 11 The Pelli-Robson contrast sensitivity charts have uniformly large (20/680 Snellen equivalent size) letters of decreasing contrast in a series of triplets. There are two triplets per line and all letters within each triplet have the same contrast level. The Pelli-Robson chart is read at 1 m. It is wall or easel mounted; therefore, luminance of the environment must be accounted for when used for research.
Testing of LCLA using Sloan charts was first implemented as an exploratory outcome measure in the International MS Progressive Avonex Clinical Trial (IMPACT) study of interferon beta-1a for secondary progressive MS. Both in this study and in a heterogeneous convenience sample cohort of MS patients, it was demonstrated that LCLA was superior to HCVA, L’Anthony D-15 DS color test, and Esterman binocular visual field test in MS patients. Although both Sloan and Pelli-Robson methods distinguished MS subjects from healthy controls significantly better than HCVA, Sloan charts performed better than Pelli-Robson charts with odds ratios for worse visual function scores in MS patients of 2.41 (95% confidence interval (CI): 1.77–3.29; p < 0.001) for Sloan LCLA versus 1.77 (95% CI: 1.38–2.26; p < 0.001) for Pelli-Robson contrast sensitivity. Furthermore, only Sloan LCLA was able to distinguish MS subjects from healthy controls in the two lowest age quartiles (18–32 and 33–43 years). 13 MS patients have significantly lower LCLA scores than disease-free controls, a difference that is most pronounced at the lowest contrast levels.13,19,20 Importantly, MS and disease-free controls have similar median Snellen VA scores, 13 supporting previous clinical observations that LCLA and other contrast measures capture aspects of visual function missed by HCVA. Information from these pivotal studies set the stage for use of LCLA as an outcome measure in MS research, clinical trials, and practice.
Defining LCLA
Contrast is the quantity of lightness or darkness contained by an object in comparison to its background. The smallest difference in contrast distinguished by the eye is known as the contrast threshold, usually reported as its reciprocal value, which is also known as contrast sensitivity (1/contrast threshold). Therefore, if a large amount of contrast is necessary for a patient to identify an object, they have poor contrast sensitivity and will have a low numerical value for this measurement. 14
Contrast sensitivity can be thought of as a spectrum, in that black letters on a white background will be easier for any individual to discern than lower-contrast grey on white letter chart, regardless of whether or not visual abnormalities are present. The contrast threshold is the minimum amount of contrast necessary for an individual to discern an object from its background, and for people with MS the contrast threshold has been found to be higher than that of healthy individuals, even when visual acuity is equal between the two groups. 13 Therefore, it can be hypothesized that in MS contrast sensitivity testing is picking up more subtle deficits in vision, as injury anywhere along the visual pathway may theoretically lead to a decrease in the ability of the visual system to resolve images at a given threshold. This relationship is supported by the correlation of LCLA with retinal structure by OCT20–22 and lesions in the posterior visual pathway by magnetic resonance imaging (MRI).23,24
LCLA testing takes contrast sensitivity a step further mechanistically, in that the decrease in letter size incorporates testing of different spatial frequencies. The contrast sensitivity function defines the relationship between contrast sensitivity and spatial frequency, and illustrated that contrast sensitivity is highest at intermediate spatial frequencies. 25 In early studies examining changes in spatial contrast frequency in patients with known cerebral lesions and blurred vision, it was found that most patients had significant increases in their contrast threshold; however, the spatial frequencies at which the contrast sensitivity was lost was variable. Therefore, it was hypothesized that the visual deficits in these patients were caused by injury to frequency-sensitive elements in the visual pathway. 15 This “notch” loss of contrast sensitivity at some intermediate spatial frequency does not support the hypothesis that contrast vision loss is simply on a spectrum and implies that lesions in the visual pathway may affect specific contrast patterns. Furthermore, there is some evidence that the complex excitatory and inhibitory patterns of neurons in the retinocortical pathway, including the behavior of retinal ganglion cells (RGCs), may explain the mechanism of the contrast sensitivity function. 25 In a later study, it was found using contrast perimetry that in MS patients the most pronounced loss of contrast sensitivity occurred with medium-sized stimuli and they postulated this may be explained by damage to inter-neuronal connections responsible for spatial summation in the visual pathway. 26
Overall, based on this evidence, the mechanism of LCLA deficits in MS may be thought of as twofold. First, contrast sensitivity is on a spectrum and may elicit more subtle changes in the contrast threshold that will be missed by HCVA. Second, LCLA tests low-contrast vision at various spatial frequencies that may be particularly affected by damage to specific inter-neural connections in the complex visual pathway.
Review objective
The LCLA test was reviewed due to its prominent role in discussions emanating from the MS Outcome Assessments Consortium (MSOAC). MSOAC’s mission is to develop an optimal outcome assessment tool for clinical trials for MS-related disability. The idea stemmed from a consensus paper by the International Advisory Committee on Clinical Trials in Multiple Sclerosis. 27 The MSOAC includes representatives from the National MS Society as well as six other MS advocacy organizations, Food and Drug Administration (FDA), European Medicines Agency (EMA), National Institute of Neurological Disorders and Stroke (NINDS), 21 academic institutions, and 9 industry partners. The recommended tools should reflect core MS impairments that are highly reliable and valid, practical, cost-effective, and meaningful to persons with MS. The literature included in this review is selective, but derives from a systematic MSOAC search conducted in Embase, MEDLINE, PsycInfo, and Cumulative Index of Nursing and Allied Health Literature, followed by an enrichment technique (key papers identified by MSOAC members added and informed search criteria) including work identified from prior reviews. Furthermore, articles identified by literature search that did not include low-contrast vision as an outcome measure were excluded. Like the companion reviews of Symbol Digit Modalities Test, Nine-Hole Peg Test, and Timed 25-Foot Walk, the article begins with psychometric validity and concludes with an appraisal of the clinical meaningfulness of the measure.
Ease of use, practical considerations, and content validity
Sloan letter charts are easily and reliably administered by trained non-physician personnel in MS clinical trials. 13 Testing occurs with lights off and charts placed on a retro-illuminated cabinet, eliminating the need for standardized room lighting. Alternatively, charts in a spiral-bound approximately 12 × 12-in book can be mounted on an easel or against a wall in front of the patient. Patients are seated 2 m away and asked to read the letters aloud proceeding top to bottom and from left to right until they can no longer see the letters. The score for each chart is quantified as the number of letters identified correctly with a maximum score of 70 letters. This letter-by-letter scoring system is comparable to the logMAR format that ophthalmologists use to score ETDRS VA—the format is familiar, easy to interpret, and provides a linear scale for statistical analysis. For a typical MS patient, this process takes approximately 10–15 minutes to complete, when testing each eye individually and binocular vision for two different contrast levels.
Chart-based methods of testing low-contrast vision are practical in that they can easily be administered by trained study or clinical personnel, are relatively inexpensive, portable, time efficient, and do not require calibration. These factors make use feasible in busy clinical practice or research setting.10,19,28 From a technical perspective, it is important for participants to be optimally refracted and ambient lighting must be controlled if a retro-illuminated cabinet is not used. 29 Additionally, potential limitations to consider for chart-based testing include uneven backlighting, surface reflections, and fading of print on the charts. 14
Sloan charts at 100%, and 2.5% and 1.25% contrast have been used in MS clinical trials and research studies. 30 Sloan 100% contrast charts (black letters on a white background) are equivalent to HCVA and utilized to characterize study cohorts. The 2.5% and 1.25% contrast Sloan charts refer to the percent contrast of the letters compared to 100%, with lower contrast levels corresponding to lighter gray letters on a white background. For example, 1.25% Sloan LCLA charts have only 1.25% of the contrast (quantity of light reflected by the letter compared to the background) that 100% Sloan charts have and appear a lighter shade of gray than the 2.5% charts. Lower contrast levels have potential floor effects, such that MS patients have zero or close to zero scores that do not allow for measurements of change over time. At the same time, higher contrast levels may have ceiling effects, that is, all or most letters on the chart are easily read with no potential for improvement over time. 31 In the MSFC validation study and IMPACT sub-study, the 0.6% contrast level was excluded from primary analysis because 49.5% of patients were unable to read any letters on the chart. 28 Structurally, in the case of two or more episodes of acute ON, patients may have thinning of the retinal nerve fiber layer (RNFL) by OCT to the 50- to 60-µm level. Studies using time-domain OCT have shown that eyes with longstanding no-light perception vision from non-glaucomatous optic neuropathies retain a residual peripapillary RNFL thickness of about 45 µm. 32 Such eyes generally have scores of zero (0) on the 1.25% and 2.5% LCLA charts. Furthermore, in early studies of 5%, 2.5%, and 1.25% LCLA, the greatest differences between MS patients and healthy controls were observed at lower contrast levels. 13 Therefore, 1.25% and 2.5% LCLA charts were determined to be the most clinically useful for practice and clinical trials.
Sloan LCLA charts are administered binocularly or each eye can be tested individually. Binocular measurements are useful in that they measure visual function as used in everyday life and can minimize patient fatigue. However, collecting only binocular data may mask monocular deficits due to binocular summation (both eyes together see better than each individual eye). Measuring each eye individually may also identify the presence of binocular inhibition (when the better seeing eye has better acuity than both eyes together). Binocular inhibition may be observed after ON 33 and may be a presenting sign of MS. 34 In previous clinical trials, binocular testing was utilized as this is thought to be most representative of low-contrast vision as it is used in daily life and is analogous to the MSFC utilizing a timed test of ambulatory function (T25FW) rather than testing individual leg strength or coordination.10,13,35
The content validity of LCLA is evident in that MS patients often report that their vision is “not right” despite having normal HCVA; LCLA is able to capture this dysfunction. Furthermore, at a self-evident or intuitive level, low-contrast vision is important for performing everyday activities36–41 and thus should influence a patient’s perceived disability. 42 In fact, it has been shown that low-contrast vision is a good predictor of real-world visual tasks including reading,43,44 facial recognition,45,46 and driving. 47 This further supports the superiority of LCLA to HCVA as a measure of visual deficits in MS patients, and it anchors LCLA scores to tangible outcomes that are meaningful to a patient’s QOL.
Psychometric validity
Reliability
Sloan LCLA testing has been shown to have excellent inter-rater reliability, with intra-class correlation coefficients (ICC) of 0.86–0.95 across all contrast levels in both MS patients and disease-free controls. 19 In one study, mean inter-rater differences in letter scores were small (<2 letters) for both MS and control groups, indicating that different raters may administer the test with little variation in the absolute value of scores. Additionally, it was found that the inter-rater reliability of Sloan LCLA is maintained across a wide range of letter scores, as the inter-rater difference in letter score did not vary systematically with average letter score. 19
Although there have been no studies looking at test–retest reliability in Sloan LCLA charts, it has been demonstrated that seven letters on the Sloan LCLA test represents two standard deviations of inter-rater difference; therefore, a change in seven letters was used in later studies to define a clinically meaningful difference.19,35 A more recent study further supported this in healthy controls with a repeatability coefficient for 10% low-contrast ETDRS charts of about eight letters, indicating that a change of greater than eight letters was to be considered clinically meaningful. Furthermore, in this study, the average difference between the two measurements for the low-contrast ETDRS charts was less than one letter and non-significant. 48 In another study examining test–retest variability of a Bailey-Lovie low-contrast letter chart in healthy control subjects, there was an average improvement of one letter in subsequent trials pointing to a learning affect; however, this was highly variable with a change in score ranging from a decrease in two lines to an increase in two lines in subsequent trials for the low-contrast acuity task. Based on this information, some participants may have a learning affect, while others may worsen across trials possibly indicating fatigue. 49
Criterion validity, LCLA, and EDSS/MSFC
Considering the ever important correlation between an identified measure and an external reference standard, 50 the EDSS remains the gold standard for measuring MS disability. 51 The MSFC was developed to address EDSS shortcomings, and the need for a multidimensional, quantitative, reliable, and sensitive outcome measure using three components which quantify upper limb function, cognitive function, and walking speed.1,2,52 To the extent that LCLA represents the disability construct, correlations should be significant. Initial studies showed that scores for LCLA (1.25% contrast) correlated with both the EDSS (Multiple Sclerosis Vision Prospective (MVP) cohort: rs = −0.45, p < 0.0001; IMPACT sub-study: rs = −0.43, p = 0.001), and MSFC (MVP cohort: rs = 0.56, p < 0.0001; IMPACT sub-study: rs = 0.57, p ⩽ 0.0001), 13 thus validating LCLA as an MS disability measure. Importantly, these correlations were significant yet moderate, indicating that LCLA captures aspects of MS-related dysfunction, which is not captured by the EDSS or the MSFC alone.13,28 In another study, it was shown that there were no significant differences in LCLA between patients with and without EDSS progression. Furthermore, a substantial percentage of patients with stable EDSS had worsened LCLA, suggesting that LCLA adds information to the EDSS. 53
Adding LCLA to the MSFC to create a four-dimensional (4D) MSFC was tried in a number of MS clinical trials during the past two decades, effectively adding a much needed visual dimension to the MSFC.13,54 Data demonstrated that all components including LCLA contributed comparably to the overall score. This further supports the concept that LCLA provides additional information that is not already captured by the original MSFC. 13 Furthermore, the 4D MSFC does not appear to have higher correlation with EDSS than the MSFC-3, which may be due to the EDSS being heavily weighted toward ambulation. 13 Finally, the 4D MSFC is able to detect treatment effects in clinical trials (see below).
Criterion validity: structural and electrophysicologic correlation
Optical coherence tomography
The relation of LCLA scores to retinal thickness by optical coherence tomography (OCT) helps to ground LCLA in the neuropathology of MS, much as cognitive deficits correlate with various aspects of MS brain atrophy. In this sense, LCLA is a physiologically meaningful measure (Table 1). OCT provides a unique opportunity to easily and non-invasively quantify the histological layers of the retina, 55 including the unmyelinated axons that comprise the RNFL. 20 Furthermore, retinal measures correlate with brain atrophy and lesion burden in MS. 56
Studies that have correlated low-contrast letter acuity or contrast sensitivity to other visual outcome measures.
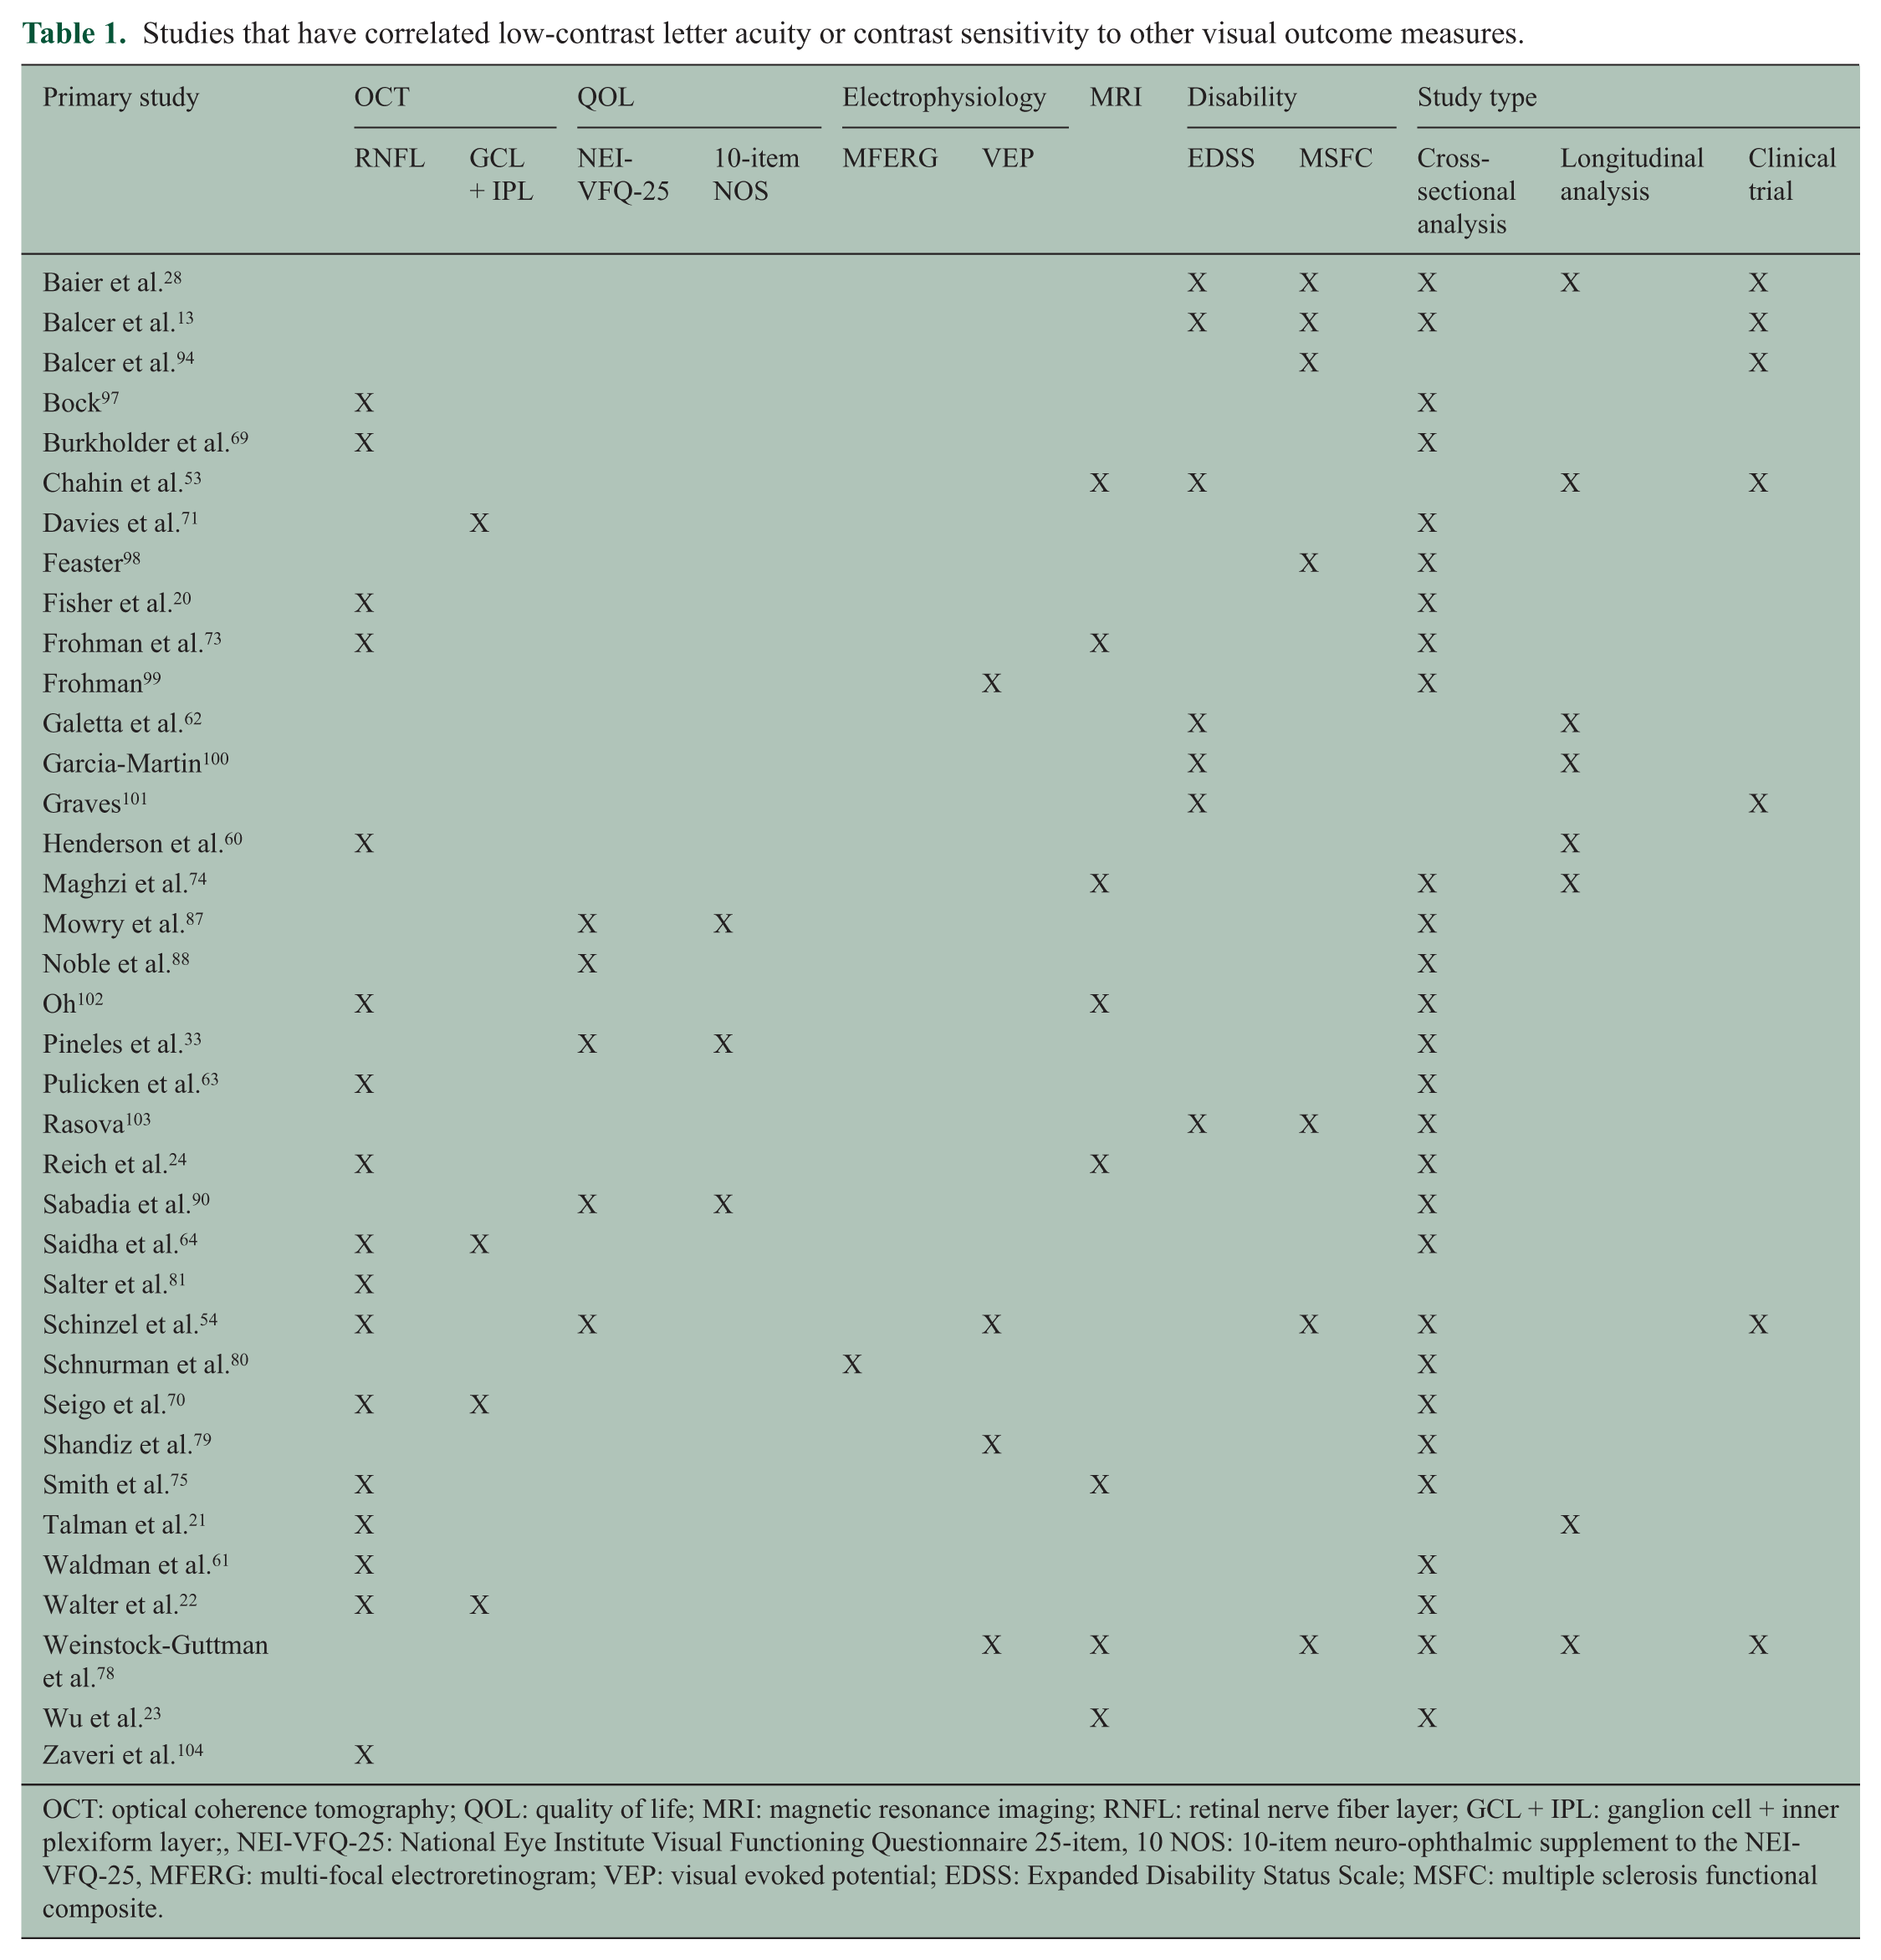
OCT: optical coherence tomography; QOL: quality of life; MRI: magnetic resonance imaging; RNFL: retinal nerve fiber layer; GCL + IPL: ganglion cell + inner plexiform layer;, NEI-VFQ-25: National Eye Institute Visual Functioning Questionnaire 25-item, 10 NOS: 10-item neuro-ophthalmic supplement to the NEI-VFQ-25, MFERG: multi-focal electroretinogram; VEP: visual evoked potential; EDSS: Expanded Disability Status Scale; MSFC: multiple sclerosis functional composite.
In adult MS patients with a history of ON, there is more pronounced thinning of the RNFL in the eye affected by ON.20,57,58 This is not surprising considering that after an episode of ON, MS patients will have 10- to 20-µm RNFL loss within 3–6 months following the episode 59 and it has been shown that LCLA correlates with RNFL loss 3 months after first episode ON. 60 However, fellow eyes of patients with ON and eyes of patients with MS but no history of ON also show RNFL thinning compared to eyes of disease-free controls.20,57,58 Importantly, thinning of the RNFL by OCT correlates with LCLA scores, such that a one-line decrease in LCLA is associated with a 4-µm loss in RNFL thickness. 20 In MS eyes, RNFL thinning occurs over time even in the absence of acute ON, and it has been shown that eyes with decreased LCLA (2.5%) have greater RNFL thinning. 21 LCLA scores and RNFL thickness have also been shown to correlate in pediatric MS. 61 LCLA differs across EDSS score categories, 62 and in the secondary progressive MS subtype, patients have been shown to have greater degrees of RNFL thinning and visual dysfunction.63–67 Morphology of the optic nerve head, the location where the RNFL axons coalesce, may also be measured by OCT which is correlated with LCLA scores. 68
Macular volume reduction is correlated with poor LCLA, even after accounting for peripapillary RNFL thickness. 69 Advances in OCT allows measurement of various layers of the retina. MS patients have significantly lower ganglion cell layer + inner plexiform layer (GCL + IPL) volumes than healthy controls, and these layers are thinner in eyes with lower (worse) LCLA scores.70,71 Walter et al. 22 examined GCL + IPL, RNFL, outer plexiform layer/inner nuclear layer (OPL + INL) and outer nuclear layer/photoreceptor layer (ONL + PRL) and found that GCL + IPL as well as macular RNFL was significantly reduced in MS patients compared to controls, as well as in eyes with a history of ON compared to MS eyes without an ON history. LCLA scores were reduced at the 2.5% and 1.25% contrast levels in MS eyes with lower thickness values for peripapillary RNFL, macular RNFL, and GCL + IPL. Furthermore GCL + IPL and macular RNFL showed the strongest correlations with worsening vision-specific QOL. 22 GCL + IPL thickness does not differ by race in healthy persons, but in MS GCL + IPL thickness is significantly reduced in eyes of African Americans. Notably, over longitudinal follow-up, there were no baseline differences in scores across racial groups, but eyes of African American patients had greater losses of LCLA per year of disease duration. 72
MRI and LCLA correlates
Regarding brain MRI (Table 1), Wu et al. 23 were the first to show that worse LCLA was associated with higher brain T2 lesion volume, a finding supported by subsequent data.53,73 Interestingly, the correlation between T2 lesion burden and LCLA was stronger than associations with EDSS or MSFC. In specific areas of interest for the afferent visual system, including Brodmann’s area 17 white matter and the optic radiations, the MRI lesion volume was even more significantly correlated with worse LCLA scores. 23 Brain atrophy was also increased among MS patients with worse binocular scores for LCLA. Reich et al. 24 reported that MS eyes with RNFL thickness greater than 80 µM (indicating less severe axonal loss) demonstrated significant correlations with 2.5% LCLA and with various MRI indices in areas corresponding to the optic radiations. 24 In a study by Maghzi et al., 74 the relation between brain volume by MRI and LCLA scores was explored. A 1% reduction in brain volume by MRI using structural image evaluation using normalization of atrophy (SIENA) was associated with a decrease in 1.5 letters for LCLA score at both the 2.5% and 1.25% contrast levels. 74 Considering that seven-letter differences are considered to represent clinically meaningful changes beyond test–retest variability for LCLA,19,21 the authors extrapolated that a 4%–5% decrease in brain volume could be associated with significant visual impairment. The relationship between LCLA scores and MRI structural correlates of disease was explored in longitudinal studies. Chahin et al. 53 showed that worse LCLA scores correlated significantly with higher T1 and T2 MRI lesion volumes over the course of a 104-week study. 53 Diffusor tensor imaging (DTI) increased radial diffusivity or decreased fractional anisotropy of the optic nerve was associated with reductions in RNFL thickness by OCT and with worse visual function by LCLA. 75
VEPs and multifocal electroretinogram
The classic cortical response in visual evoked potential (VEP) measures is delayed latency with normal amplitude. However, when anterior visual pathway axonal loss is present (often manifested by OCT RNFL and GCL + IPL thinning), amplitude is also decreased. 76 Low-contrast VEPs may be used to measure contrast sensitivity in MS, 16 typically demonstrating increased latencies or absent waveforms compared to VEPs with high-contrast stimuli. The measurement of multi-focal VEPs is yet another method, with some studies suggesting that this technology provides better sensitivity and specificity for detecting visual abnormalities in MS and ON. 77
Several studies examined the relation between VEPs and low-contrast vision (Table 1). In a subset of patients enrolled in a Phase 3 clinical trial of interferon beta-1a, Weinstock-Guttman et al. 78 found prolongations of absolute and prolonged VEP latency in patients with reductions in LCLA scores. In another study that utilized the Cambridge contrast sensitivity test, there was no significant association between abnormal VEPs and contrast sensitivity scores in a cohort of MS patients. 79 However, in a study by Schinzel et al., 54 it was shown that Sloan LCLA scores at both 2.5% and 1.25% contrast levels were significantly reduced in MS eyes with more prolonged with P100 latency using conventional VEP. 54
Multifocal electroretinogram (ERG) (Table 1) has been more recently utilized to generate optic nerve head component (ONHC) responses (a subset of the global retinal response theoretically representing only the ONHC). 80 This was chosen for analysis because the normal ONHC response depends on the integrity of the RGC neuron, and is representative of the action potential as RGC axons traverse the lamina cribosa and conduction switches from unmyelinated to myelinated axons. This study found a significant reduction in ONHC responses in MS eyes with worse scores for LCLA. With respect to an accepted seven-letter clinically meaningful change in LCLA, reductions by seven letters in the Schnurman et al. 80 study were associated with average increases in numbers of abnormal ONHC waveforms by 4.6 at 2.5% contrast and by 6.6 at 1.25% contrast. This finding provides further structural validation for LCLA and could be a result of MS-related demyelination resulting in loss, delay, or disorganization of the ONHC response.
The relation of the pupillary light reflex and LCLA scores in a cohort of patients with unilateral optic neuropathy secondary to MS or neuromyelitis optica was examined. All study eyes had evidence of RNFL thinning by OCT. It was shown that the pupillary metric of percent change in diameter in these eyes reflected reductions in LCLA scores. 81 This investigation added yet another anterior visual pathway metric to the list of electrophysiological correlates validating LCLA as a visual outcome measure in MS.
Criterion validity: LCLA and the King-Devick test
The King-Devick test of rapid number naming is a vision-based test that incorporates testing of saccades, attention, and language. 82 It is often used as a screening tool for concussion, as it has been established that athletes perform more slowly than their pre-season baseline testing times after sustaining a concussion. 83 Among patients with MS, performance of this binocular rapid number naming test was significantly slower than that of disease-free controls, with mean testing time differences of 13.5 seconds. Slower King-Devick scores were also significantly associated with reductions in binocular and monocular LCLA scores at 2.5% and 1.25% contrast. 84 Abnormal eye movements are common in MS and can occur independently or concurrently with afferent visual function. 31 This important study provided evidence that efferent visual dysfunction measured by the King-Devick test of rapid number naming is significantly associated with deficits in LCLA in MS patients. 84
Predictive validity
In the IMPACT trial, a change in LCLA from baseline to year 1 was a significant predictor of change in EDSS scores between year 1 and year 2. This finding remained after accounting in statistical models for changes in MSFC scores; therefore, LCLA was additive to the MSFC in predicting future changes in neurological disability as measured by EDSS. 28
Ecological validity of LCLA and clinical relevance
The 25-question National Eye Institute Visual Functioning Questionnaire (NEI-VFQ-25) is a widely used and well-validated measure of vision-specific QOL 85 that captures activity limitations in patients with MS and in a variety of ocular disorders (Table 1). To better assess some unique features of visual dysfunction in MS and other neuro-ophthalmologic conditions, a 10-Item Neuro-Ophthalmic Supplement to the NEI-VFQ-25 was designed with participation of MS patients in focus groups. 86 Both the NEI-VFQ-25 and 10-Item Supplement have been implemented in MS and ON clinical trials. It is now well established that reductions in LCLA reflect worse scores for vision-specific QOL.53,54,87,88 Mowry et al. 62 showed that two-line (10-letter) differences in LCLA are associated with 4-point or greater reductions in NEI-VFQ-25 composite scores. 87 This is important since 4-point differences in overall score are considered clinically meaningful for the NEI-VFQ-25. 89
After acute ON, even when HCVA recovers to 20/40 or better in the affected eye, it has been shown that clinically meaningful reductions in QOL remain and reflect persistent deficits in LCLA, RNFL, and GCL + IPL thickness. 90 Specific NEI-VFQ-25 subscales that are associated with deficits in LCLA include general vision, near and distance activities, role difficulties, and driving. 87 Lower (worse) scores for LCLA have also been associated with poorer scores on other measures of QOL, including the (IVIS) and Short Form 36 health survey (SF-36).53,87 In a Phase 3 MS trial sub-study, it was found that a seven-letter worsening of 2.5% LCLA was associated with a 0.5-point decrease in IVIS scores. 53 In the study by Mowry et al., 87 scores on the IVIS also were decreased significantly among patients with MS who had worse scores for LCLA (p < 0.001 for all regression models, accounting for age). The IVIS is a 5-item instrument derived from the Functional Capacities Assessment developed by the Michigan Commission for the Blind. The IVIS captures non-cognitively based difficulties with visual recognition that cannot be corrected with visual aids and is a subscale included in the MS Quality of Life Inventory (MSQLI). IVIS scores, calculated as the unweighted sum of the item scores, range from 0 to 15, with higher scores representing worse health-related quality of life (HRQOL). Clinically meaningful changes and differences in IVIS scores have not been established. 91
Responsiveness and clinically meaningful change in LCLA
Clinically meaningful changes in LCLA were initially defined as 10-letter or 2-line reductions in the number of letters a person can identify correctly based on prior studies of test–retest reliability examining high-contrast VA. 92 However, subsequent studies of HCVA among patients with good acuity suggested that reductions of just five letters (one line) may also likely be clinically meaningful. 21 Likewise, seven letters of LCLA loss are now considered to be meaningful and beyond the threshold of test–retest variability as determined in reliability studies. 19 These thresholds are based on statistical analyses of measure variance, and not associations with real-life anchors.
Such seven-letter reductions in LCLA are, however, associated with significant worsening of NEI-VFQ-25 scores as well as RNFL thickness by OCT.21,30 Further supporting the validity of the seven-letter threshold is its use in longitudinal studies of MS with structural correlations. 21 Relatedly, LCLA has shown treatment effects in the Phase 3 clinical trials of natalizumab for relapsing MS, as in AFFIRM and SENTINEL.10,35 In the placebo-controlled AFFIRM trial, sustained clinically significant worsening, defined as a 10-letter decrease in LCLA for 12 weeks, was reduced in the natalizumab group by 47% for 2.5% LCLA and by 35% for 1.25% LCLA. In the SENTINEL trial (active arm comparison with interferon beta-1a), the probability for sustained visual loss was again lower in the group treated with natalizumab. These numbers translated into overall cumulative probabilities of sustained visual loss of 18% in the placebo group versus 10% in the natalizumab group in AFFIRM at 2.5% contrast; in SENTINEL (active arm comparison of natalizumab + interferon beta-1a with interferon beta-1a + placebo), the proportions were 12% and 10%, respectively. Overall, these studies demonstrated that LCLA was able to detect treatment effects of reduced sustained visual loss. Notably, no significant differences over time or treatment effects were demonstrated for HCVA in the natalizumab trials, attesting to the clinically noted and investigatively noted inability of this measure to capture visual dysfunction in MS. 10
A 10-letter (two-line) threshold for clinically meaningful change was initially used in analyses of the Phase 3 natalizumab trials, but the AFFIRM trial data 35 showed that a seven-letter cutoff for LCLA was optimal for identifying clinically meaningful change. 93 The AFFIRM analyses further demonstrated that not only could LCLA detect longitudinal changes and treatment effects on worsening of vision, it could also show differences in visual improvement. In fact, sustained visual improvement was increased by 39% for 2.5% LCLA and 57% for 1.25% LCLA in the natalizumab-treated group. Additional analyses of patients who were “improvers,” defined as seven-letter sustained LCLA improvement for 12 weeks, showed that, starting at week 24, there were increases in the numbers of letters identified over time in the active treatment group. Cumulative probabilities/proportions with seven-letter sustained increases in LCLA scores at 2.5% contrast were 21.7% in the natalizumab group versus 14.3% in the placebo group in AFFIRM. With regard to HCVA and improvement of vision, this measure, considered a standard outcome in many ophthalmologic disorders, continued to be insensitive to changes over time or treatment effects. 35
The role of LCLA as a measure of response to therapy was confirmed in the Phase 3 CARE-MS study of alemtuzumab in relapsing-remitting MS. In this trial, there were statistically significant increases in the numbers of patients demonstrating improvement in LCLA at 12 months, as well as significant differences in scores at 12 and 18 months in the alemtuzumab group. 94 In a study of 4-aminopyridine (4-AP), there was a higher percentage of responders (defined as an improvement of seven or more letters on 2.5% LCLA) in the 4-AP compared to a placebo control group. 95 Overall, based on the results of clinical trials for disease-modifying therapies in MS, there is strong evidence that LCLA is a visual outcome measure that is sensitive to treatment effects.
Conclusion and future directions
This review has endeavored to describe and characterize the LCLA metric for research and clinical use among persons with MS. Our perspectives should be viewed in the context of other reviews (Supplementary Table 1) that consider how LCLA is related to other aspects of this disease.
At a practical level, potential limitations to consider when assessing low-contrast acuity using chart-based testing include surface reflections on the chart, the possibility for uneven backlighting in the retro-illuminated cabinet, fading of the letters, learning effects, and the inability to recognize letters. Technically, it is important that participants be optimally refracted. Additionally, when not using a retro-illuminated cabinet, ambient lighting in the room must be controlled and the test performed under standardized lighting. Another consideration is that low-contrast acuity testing levels may have a floor effect, where participants may score zero or close to zero, thus preventing measurements of change over time.
Implementation of LCLA testing in MS patients on electronic platforms is an important topic for future research. In a recent study, it was shown that patients with Parkinson’s disease had worse LCLA compared to controls using a digitized contrast letter acuity chart displayed on an iPad. 96 This supports that an electronic version of LCLA may be useful for screening patients with neurological disease, but further research is necessary to establish the validity of this technique.
Despite these limitations, this review finds that loss of low-contrast vision has been shown to be an important contributor to impairment and disability in MS. Axonal and neuronal loss as measured by OCT, clinically meaningful changes in patient-reported assessments of QOL, EDSS/MSFC, MRI, and electrophysiological measures all correlate with deficits in sensitive low-contrast visual function tests. Validity research shows that LCLA is a good measure of low-contrast vision. When incorporated into clinical trials, LCLA as a visual outcome measure has yielded important findings for therapeutics in MS. Furthermore, it has excellent test–retest reliability and is the most sensitive test for visual dysfunction in MS, capturing patient-reported disability not seen when measuring HCVA. Evidence has accumulated suggesting that a 7-point change in LCLA is clinically meaningful.
Footnotes
Acknowledgements
The Multiple Sclerosis Outcome Assessments Consortium (MSOAC) operates through the Critical Path Institute. The authors gratefully acknowledge the expert services of Wendy Kaye (McKing Consulting) and the organizational support from Gary Lundstrom and Alicia West (Critical Path Institute). The authors wish to acknowledge Dr. Raynowska’s noteworthy contributions to the preparation of this manuscript.
Declaration of Conflicting Interests
The author(s) declared no potential conflicts of interest with respect to the research, authorship, and/or publication of this article.
Funding
The author(s) disclosed receipt of the following financial support for the research, authorship, and/or publication of this article: This work was supported by the National Multiple Sclerosis Society (Grant number RG 4869-A-1 to the Critical Path Institute).
References
Supplementary Material
Please find the following supplemental material available below.
For Open Access articles published under a Creative Commons License, all supplemental material carries the same license as the article it is associated with.
For non-Open Access articles published, all supplemental material carries a non-exclusive license, and permission requests for re-use of supplemental material or any part of supplemental material shall be sent directly to the copyright owner as specified in the copyright notice associated with the article.