
Abstract
Background:
Previous studies have postulated an association between dentate nucleus T1 hyperintensity and multiple sclerosis (MS)-related progressive neurodegeneration. Therefore, MS patients have been excluded from most studies investigating brain deposition of gadolinium-based contrast agents (GBCAs).
Objective:
To study the hypothesis that dentate nucleus T1 hyperintensity in MS patients is associated with GBCA administration.
Methods:
In a cohort of 97 MS patients, the dentate-to-pons signal intensity ratio (DPSIR) was calculated for 265 consecutive T1-weighted magnetic resonance (MR) scans (including sessions with and without the administration of GBCA). Patients exclusively received either gadopentetate dimeglumine (Gd-DTPA, linear) or gadobutrol (Gd-BT-DO3A, macrocyclic).
Results:
In patients receiving Gd-DTPA, DPSIR increased significantly between the first and the last scan (+0.009, p < 0.001), and following magnetic resonance imaging (MRI) with Gd-DTPA administration as compared to following an MRI without Gd-DTPA administration (+0.005 vs −0.001; p = 0.022). Additionally, there was a positive linear relationship between the number of Gd-DTPA administrations and the increase in DPSIR (p = 0.017). No DPSIR increase was observed after Gd-BT-DO3A administration.
Conclusion:
Dentate nucleus T1 hyperintensity in MS patients is associated with Gd-DTPA (but not Gd-BT-DO3A) administration, suggesting an alternative explanation for the association of T1 hyperintensity with disease duration and severity.
Introduction
Gadolinium-based contrast agents (GBCAs) are widely used to improve diagnostic accuracy of magnetic resonance imaging (MRI) in a broad spectrum of diseases. Especially for patients with multiple sclerosis (MS), MRI forms a cornerstone in diagnosis and contributes significantly to treatment decisions. 1 GBCAs have been used in clinical practice for more than 25 years, and no detrimental long-term effects have been described. 2 However, a growing body of evidence3–15 gives rise to the concern that gadolinium (Gd) is deposited in deep grey matter of the brain, especially in the dentate nucleus (DN) and, to a much lesser degree, the basal ganglia. The apprehension arose initially from observational studies performed in adults,3–10 further supported by data in paediatric cohorts11,12 and animal experiments.13–15 Here, it is assumed that different types of GBCAs confer different risks with linear contrast agents (e.g. gadopentetate dimeglumine (Gd-DTPA, Magnevist®)) being more likely to accumulate than macrocyclic agents (e.g. gadobutrol (Gd-BT-DO3A, Gadovist®)).
The clinical implications of Gd deposition in the brain are uncertain. However, similar to the situation when nephrogenic systemic fibrosis was first described, there is growing concern about the long-term safety of GBCAs.16–18
In all except two of the original studies on cerebral Gd deposition,9,10 patients with MS were excluded. This was likely due to previous studies reporting DN hyperintensity on T1-weighted (T1w) MRI in MS patients and postulating a correlation with disease severity and duration.19–21 Yet, the concern about Gd deposition is of particularly high relevance to MS patients: they are mostly young at the age of diagnosis with a long life expectancy 22 and usually receive a high number of contrast-enhanced scans over the years. Furthermore, MS patients are potentially more prone to accumulate Gd in their brains because the blood–brain barrier may be temporarily compromised at the time when magnetic resonance (MR) scans are performed. The current discussions about the long-term safety of GBCAs have already led to anxiety and concerns in MS patients. Print and online media are frequently reporting on the perceived lack of GBCA safety, 23 further nourishing feelings of uncertainty among patients.
Against this background, we studied in an MS cohort the signal intensity increase in the DN on unenhanced T1w MRI as a surrogate marker of Gd deposition after GBCA administration. We investigated two different types of GBCAs: the linear Gd-DTPA (gadopentetate dimeglumine) and the macrocyclic Gd-BT-DO3A (gadobutrol). More precisely, we tested three hypotheses: (1) there is an increase in the dentate-to-pons signal intensity ratio (DPSIR) after multiple GBCA administrations, (2) DPSIR increases more when GBCA was administered during the preceding MR session as compared to when GBCA was not administered and (3) there is an association between the change of DPSIR and the number of GBCA dosages administered.
Patients and methods
Study design
From our research database, we retrospectively identified MS patients who participated in long-term longitudinal studies and had exclusively received either the linear Gd-DTPA at a fixed dosage of 20 mL with a concentration of 0.5 mmol/mL (10 mmol per dosage) or the macrocyclic Gd-BT-DO3A at a dosage of 0.1 mL/kg body weight with a concentration of 1.0 mmol/mL (mean 7.54 ± 1.46 mmol per dosage) according to the manufacturers’ instructions. The change of DPSIR on unenhanced magnetization-prepared rapid gradient-echo (MPRAGE) sequences between the first and the last scan and between two subsequent scans were the primary outcomes. The exposures were the total number of GBCA administrations and the type of GBCA that was administered. MS subtype, disease severity measured by the Extended Disability Status Scale (EDSS), time since diagnosis and the time between scans were considered as potential variables of relevance.
Participants
A total of 50 patients in each GBCA group who had received between two and five consecutive MR examinations were included in our study. In at least one of the examinations (other than the last) GBCA was administered. All scans were performed on 1.5 T (Siemens Sonata) or 3 T scanners (Siemens TimTrio) according to standardized protocols as part of clinical studies performed by the NeuroCure Clinical Research Center (NCRC) at Charité – Universitätsmedizin Berlin, Germany, without change of field strength during follow-up. Patients with high infratentorial lesion load affecting the DN were excluded from further analysis (three participants). Patients received MRI at pre-defined intervals with administration of GBCA independent of disease activity. All patients had a definite diagnosis of MS according to previous or current panel criteria.24–26 None of the included participants had known renal impairment. Clinical and demographic data, total number and timing of scans with and without administration of GBCA and the type of GBCA administered were retrieved from the research database.
Standard protocol approvals, registrations and patient consents
All patients provided written informed consent for participation in clinical research at NCRC including the acquisition and analysis of clinical and MRI data. The local ethics committee approved the study.
Image acquisition and processing
From our local research database native three-dimensional (3D) T1w images (MPRAGE) were downloaded for further analysis (resolution 1 × 1 × 1 mm3; TR = 2110 ms, TE = 4.38 ms, TI = 1100 ms, flip angle 15° for 1.5 T; TR = 1900 ms, TE = 3.03 ms, TI = 900 ms, flip angle 9° for 3 T; see Appendix for MRI methodology in the Supplementary Material for details). Since the DN is usually not clearly discernible on T1w and T2-weighted (T2w) images, studies in the past predominantly used a manual anatomy-based approach to extract signal intensities in the DN and pons. For a more objective and reproducible assessment, we used an established semiautomatic method for the evaluation of the deep cerebellar nuclei, that is, the SUIT tool box27–29 within SPM8 (The FIL Methods Group, Wellcome Trust Centre for Neuroimaging, London) under MATLAB (Mathworks, Inc). In this method, the cerebellum and the brainstem are automatically isolated by segmentation and cropping. The resulting images are registered to a common stereotactic space by nonlinear deformation. A DN mask was created from Diedrichsen et al.’s 29 probabilistic atlas of the deep cerebellar nuclei through binarization at a threshold of 0.75. An additional pons mask was created manually (see Figure 1 for an example of mask placement). Mean signal intensities within each mask and the DPSIR were calculated for each scan.
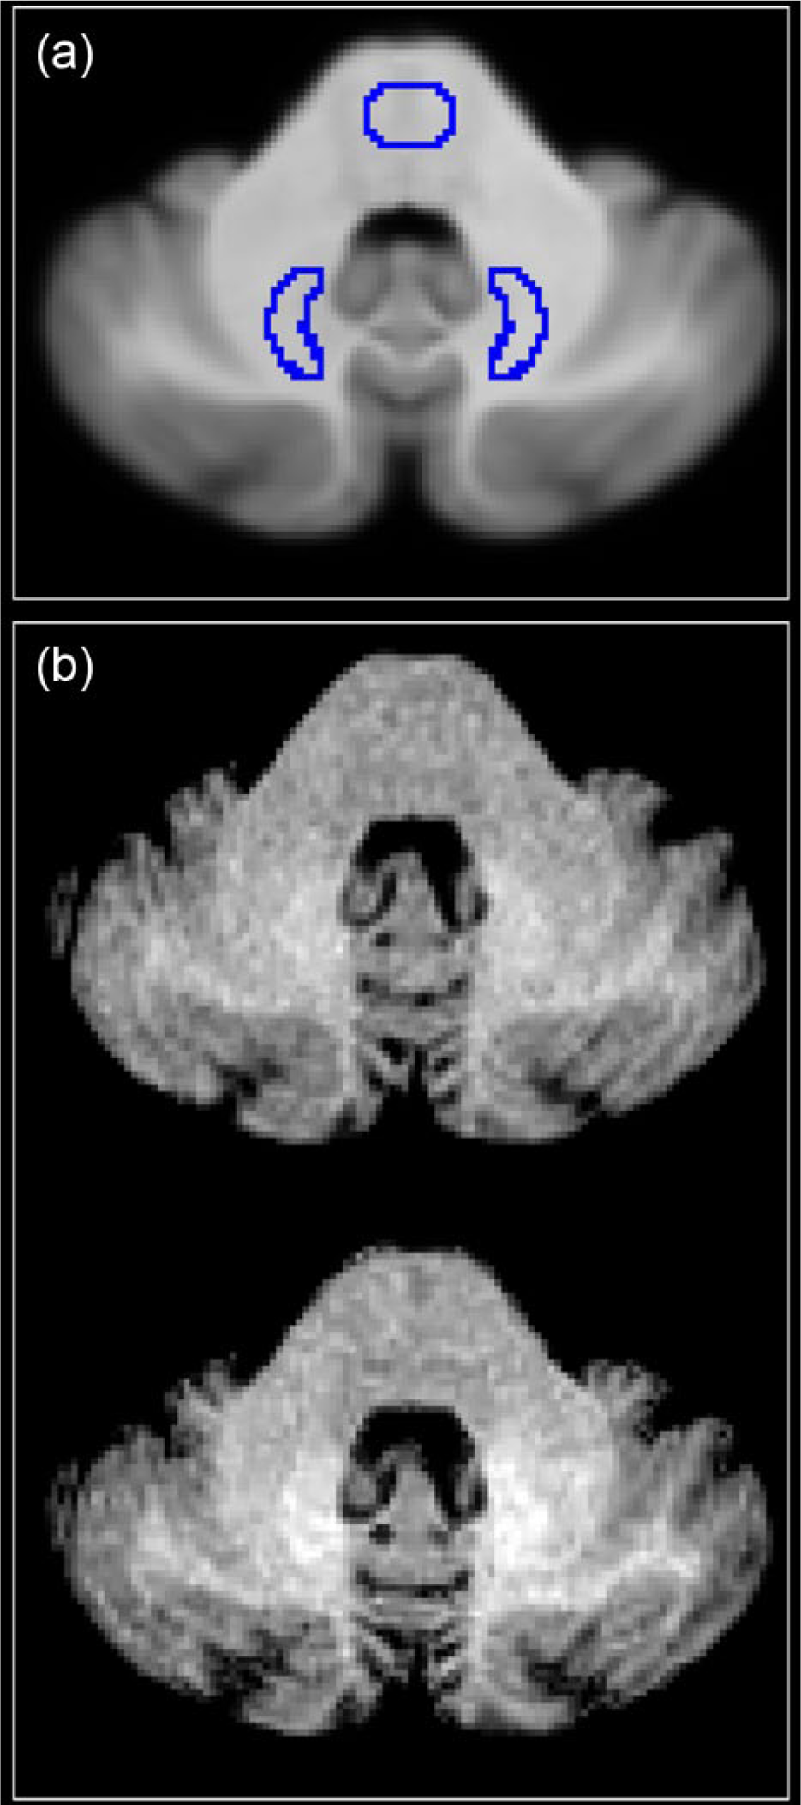
Placement of masks for the dentate nuclei and the pons. After registration to a standard space, the ratio between the signal intensity within the dentate nucleus mask and the pons mask was calculated. Dentate nuclei masks were derived from a probabilistic atlas of deep cerebellar nuclei. The pons mask was created manually. (a) The placement of the two masks in standard space. (b) Axial unenhanced MPRAGE images of an example patient on MRI visit 1 (baseline visit, upper panel) and MRI visit 5 after four administrations of Gd-DTPA (lower panel). Dentate-to-pons signal intensity ratio is higher on visit 5 than on visit 1.
The absolute difference of DPSIR between two scans was denoted by Δ[DPSIR]. The absolute difference of DPSIR between the first and last scan was denoted by Δ[DPSIR]total. We also calculated the DPSIR difference between subsequent scans. If the analysed visit followed a visit where GBCA was administered, the difference was denoted by Δ[DPSIR]Gd+, otherwise Δ[DPSIR]Gd− (see Figure 2 for an exemplary calculation). Subsequently, we compared subject specific means of Δ[DPSIR]Gd+ and Δ[DPSIR]Gd−. Additionally, we tested if there was a linear relationship between Δ[DPSIR]total and the number of GBCA administrations.
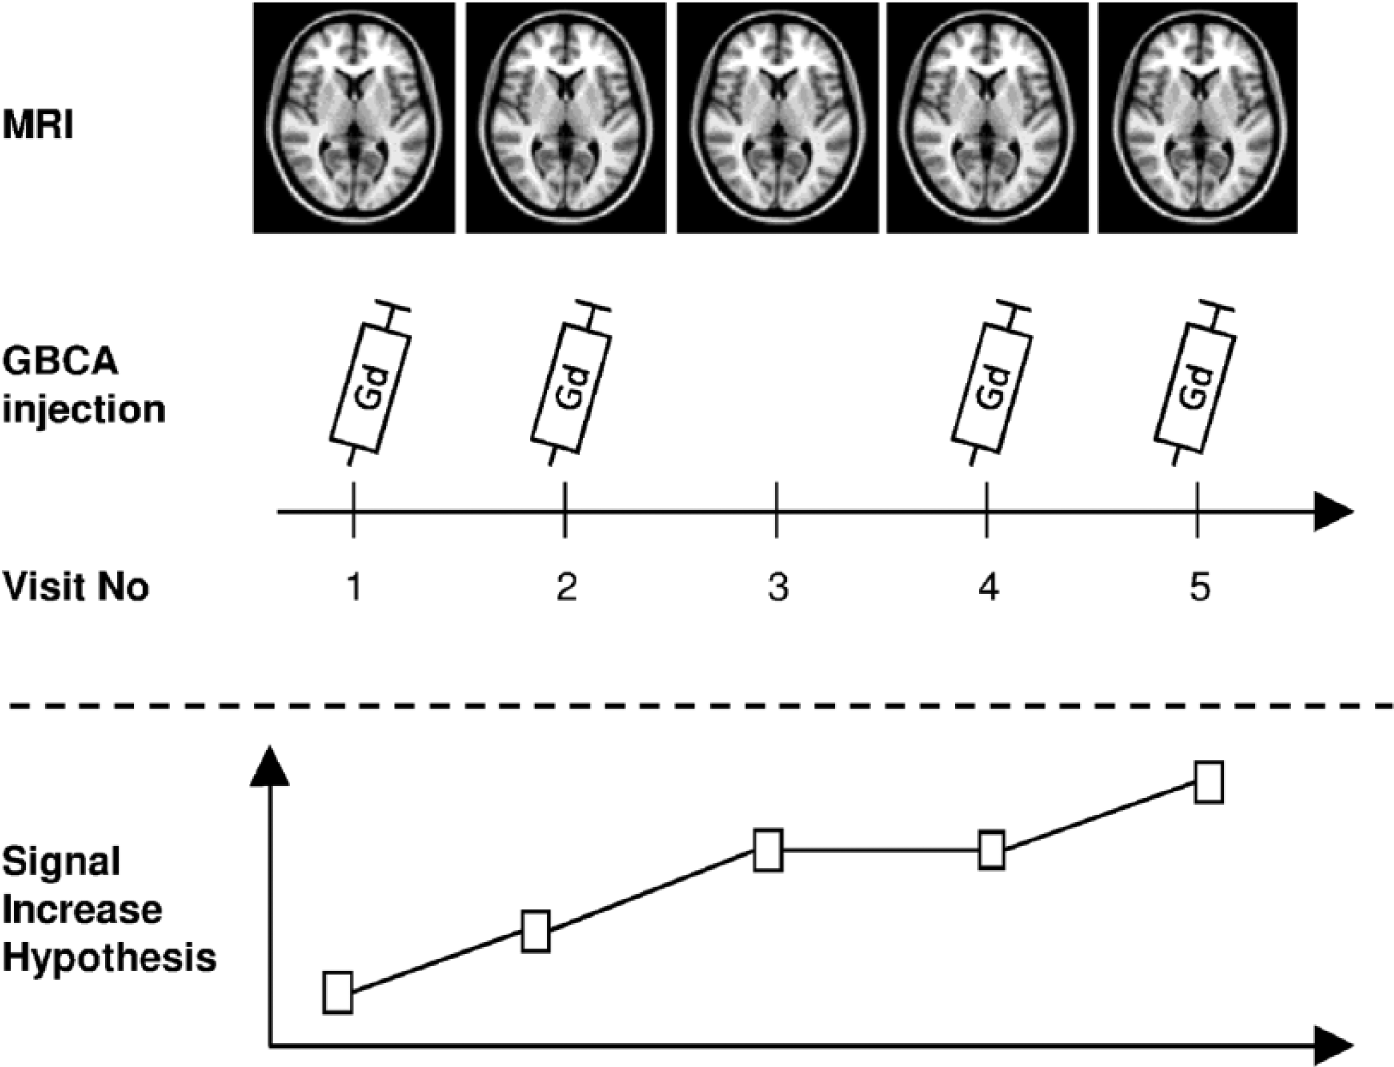
Exemplary study protocol for a representative patient with five consecutive MR scans.
Statistical analysis
Data were analysed using IBM SPSS Statistics version 21 (IBM Corp.; Armonk, NY, USA) and GraphPad Prism version 6.01 for Windows (GraphPad Software, La Jolla, CA, USA). For continuous variables, normal distribution was confirmed using the Shapiro–Wilk test. Normally distributed data are presented as mean ± standard deviation (SD); non-normally distributed continuous variables are presented as median and range. Proportions between two groups were compared using the asymptotic Pearson’s chi-square test. Student’s t-test was used to compare the means of normally distributed variables. To examine the relationship between the number of GBCA administrations and DPSIR change, a univariate general linear model with a linear contrast was employed. Consistency between the manual and the automatic methodology was estimated using the intra-class correlation coefficient and Passing–Bablok regression. 30 When the absolute effect of GBCA administration on DN T1 signal intensity was tested, a one-tail p value was used assuming a positive association between GBCA administration and DN T1 signal intensity increase. In all other cases, a two-tail p value was used. A p value <0.025 was considered statistically significant to account for the simultaneous examination of two different agents.
Results
Patient characteristics of the study population and radiological data according to type of GBCA are displayed in Table 1. Both GBCA groups were comparable regarding age and sex. MS subtype and EDSS score differed significantly between the two GBCA groups. Time between scans was approximately 1 month longer in the Gd-DTPA group as compared to the Gd-BT-DO3A group. The table also contains the number of patients in each group for which we could calculate the change of DPSIR after MR sessions with and without GBCA administration. The distribution of the total amount of GBCA administrations was not significantly different between the Gd-DTPA and the Gd-BT-DO3A group (mean, 2.08 vs 2.02; median, 2.00 in both groups; range, 1–3 in both groups; chi-square = 0.380; df = 2; p = 0.827). DPSIR at baseline was significantly higher in the Gd-DTPA group, possibly reflecting a higher number of contrast-enhanced MRI examinations before entering the study (p < 0.05 for bivariate correlation).
Patient characteristics and radiological data according to type of GBCA.
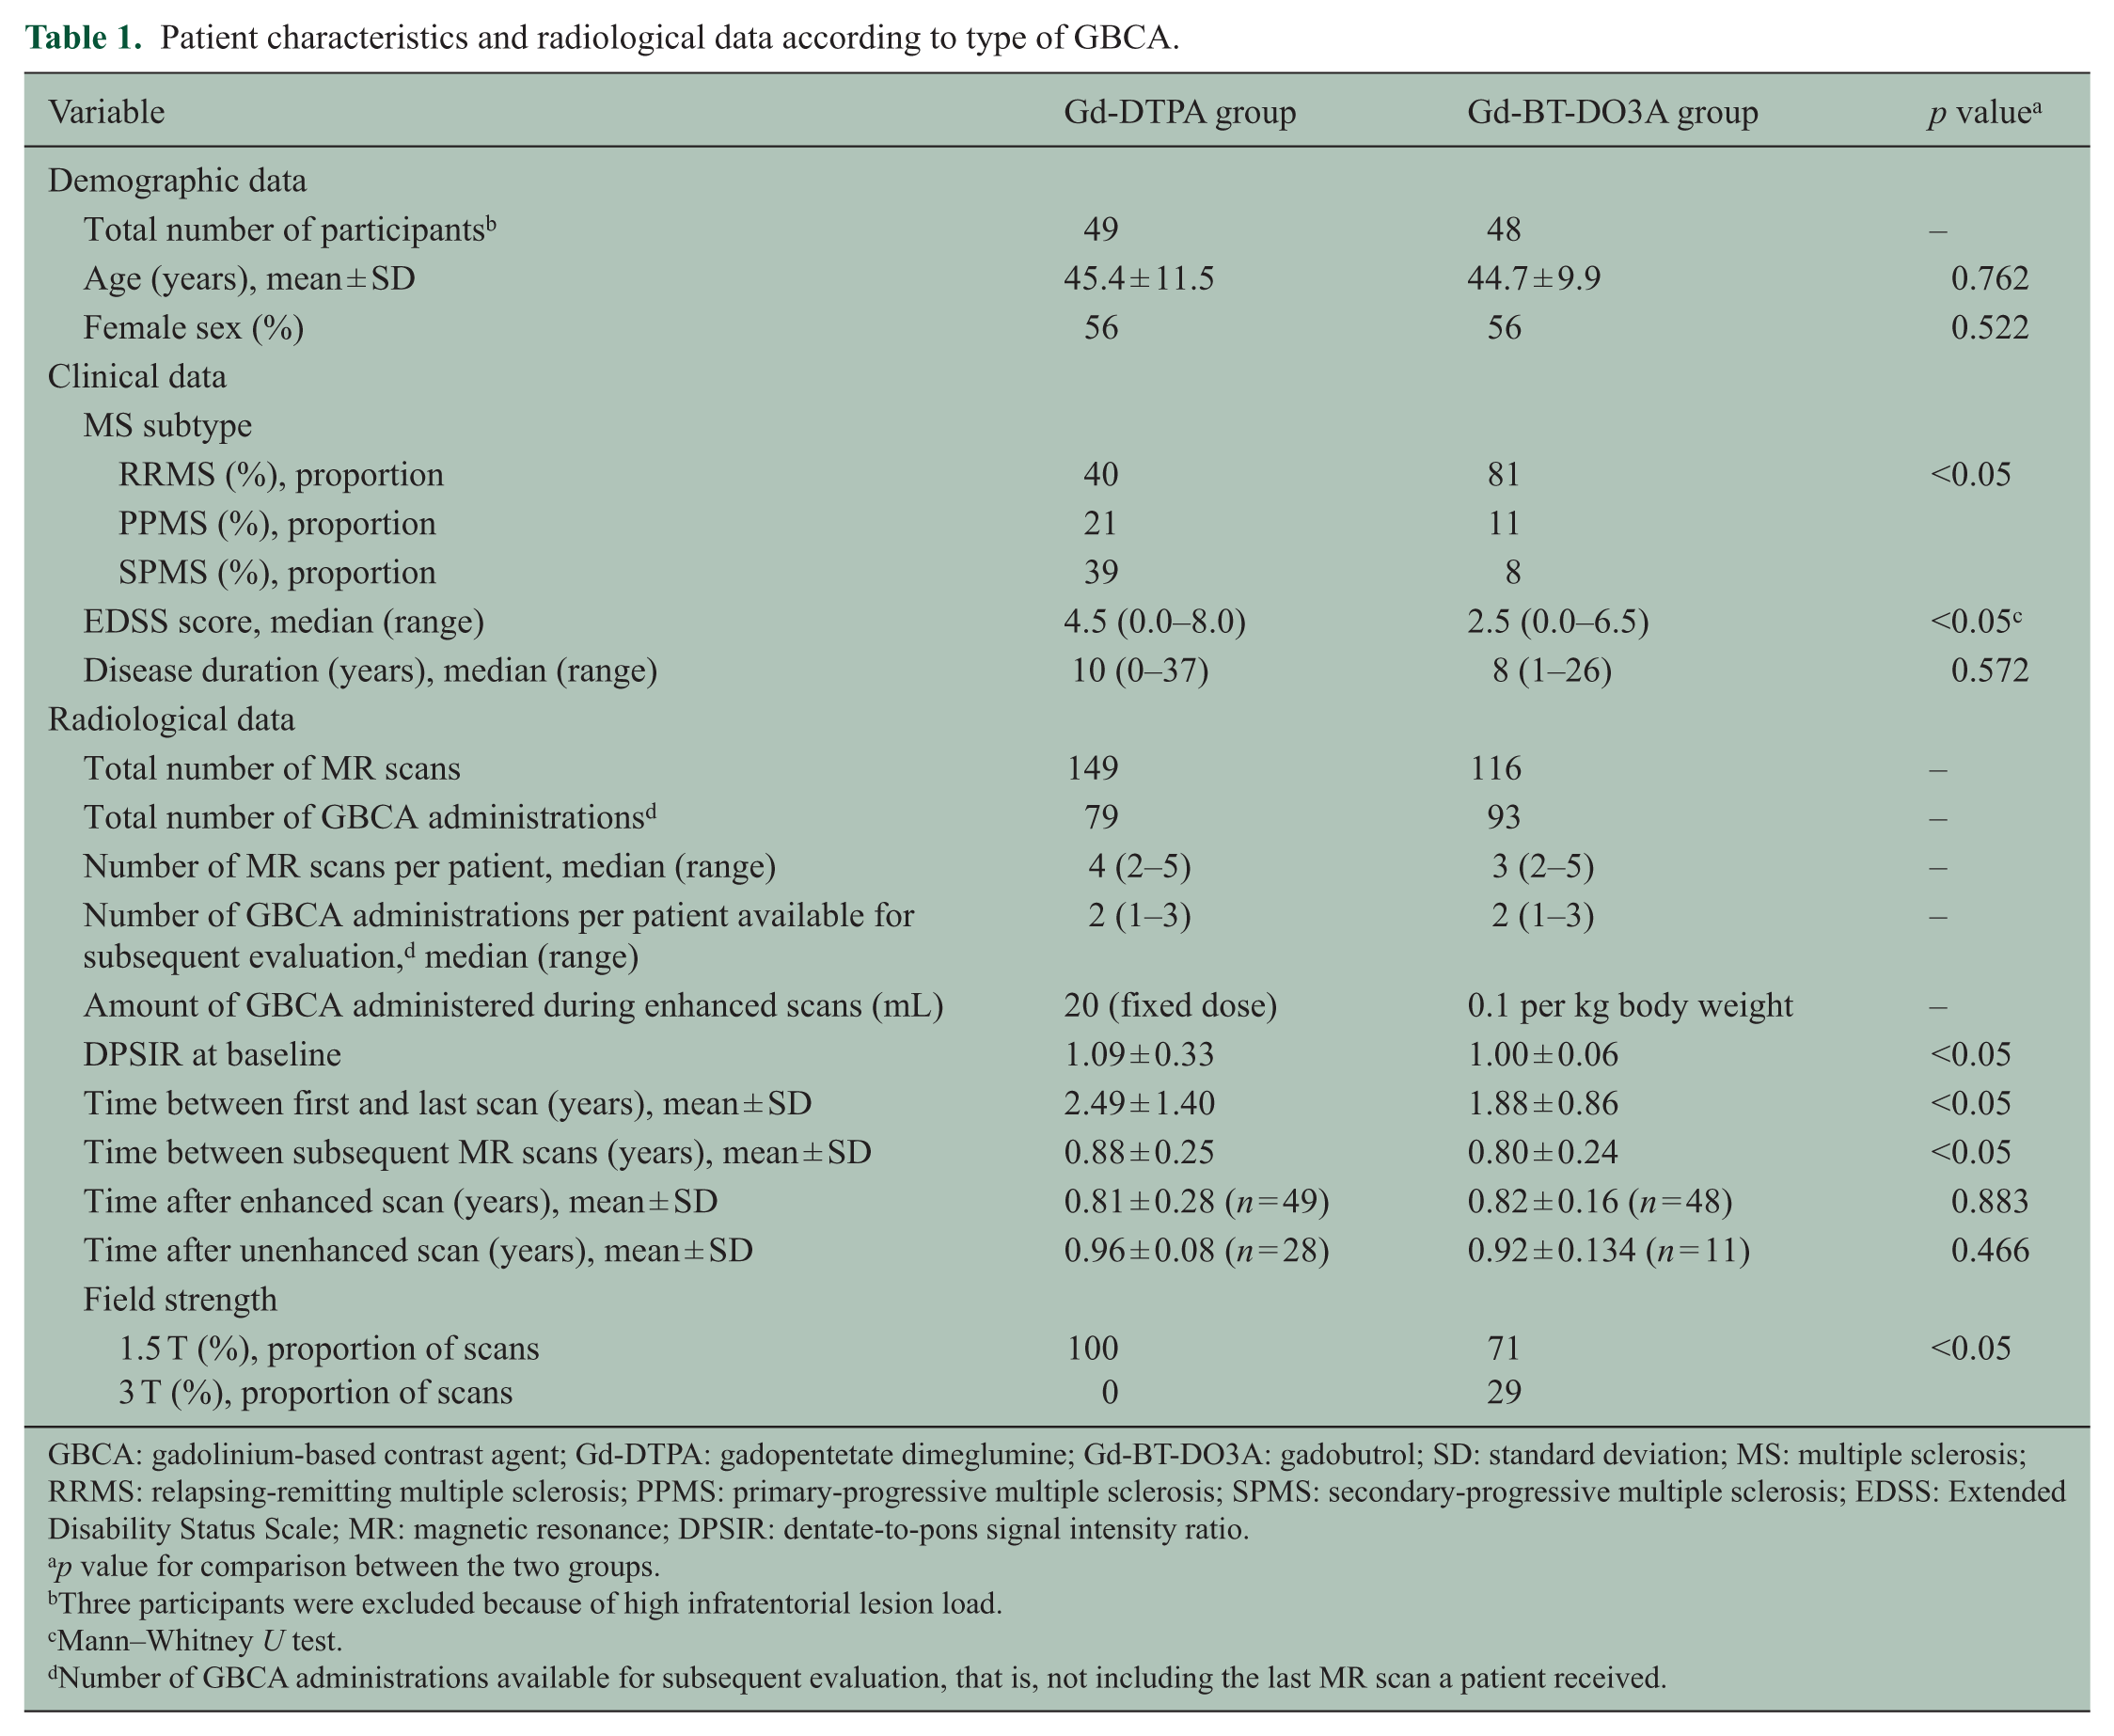
GBCA: gadolinium-based contrast agent; Gd-DTPA: gadopentetate dimeglumine; Gd-BT-DO3A: gadobutrol; SD: standard deviation; MS: multiple sclerosis; RRMS: relapsing-remitting multiple sclerosis; PPMS: primary-progressive multiple sclerosis; SPMS: secondary-progressive multiple sclerosis; EDSS: Extended Disability Status Scale; MR: magnetic resonance; DPSIR: dentate-to-pons signal intensity ratio.
p value for comparison between the two groups.
Three participants were excluded because of high infratentorial lesion load.
Mann–Whitney U test.
Number of GBCA administrations available for subsequent evaluation, that is, not including the last MR scan a patient received.
To evaluate the validity of the semi-automated approach, we compared the values of the averaged mean signal intensities of the DNs with those derived from manually created masks for 44 scans (17% of the total number of scans). Passing–Bablok regression confirmed the comparability of the two methods with the confidence intervals of the slope and the intercept encompassing one and zero, respectively (slope: 0.96 (0.79–1.14), intercept: 23.49 (−50.43 to 101.64)). The intra-class correlation coefficient for single measures in an absolute agreement two-way mixed model was 0.79, indicating good agreement.
We tested the hypothesis that DPSIR increases after multiple GBCA administrations. First, we evaluated the absolute change of DPSIR between the first and the last scan for all patients irrespective of the number of GBCA administrations they had received. Here, DPSIR increased significantly between the first and the last scan in the Gd-DTPA group (Δ[DPSIR]total = 0.009 ± 0.017; p < 0.001) but not in the Gd-BT-DO3A group (Δ[DPSIR]total = −0.002 ± 0.015; p = 0.847; Figure 3). Second, we separately studied those 31 participants that had received three dosages of GBCA. Also in these patients, DPSIR increased significantly between the first and the last scan in the Gd-DTPA group (Δ[DPSIR]total = 0.015 ± 0.011, n = 17; p < 0.001), but not in the Gd-BT-DO3A group (Δ[DPSIR]total = −0.006 ± 0.015, n = 14; p = 0.935).
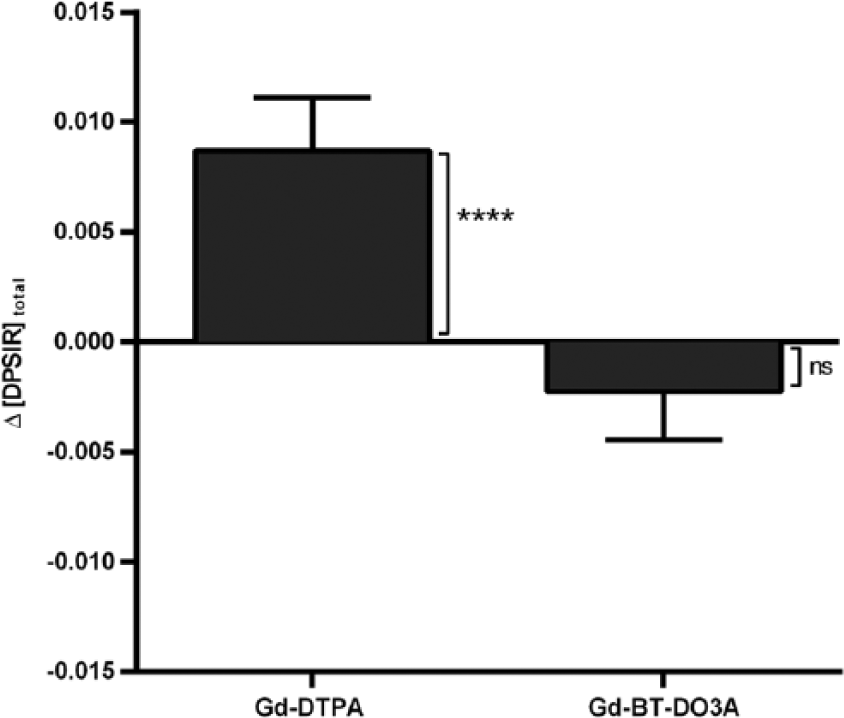
Change of the dentate-to-pons signal intensity ratio between the first and the last scan.
To investigate the effect of a single GBCA administration on DN T1 signal intensity, patient-specific means of the change of the DN T1 signal intensity ratio following an MR session with GBCA administration (Δ[DPSIR]Gd+) and without GBCA administration (Δ[DPSIR]Gd−) were calculated. In both GBCA groups, the change of DPSIR after an MR session without GBCA administration was not significantly different from zero (Gd-DTPA: −0.001 ± 0.009, p = 0.679; Gd-BT-DO3A: 0.002 ± 0.008, p = 0.856). On the other hand, the change of DPSIR after an MR session with GBCA administration was significantly higher than zero in the Gd-DTPA group, but not in the Gd-BT-DO3A group (Gd-DTPA: 0.005 ± 0.015, p = 0.018; Gd-BT-DO3A: −0.001 ± 0.009, p = 0.876). Using data from patients for which both Δ[DPSIR]Gd+ and Δ[DPSIR]Gd− were estimable, analysis by a paired t-test demonstrated that in the Gd-DTPA group, but not in the Gd-BT-DO3A group, Δ[DPSIR]Gd+ was significantly higher than Δ[DPSIR]Gd− (0.005 ± 0.015 vs −0.001 ± 0.009, n = 28; p = 0.022; Figure 4). The isolated effect of a single administration of Gd-DTPA on DPSIR was therefore estimated to be +0.005.
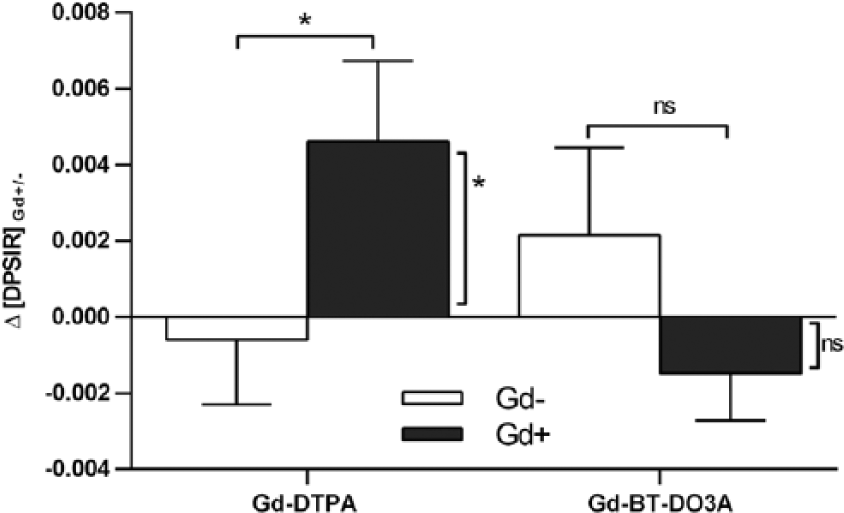
Change of the dentate-to-pons signal intensity ratio between two subsequent scans.
Our third hypothesis was that patients who received a higher number of GBCA administrations would show a larger increase in DPSIR between the first and the last scan. In the Gd-DTPA group, analysis of variance with linear contrast demonstrated a significant positive association between the number of GBCA administrations and the change of DPSIR between the first and the last scan (p = 0.017) with a contrast estimate of 0.009 (confidence interval (CI), 0.001–0.018). No significant association was seen in the Gd-BT-DO3A group (p = 0.992, Figure 5).
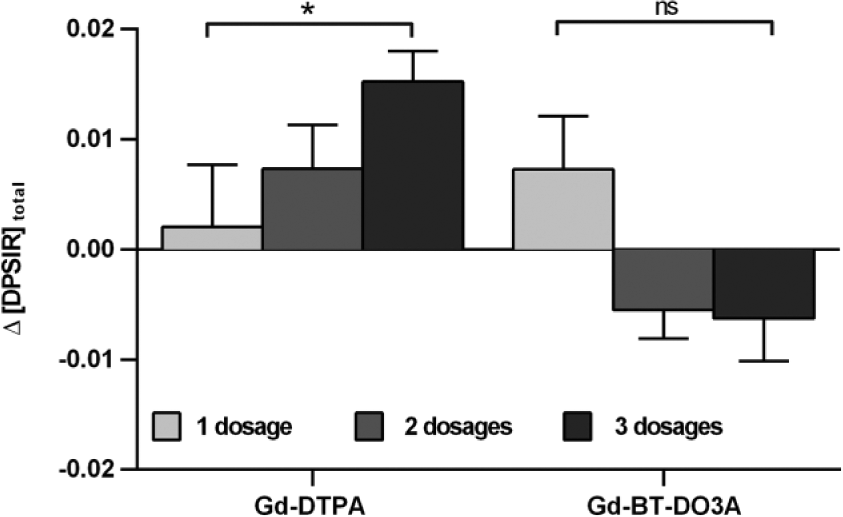
Association between the number of GBCA administrations and the change of the dentate-to-pons signal intensity ratio.
Discussion
In the context of Gd accumulation in brain tissue, MS patients have been excluded from almost all previous studies due to the hypothesis that DN T1 hyperintensity and MS disease severity and duration are positively correlated.19–21 We therefore evaluated if repeated administrations of the linear GBCA Gd-DTPA (gadopentetate dimeglumine, Magnevist®) and the macrocyclic GBCA Gd-BT-DO3A (gadobutrol, Gadovist®) are associated with increased signal intensity in the DN of MS patients on unenhanced T1w MRI. Our data show that the administration of Gd-DTPA is associated with a significant signal increase in a linear fashion. This effect can already be observed after a single administration. The effect size for the change of DPSIR was +0.005 per Gd-DTPA administration. This is in agreement with data from a study cohort of non-MS patients published by Radbruch et al., 6 who reported a DPSIR difference of +0.04 after 7.32 contrast-enhanced MRI examinations, corresponding to a DPSIR difference of +0.005 per Gd-DTPA-administration.
In contrast, the administration of Gd-BT-DO3A was not associated with an increase in DPSIR in our study. Our study hence confirms that Gd from macrocyclic GBCAs is less likely to accumulate in deep cerebral grey matter compared to that of the thermodynamically less stable linear GBCAs.5–7,17,31
Two studies have examined the effect of serial administrations of GBCAs on DN T1 hyperintensity in MS patients. Both studies were limited by a small sample size and lack of control for the natural course of the disease, which was postulated to influence the development of T1 hyperintense dentate nuclei (see discussion below).19,21 In one of these studies, Errante et al. 9 reported an association between a progressive increase in T1 signal intensity of the DN in unenhanced MR images with cumulative doses of intravenously administered gadodiamide (a linear GBCA) in 38 patients with relapsing-remitting multiple sclerosis (RRMS), which is similar to our findings. In the second study and contrary to our results, Stojanov et al. 10 reported a correlation between the cumulative dose of the macrocyclic Gd-BT-DO3A (mean number of GBCA administrations: 4.74) and signal intensity within the DN and globus pallidus on unenhanced T1w MRI in 58 patients with RRMS. The latter of the two studies was criticized for poor methodology such as different intervals of contrast administration and the determination of regions of interest solely based on anatomically consensus.32,33 Results regarding Gd-BT-DO3A could not be replicated in our study with a lower mean number of GBCA administrations of 2.02 and also not in the non-MS cohort of Radbruch et al. 7
As per protocol, in our study, GBCA was not administered during each MR session, which allowed for the first time to investigate the effect of a single GBCA administration on the change of DPSIR and to account for the confounding factor ‘progressive neurodegeneration’: disease progression could explain a DPSIR increase between the first and the last scan, but not a DPSIR increase following an MRI with GBCA administration as compared to following an MRI without GBCA administration. Additionally, in contrast to previous studies, we implemented a semi-automated image pre-processing method using an established probabilistic atlas of the deep cerebellar nuclei. 29 This enabled us to overcome some of the limitations of previous studies by obtaining reliable quantitative signal intensity measurements even if the DN was not readily visible on T1w or T2w images.
Hyperintensity of the DN on unenhanced T1w images in MS patients has been described previously by Roccatagliata et al. 19 who reported this feature in 19.3% of MS patients. They found a positive association with disease severity (EDSS score > 3.5), disease subtype (46% in secondary-progressive multiple sclerosis (SPMS) vs 8% in RRMS) and radiological markers of disease duration and activity (high lesion load on T2w MRI and brain atrophy). We also observed a significant correlation between DPSIR at baseline and disease duration, severity and subtype that might partially explain the different DPSIRs at baseline between the two GBCA groups. It has been suggested that DN hyperintensity in MS patients is caused by disease-associated neurodegeneration of cerebral and cerebellar grey matter, as well as iron deposition.21,34,35 However, an association with the number of previous GBCA administrations was not examined. A case report by Absinta et al. 20 who reported an MS patient with marked bilateral DN T1 hyperintensity who showed only mild disease symptoms but had probably received a large number of contrast-enhanced MRI examinations before points to a different explanation. In light of the results from our study, an alternative explanation could be that patients with highly active and/or long-standing disease were likely to have received a higher number of contrast-enhanced MRI scans which in turn caused the signal intensity elevations. Our results cannot, however, exclude the possibility that progressive neurodegeneration or iron deposition also contribute to the observed effect. Theoretically, there might also be interactions between the suggested mechanisms by means of Gd-induced accelerated neurodegeneration, or Gd-induced disruption of the blood–brain barrier leading to iron accumulation.
A limitation of our study is that the distribution of the field strengths (1.5 T vs 3 T) was significantly different between the two groups with 100% of patients who received Gd-DTPA and 71% of patients who received Gd-BT-DO3A being scanned at 1.5 T. While for spin-echo sequences the contrast-to-noise ratio is higher at 3 T as compared to 1.5 T which would have led to a higher sensitivity in detecting signal differences in the Gd-BT-DO3A group in our study, this is not necessarily the case for MPRAGE sequences due to the employed inversion recovery pulse. Unenhanced grey-to-white matter contrast would even be expected to decrease with higher field strengths which could have favoured missing signal changes in the Gd-BT-DO3A group. The mean dosage used for Gd-BT-DO3A was smaller compared to Gd-DTPA which could also have contributed to the lack of detection of signal changes in the Gd-BT-DO3A group. We therefore have performed only GBCA-specific analyses and do not report any between-group comparisons. Additionally, MS subtype, EDSS score and time between scans differed between the two GBCA groups, but there was no evidence in post hoc analyses that these imbalances influenced the results of our study. For the investigation of our hypothesis, we have limited our analysis to only one anatomic region (DN) because the DN has been shown to be the most affected region.
In conclusion, in our cohort, the administration of the linear Gd-DTPA is associated with T1 signal hyperintensity of the DN of MS patients on unenhanced MRI, most likely reflecting Gd deposition. This effect was not observed for the macrocyclic Gd-BT-DO3A. However, despite this more favourable result for Gd-BT-DO3A, our study cannot exclude the possibility that Gd-BT-DO3A accumulates in the DN or other brain regions. Since long-term clinical effects of cerebral Gd deposition are still unknown, the indication for GBCA administration should be strict. Given the current data, neurologists should order contrast-enhanced MRI only after careful consideration of benefits and risks, and radiologists should give preference to macrocyclic agents, as these agents seem to be less prone to accumulate in cerebral grey matter and seem to have a better safety profile.
Footnotes
Acknowledgements
F.P. and M.S. contributed equally to the manuscript and share senior authorship.
Declaration of Conflicting Interests
The author(s) declared the following potential conflicts of interest with respect to the research, authorship and/or publication of this article: J.B.-S. has received speaking fees and travel grants from Bayer Healthcare, Sanofi-Aventis/Genzyme and Teva Pharmaceuticals, outside the submitted work. J.D. reports grants, personal fees and non-financial support from Bayer Healthcare and Novartis; personal fees and non-financial support from Biogen; and personal fees from Genzyme, Teva and Merck-Serono, outside the submitted work. J.W. – CEO of MIAC AG, Switzerland – has served on advisory boards for Biogen, Genzyme and Novartis and has received research grants from Novartis and speaker honoraria from Bayer, Novartis, Teva and Biogen. J.W. was supported by the Deutsche Forschungsgemeinschaft, the German ministry of education and research (BMBF/KKNMS) and the German ministry of economy (BMWi). A.U.B. reports personal fees and non-financial support from Teva, Nexus, Biogen, Novartis and Motognosis, outside the submitted work; A.U.B. is cofounder and holds stock options in Motognosis. F.P. reports grants, personal fees and non-financial support from Bayer, Biogen, Alexion, Chugai, Medimmune, Teva, Merck, Novartis and Genzyme and grants from Deutsche Forschungsgemeinschaft, European Union FP7 and German ministry of education and research (BMBF), outside the submitted work. L.S., C.C. and M.S. declare that there are no conflicts of interest.
Funding
The author(s) disclosed receipt of the following financial support for the research, authorship and/or publication of this article: This work was supported by Deutsche Forschungsgemeinschaft (DFG Exc 257 to F.P.). L.S. is a participant in the BIH-Charité Clinical Scientist Program funded by the Charité – Universitätsmedizin Berlin and the Berlin Institute of Health.