
Abstract
Background:
‘No evidence of disease activity’ (NEDA), defined as absence of magnetic resonance imaging activity (T2 and/or gadolinium-enhanced T1 lesions), relapses and disability progression (‘NEDA-3’), is used as a comprehensive measure of treatment response in relapsing multiple sclerosis (RMS), but is weighted towards inflammatory activity. Accelerated brain volume loss (BVL) occurs in RMS and is an objective measure of disease worsening and progression.
Objective:
To assess the contribution of individual components of NEDA-3 and the impact of adding BVL to NEDA-3 (‘NEDA-4’)
Methods:
We analysed data pooled from two placebo-controlled phase 3 fingolimod trials in RMS and assessed NEDA-4 using different annual BVL mean rate thresholds (0.2%–1.2%).
Results:
At 2 years, 31.0% (217/700) of patients receiving fingolimod 0.5 mg achieved NEDA-3 versus 9.9% (71/715) on placebo (odds ratio (OR) 4.07; p < 0.0001). Adding BVL (threshold of 0.4%), the respective proportions of patients achieving NEDA-4 were 19.7% (139/706) and 5.3% (38/721; OR 4.41; p < 0.0001). NEDA-4 status favoured fingolimod across all BVL thresholds tested (OR 4.01–4.41; p < 0.0001).
Conclusion:
NEDA-4 has the potential to capture the impact of therapies on both inflammation and neurodegeneration, and deserves further evaluation across different compounds and in long-term studies.
Introduction
Combined disease-status assessments that include outcomes capturing both clinical and magnetic resonance imaging (MRI)-defined disease activity and worsening are increasingly used to monitor disease evolution and to assess the overall impact of disease-modifying therapies (DMTs) in patients with multiple sclerosis (MS). 1 Such combined assessments have been applied in post hoc analyses of clinical studies and may have value for guiding clinical practice.1–7 Absence of disease activity, initially termed ‘disease-activity-free’ (DAF), 2 and now referred to as ‘no evidence of disease activity’ (NEDA), 8 has been defined using three measures: relapses, active MRI lesions (both new or enlarged T2 lesions and gadolinium-enhanced (Gd+) lesions) and disability progression. This NEDA definition (NEDA-3) is weighted towards focal inflammatory disease activity, while other disease pathologies, such as diffuse damage and neurodegeneration, are captured to a lesser extent.
Different pathophysiological mechanisms contribute to brain volume loss (BVL), which is evident even in the earliest stages of MS, 9 and may go unnoticed particularly over short intervals. BVL correlates with, and is predictive of, disability progression and cognitive decline in the long term.10–14 In the absence of possible confounding factors, 9 BVL in MS is the result of both destructive focal white matter lesions and less easily detected pathological features, for example, lesions in the grey matter and diffuse damage in normal-appearing white and grey matter.15–18 It has been shown that the mean annual rate of BVL in patients with MS (typically 0.5%–1.35% per year) is faster than in comparable age-adjusted healthy individuals (0.1%–0.3%). 9
Addition of BVL to NEDA-3 might provide a more comprehensive assessment of disease activity and progression. In phase 3 trials, fingolimod 0.5 mg consistently reduced the mean rate of BVL in patients with MS by approximately one-third versus placebo or intramuscular interferon (IFN) β-1a.19–21 In a pooled analysis of the two large placebo-controlled phase 3 studies of fingolimod, we interrogated the original NEDA-3 assessment to determine the contribution of each MRI component and, through incorporation of BVL, to propose a new four-parameter measure, NEDA-4.
Methods
Analysis population
Disease activity and worsening were examined in a population of patients with relapsing–remitting MS (RRMS), pooled from the 2-year, phase 3, placebo-controlled FREEDOMS and FREEDOMS II trials.19,20 The study designs and overall results for FREEDOMS (ClinicalTrials.gov Identifier, NCT00289978) and FREEDOMS II (ClinicalTrials.gov Identifier, NCT00355134) have been reported.19,20 FREEDOMS and FREEDOMS II were double-blind, randomized, parallel-group clinical trials comparing the efficacy and safety of two oral doses of fingolimod (0.5 mg and 1.25 mg) with placebo. Key inclusion criteria were: adults aged 18–55 years with RRMS, at least one relapse in the previous year (or at least two in the previous 2 years) and an Expanded Disability Status Scale (EDSS) score of 0–5.5. Patients underwent MRI at screening, month 6, month 12 and month 24. In these post hoc analyses, disease activity and worsening after 2 years of treatment were compared in patients receiving the approved dose of fingolimod (0.5 mg) with those receiving placebo. For event analysis of the individual and combined components of NEDA-4, the pooled FREEDOMS and FREEDOMS II population was used, including fingolimod 0.5 mg and 1.25 mg, and placebo (full analysis set; N = 2355). Patients from the full analysis set with available BVL assessments (n = 1731) were used for assessing disease activity by epoch when defined using only the annualized rate of BVL (AR-BVL).
Procedures
The following definitions were used for the individual components of NEDA-3: (1) relapses – clinically confirmed relapse (the appearance of a new, or worsening of previously stable, neurological abnormality, present for at least 24 hours and occurring in the absence of fever or infection, confirmed within 7 days of the onset of symptoms); (2) focal MRI activity – new or enlarged T2 lesions and/or Gd+ lesions; and (3) confirmed disability progression (CDP) – an increase in EDSS score of 1.5 points from a baseline score of 0, of 1.0 point from a baseline score of at least 1.0 or of 0.5 points from a baseline score of greater than 5.0 and confirmed after 3 or 6 months. MRI scans were performed at screening and at months 6, 12 and 24; new lesion activity on any scan during the 2-year period was considered evidence of MRI disease activity. Annual BVL thresholds evaluated for inclusion in the NEDA-4 assessment were based on annual percentage brain volume change (PBVC) between baseline and the month-24 scan. The AR-BVL used in subsequent assessments is defined as ((PBVC/100+1)^(365.25/days)–1)*100, where ‘PBVC’ is measured using Structural Image Evaluation using Normalization of Atrophy (SIENA) methodology with 2D non-enhanced T1 weighted MRI scans and ‘days’ represents the number of days between the two scans. This formula adjusts for the exact duration between two scans and converts PBVC derived from SIENA (in this case obtained over 2 years) into a mean AR-BVL (see Online Supplement, eMethods). The following annual BVL thresholds were included in the analysis: 0.2% (which is approximately the mean annual BVL rate in healthy controls of similar age to those with MS, using the SIENA method); 0.4% (which is above the mean rate in healthy controls, but below the range of mean rates reported for patients with MS (0.5%–1.35%); and 0.6% and 1.2% (values that are within the range of reported rates of BVL seen among untreated patients with MS). 9
Definitions of NEDA
NEDA: refers to the general concept of no evidence of disease activity.
NEDA-3: refers to no evidence of relapses, active MRI lesions (both new or enlarged T2 lesions and Gd+ lesions) and 3-month CDP (defined as an increase in EDSS score of 1.5 points from a baseline score of 0, of 1.0 point from a baseline score of 1.0 or more or of 0.5 points from a baseline score of greater than 5.0). 2 Variations of NEDA-3 definitions were used to assess the contribution of individual components and are defined in the text and figures/tables.
NEDA-4: based on results of the interrogation of NEDA-3 components and the outcome of the hierarchical analysis of NEDA-3 (see next section), NEDA-4 was defined as no evidence of relapses, new or enlarged T2 lesions and 6-month CDP (as defined in NEDA-3, above), and a mean AR-BVL of less than 0.4% (NB: other AR-BVL thresholds were tested in NEDA-4).
Statistical analysis
Hierarchical analysis of patient subsets according to individual disease activity criteria was used to assess the contribution of the three different components within the NEDA measure using the following hierarchy: new or enlarged T2 lesions, Gd+ lesion activity, relapses; disability progression (6-month confirmation). In the analysis, patients who had an event for one outcome were removed/not evaluable from that point onwards for any other outcomes, for example, if a patient had a new or enlarged T2 lesion, the patient was removed from subsequent evaluations for Gd+ lesion activity. When patients had both new T2 and new Gd+ lesion activities simultaneously, they were counted as having T2 lesion activity because patients can be counted in one area only. Logistic regression analysis was used to detect a treatment effect of fingolimod on evidence of disease activity when varying the MRI and disability components of NEDA, when determining the proportion of patients with an AR-BVL less than the annual BVL threshold investigated and when determining the proportion of patients achieving NEDA-4. Odds ratios (ORs) were derived from the associated logistic regression analysis. Summary statistics of incident rates of disease activity in patient subsets analysed according to the individual components of NEDA-4 used the pooled population full analysis set (N = 2355). The same cohort with available BVL assessments at 6, 12 and 24 months (n = 1731) was also used for assessing the pattern of disease activity defined using only AR-BVL. The ‘number needed to treat’ (NNT) was calculated to assess the effectiveness of sequential addition of the four components of the NEDA-4 measure (NNT = 1/absolute risk reduction or (Pa−Pc), where ‘Pa’ and ‘Pc’ represent the rates of events in the active treatment intervention group (fingolimod) and control group (placebo), respectively.
Data censoring for patients with missing values
Patients with missing assessments who had any evidence of disease activity during the study were not considered disease-free. Patients who had no activity but missing assessments were excluded from the analysis (i.e. data censored, ‘available data’ analysis). 2 Subsequently, sample sizes in the data presented in figures and tables may vary owing to data censoring.
Results
Patient demographics
Baseline demographic and clinical characteristics of patients from the two studies included in the present analysis have been reported previously,19,20 and were generally comparable and consistent with a typical population of patients with active RRMS (Supplementary Table 1). Of the 2355 patients in the pooled population, 783 were randomized to fingolimod 0.5 mg (the only approved dose), 799 to fingolimod 1.25 mg and 773 to placebo.
Hierarchical analysis and revisions of the components of the NEDA-3 measure
A hierarchical analysis of the components of NEDA-3 using the placebo and fingolimod 0.5 mg patients in the pooled population (n = 1556) revealed that T2 lesion activity contributed the highest number of events, followed by relapses and 6-month CDP. There was minimal additional contribution of Gd+ lesion activity to the overall measure. Nearly every Gd+ lesion was represented by a new or enlarged T2 lesion; of 154 patients with no new or enlarged T2 lesions, only one had Gd+ lesion activity (Table 1). We therefore excluded this measure from further analyses, a revision that did not affect the proportion of patients with NEDA-3 (Supplementary Figure 1). The proportion of patients with NEDA-3 increased slightly when 3-month CDP was replaced with the more robust criterion of 6-month CDP, but the treatment effect of fingolimod was preserved (Supplementary Figure 1).
Hierarchical analysis of patient subsets fulfilling individual disease activity criteria in the pooled FREEDOMS/FREEDOMS II population.
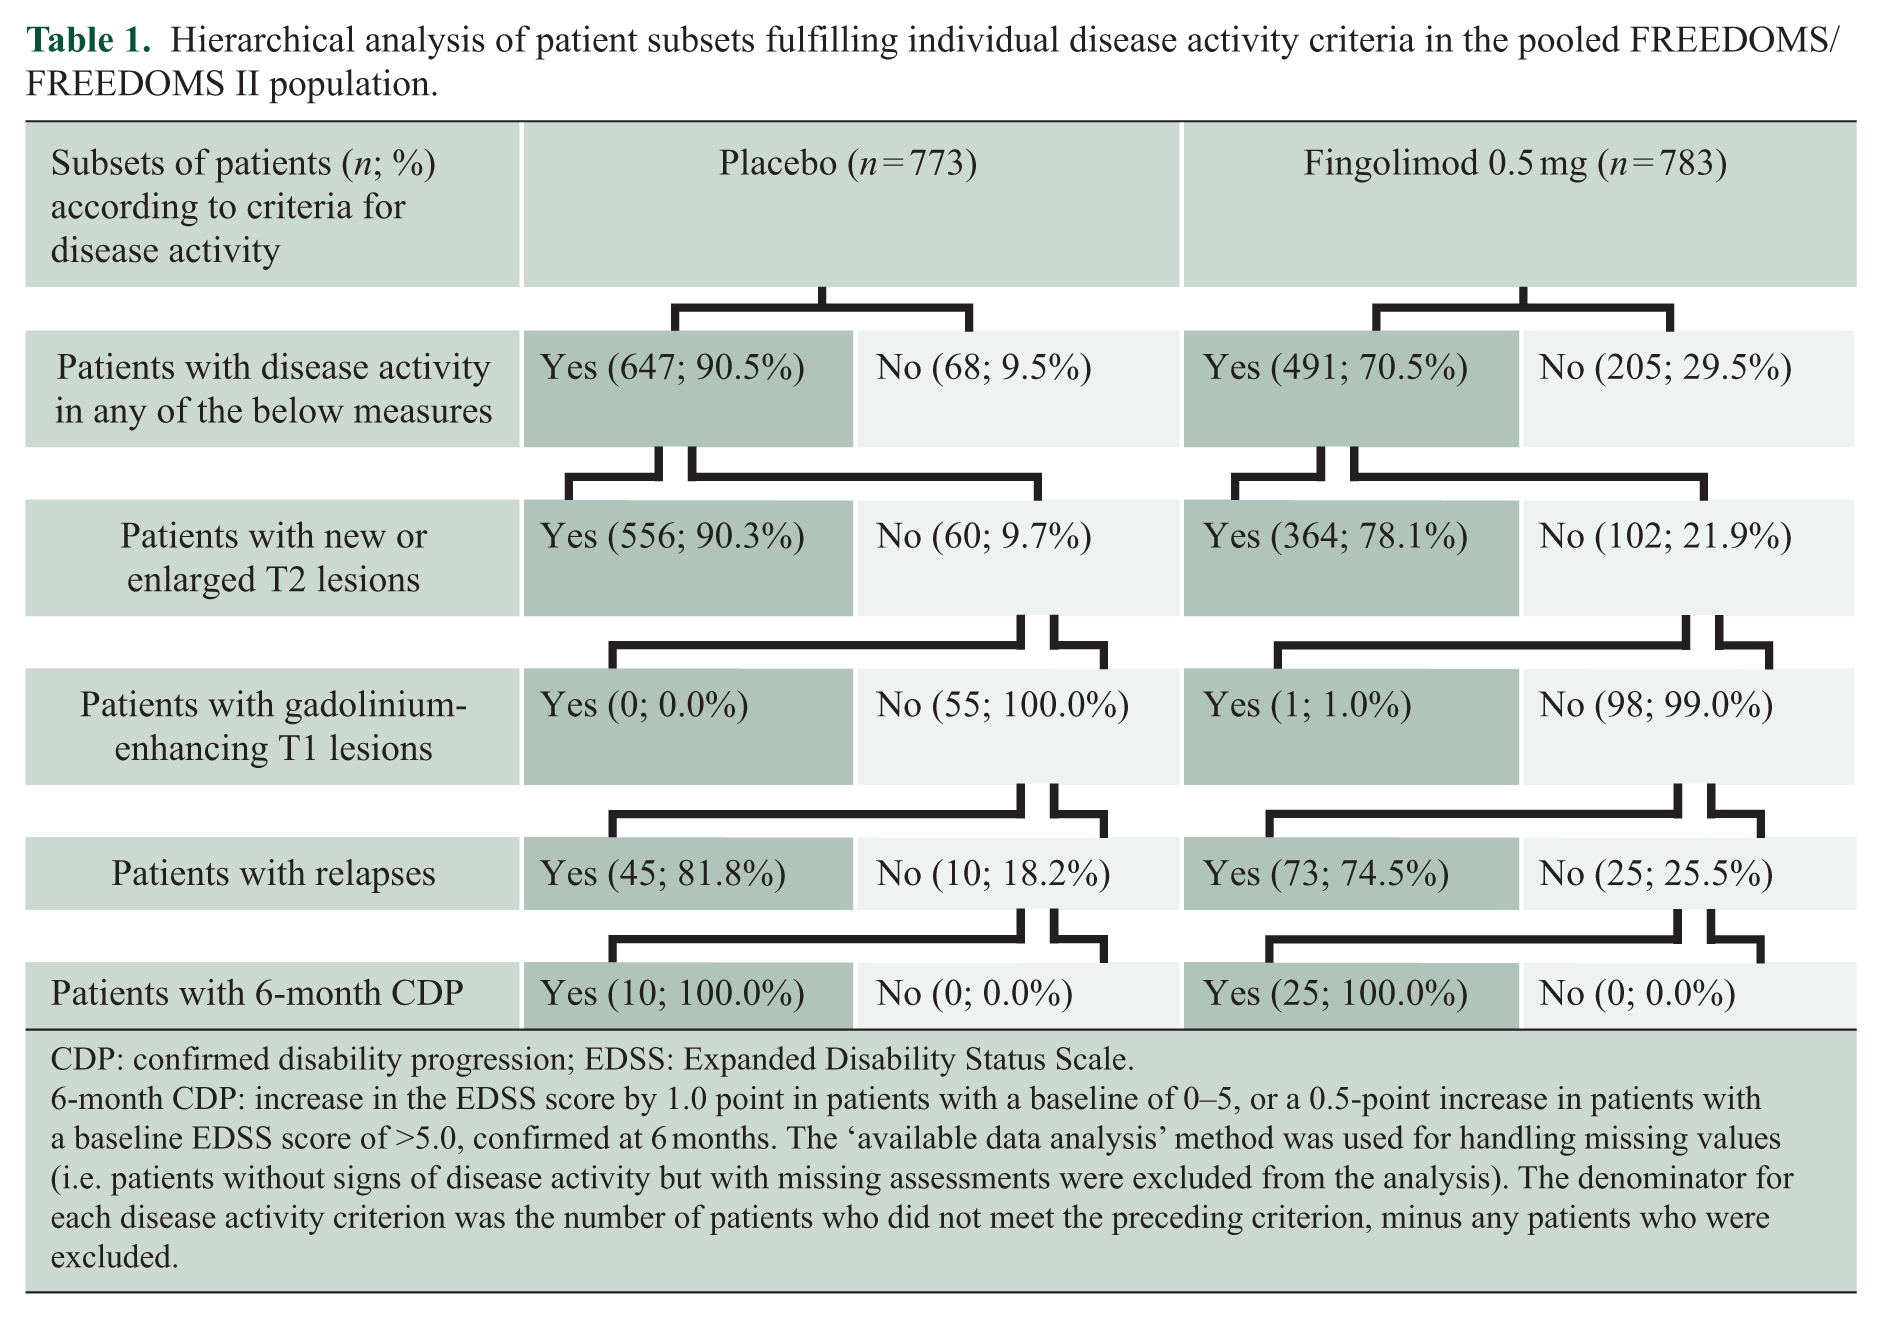
CDP: confirmed disability progression; EDSS: Expanded Disability Status Scale.
6-month CDP: increase in the EDSS score by 1.0 point in patients with a baseline of 0–5, or a 0.5-point increase in patients with a baseline EDSS score of >5.0, confirmed at 6 months. The ‘available data analysis’ method was used for handling missing values (i.e. patients without signs of disease activity but with missing assessments were excluded from the analysis). The denominator for each disease activity criterion was the number of patients who did not meet the preceding criterion, minus any patients who were excluded.
Adding BVL to the NEDA-3 assessment and validation of NEDA-4
Over 2 years, the mean AR-BVL among patients with available scans treated with fingolimod 0.5 mg was 0.43% in the pooled population (standard deviation (SD), 0.65%; median, 0.35%; n = 623). This rate was between the ranges of mean annual rates reported for healthy individuals (0.1%–0.3%) 9 and for patients with MS (0.5%–1.35%) using the same analysis method (SIENA), 9 and was lower than the mean AR-BVL observed in patients on placebo (mean, 0.66%; SD, 0.77%; median, 0.51%; n = 579; p < 0.0001).
By 6 months, 838 (48.4%) of 1731 patients in the pooled FREEDOMS/FREEDOMS II population with available scans already had an AR-BVL of at least 0.4% (i.e. ⩾0.2% over 6 months). Among these individuals, an AR-BVL of at least 0.4% was subsequently confirmed in 606 (72.3%) patients at 12 months, and in 593 (70.8%) at 24 months. Similarly, of 848 patients who were identified at 12 months to have an AR-BVL of at least 0.4%, 639 (75.4%) were subsequently confirmed as having an AR-BVL of at least 0.4% at 24 months (Supplementary Table 2). As expected, the number of patients with available scans fulfilling this criterion increased with less stringent BVL thresholds, but the relative advantage of fingolimod 0.5 mg (n = 623) versus placebo (n = 580) remained unchanged (p = 0.0003 to p < 0.0001; Figure 1).
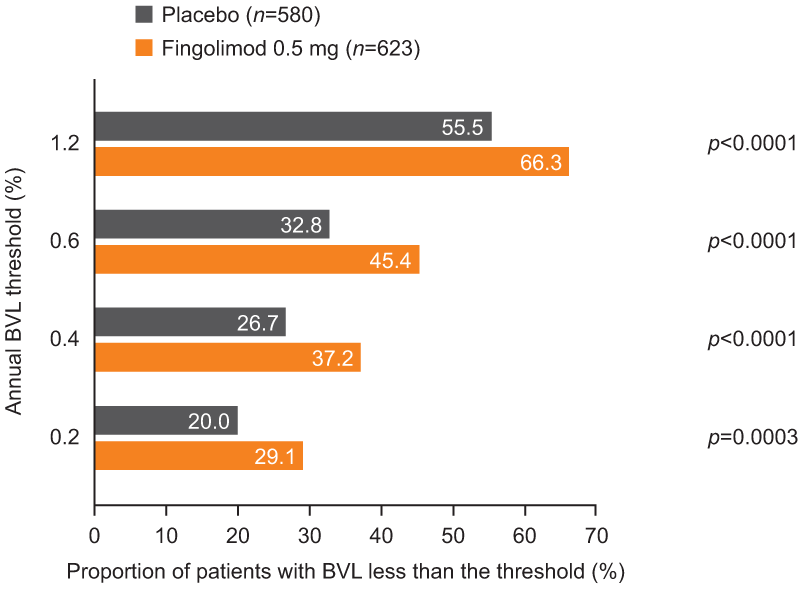
Proportion of patients by treatment group, exceeding different annual BVL thresholds in the pooled FREEDOMS/FREEDOMS II population.
NEDA-3 status was achieved by 31.0% of patients on fingolimod 0.5 mg (n = 783) and 9.9% on placebo (n = 773; OR, 4.07; confidence interval (CI) 3.04–5.46; p < 0.0001; Supplementary Figure 1). Adding BVL to the definition resulted in a lower number of patients achieving NEDA-4 (Figure 2): using the 0.4% annual BVL threshold, 19.7% of patients with available scans achieved NEDA-4 on fingolimod 0.5 mg (n = 706) and 5.3% on placebo (n = 721; OR, 4.41; CI 3.03–6.42; p < 0.0001; Figure 3). Over 24 months, approximately equal proportions of patients receiving fingolimod and placebo (N = 2355) failed NEDA-4 by new T2 lesion activity or by exceeding the threshold of 0.4% annual BVL (12.7% and 11.9% respectively; Table 2). Notably, in patients with 6-month CDP at either 1 or 2 years (n = 202 and n = 271), a proportion accrued disability without apparent lesion activity or relapses, but with a brain AR-BVL of 0.4% or more (n = 18/202 (8.9%) at 1 year; n = 23/271 (8.5%) at 2 years; Table 2).
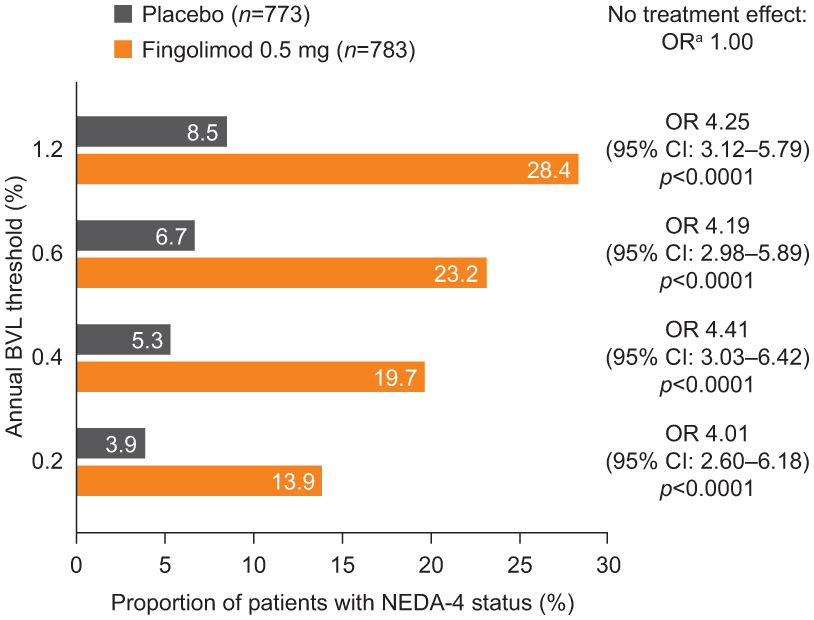
Impact of different annual BVL thresholds on the proportions of patients achieving NEDA-4; in the pooled FREEDOMS/FREEDOMS II population.
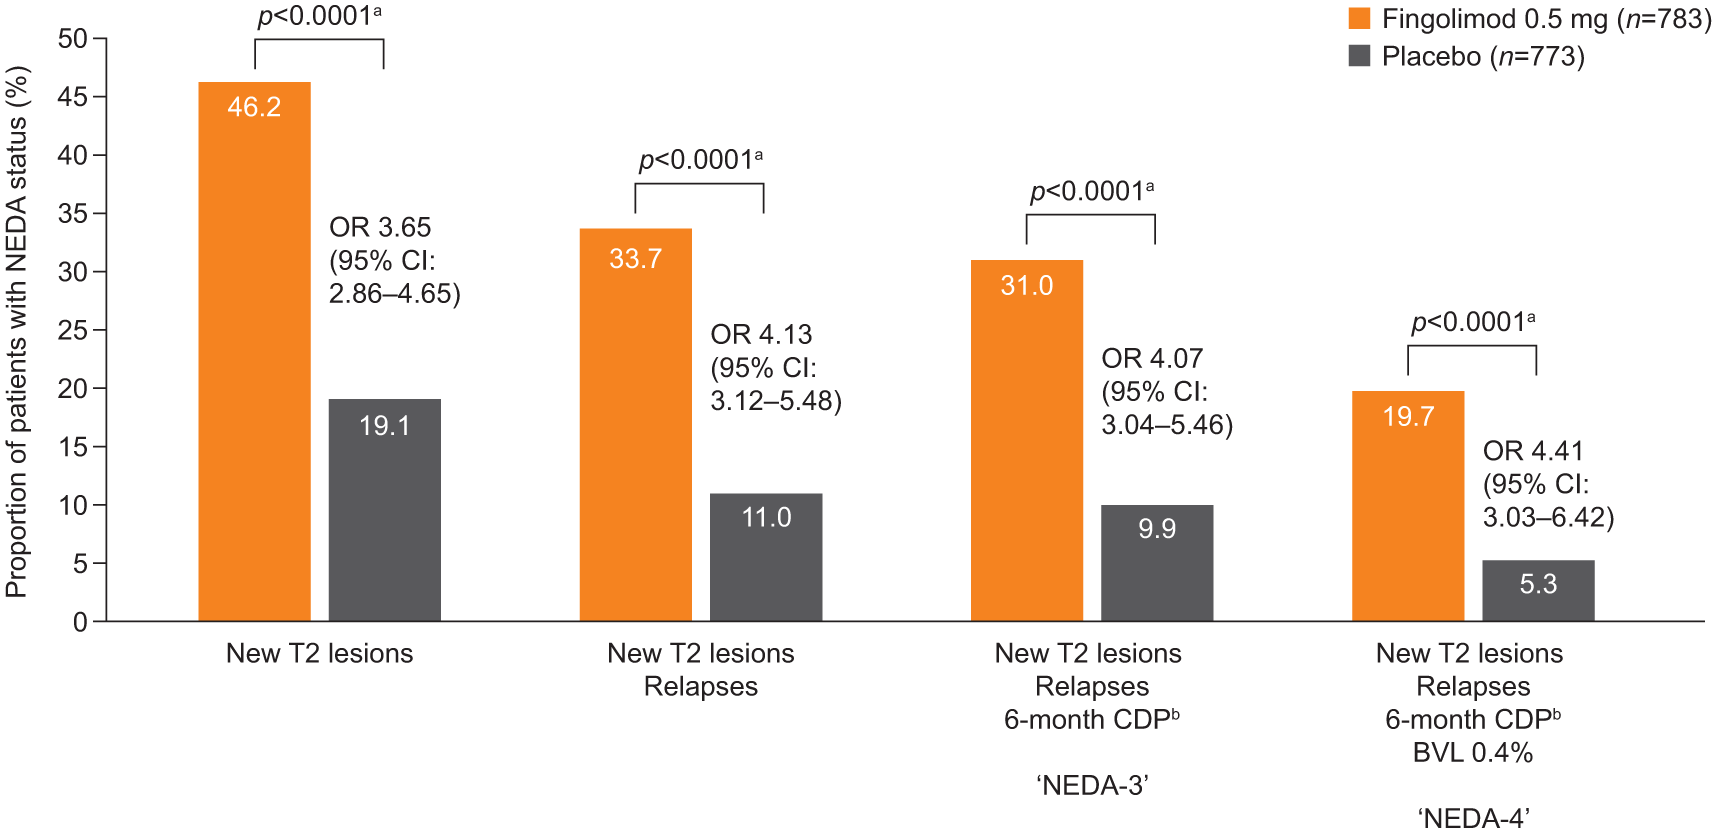
Relative contribution of the individual components of NEDA-4 on the proportion of patients achieving NEDA.
Patient subsets according to occurrence of events in individual components of disease activity definition, either in combination with any other disease activity component or as a unique event, over 24 months in the pooled FREEDOMS/FREEDOMS II population.
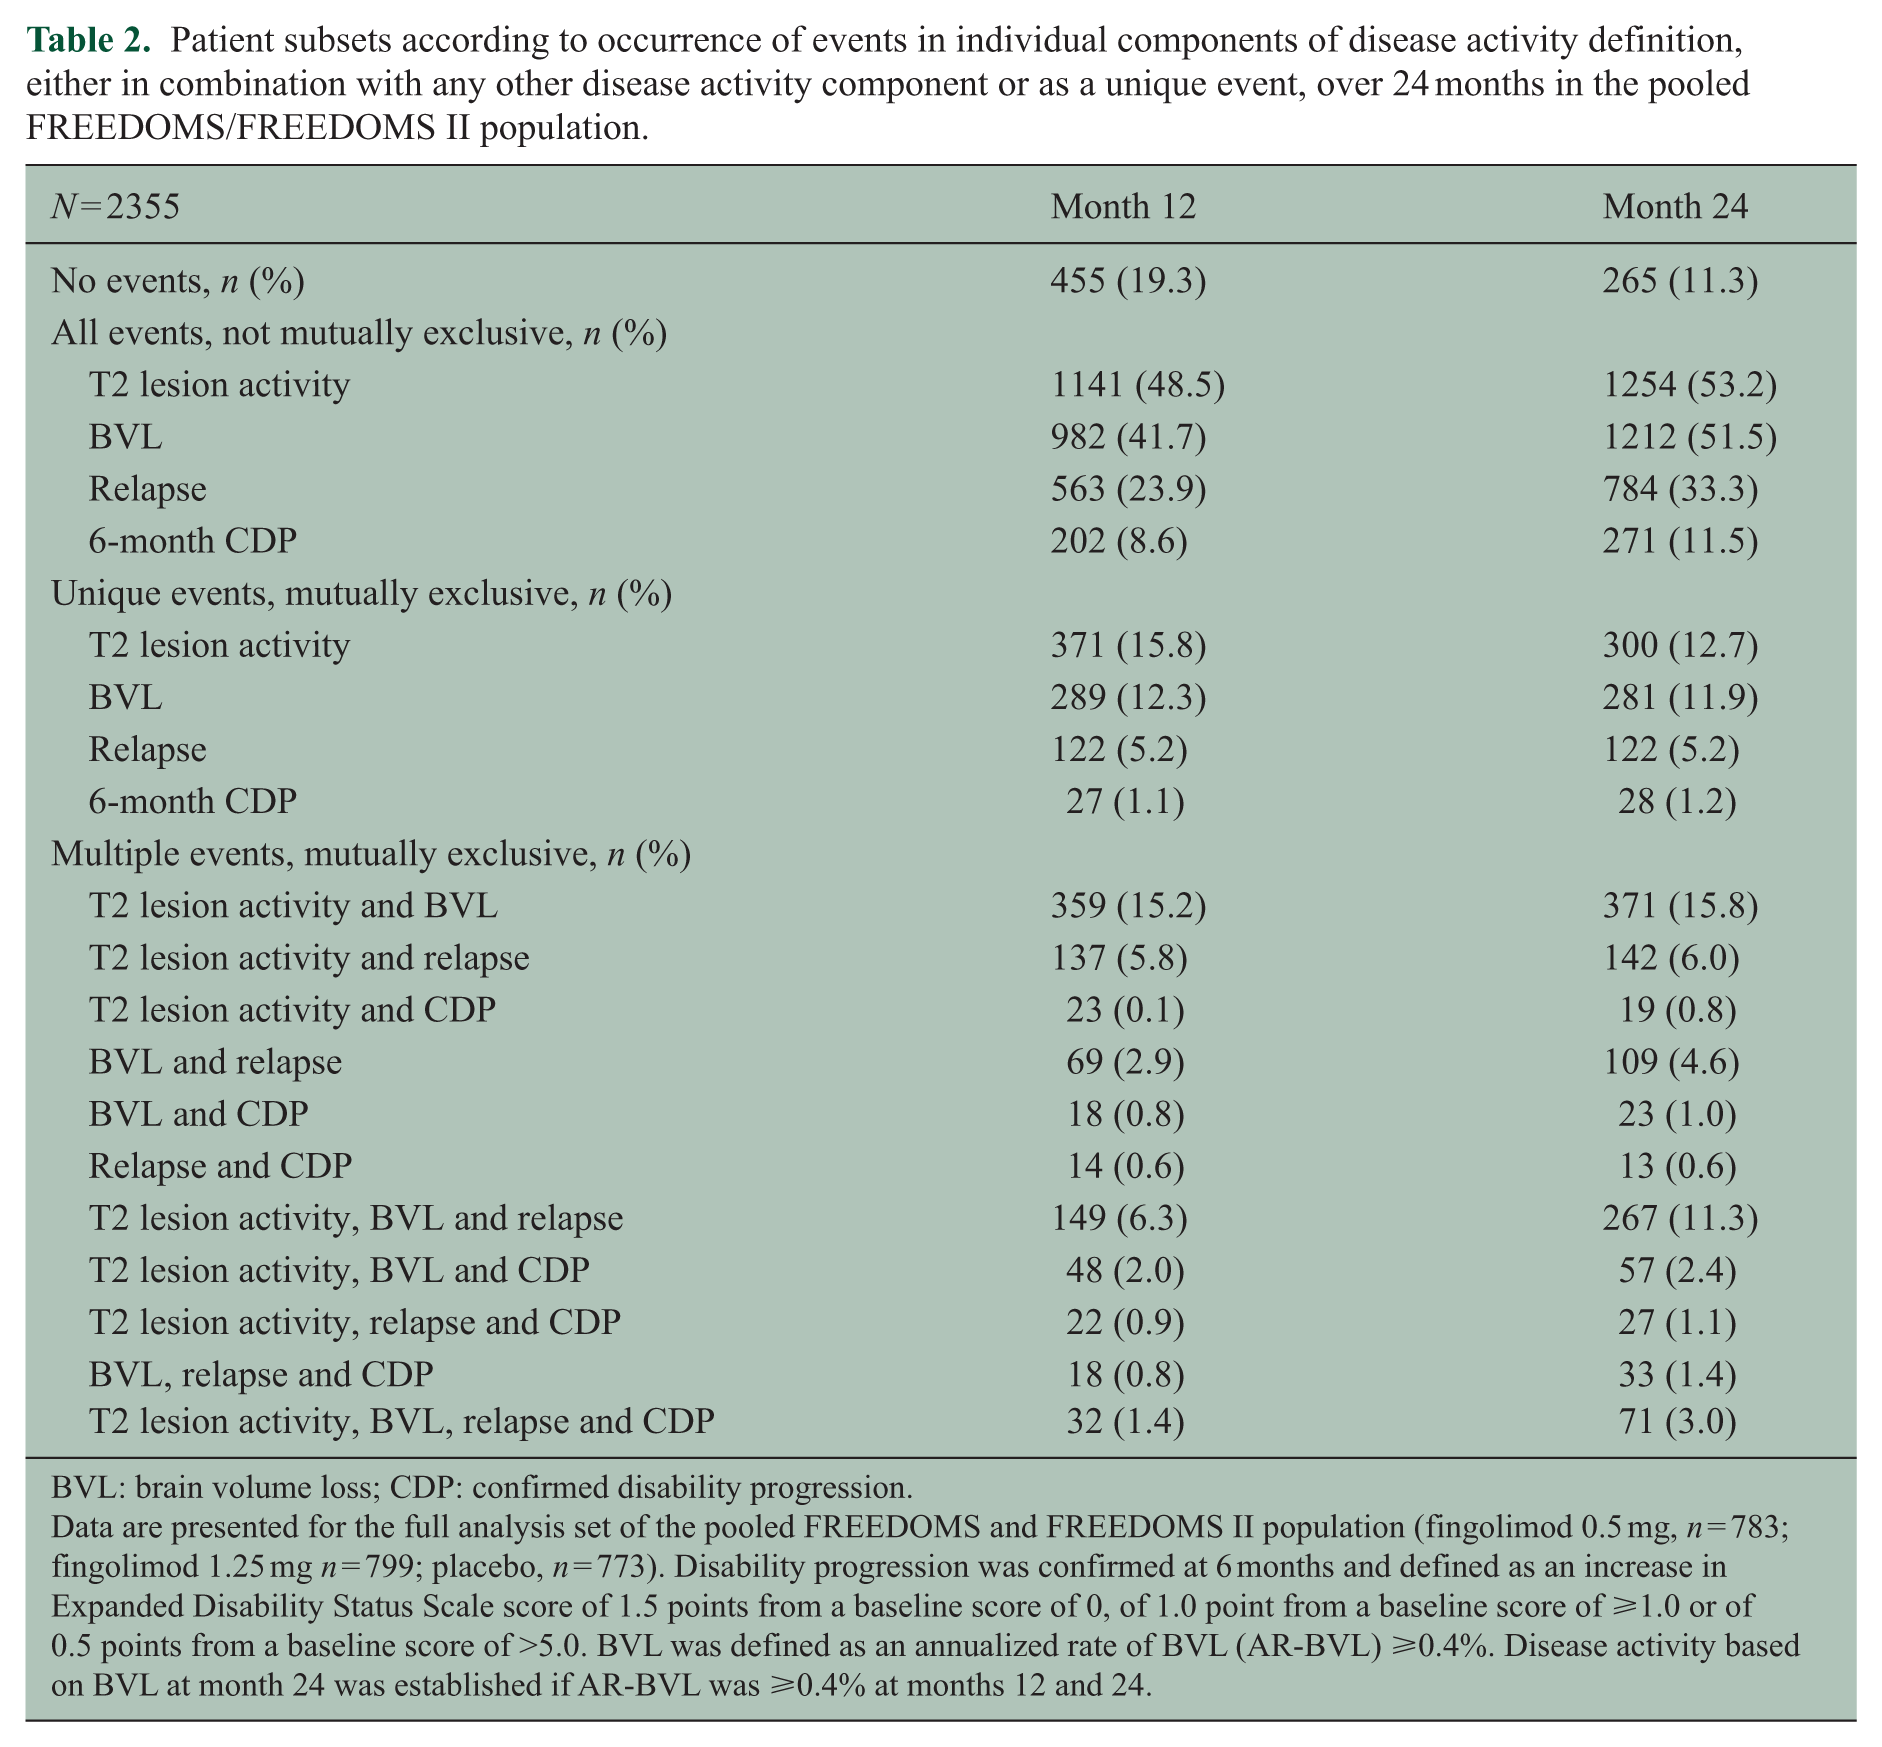
BVL: brain volume loss; CDP: confirmed disability progression.
Data are presented for the full analysis set of the pooled FREEDOMS and FREEDOMS II population (fingolimod 0.5 mg, n = 783; fingolimod 1.25 mg n = 799; placebo, n = 773). Disability progression was confirmed at 6 months and defined as an increase in Expanded Disability Status Scale score of 1.5 points from a baseline score of 0, of 1.0 point from a baseline score of ⩾1.0 or of 0.5 points from a baseline score of >5.0. BVL was defined as an annualized rate of BVL (AR-BVL) ⩾0.4%. Disease activity based on BVL at month 24 was established if AR-BVL was ⩾0.4% at months 12 and 24.
The sequential addition of the individual components of NEDA-4 resulted in lower numbers with NEDA in both treatment groups (Figure 3). The NNT with fingolimod to achieve the respective criterion of no disease activity increased with each additional measure (NNT for no evidence of: new T2 lesions, 4; new T2 lesions and relapses, 4; new T2 lesions, relapses and disability progression (NEDA-3), 5; NEDA-4, 7).
Discussion
Defining aspirational therapeutic goals in MS, to guide the clinician and patient towards an appropriate treatment choice, is particularly important because an increasing number of available DMTs allow for a lower tolerance of even subclinical signs of disease worsening. The original NEDA assessment combined important clinical and MRI aspects of relapsing MS, 2 but it is heavily weighted towards MRI inflammatory activity, 22 although consistent results were seen when allowing for minimal MRI activity. 23 A recent review of the use of the original NEDA-3 assessment in the post hoc analysis of DMTs in clinical trials also suggested that MRI measures such as BVL might add value if incorporated into NEDA measures. 1
Our analysis of the pooled FREEDOMS and FREEDOMS II dataset confirmed the finding that the classical definition of NEDA-3 is mainly driven by MRI activity and secondarily by relapses; CDP contributed fewer than 10% of unique events in both treatment groups. We also showed that almost all patients who had a Gd+ lesion had a new or enlarged T2 lesion at the same time or earlier. Although our data support the use of new or enlarged T2 lesions as a sole cumulative measure of inflammatory MRI activity in the setting of phase 3 trials with inter-scan intervals of 6–12 months, we should take into consideration that in less standardized and experienced settings, detection of active T2 lesions can be difficult and limited by methodological and technical factors. The 6-month time frame adopted for the assessment of disability progression in our analysis, only slightly decreased sensitivity, but is regarded as more specific for a permanent change in disability status than changes seen over 3 months,24,25 and its adoption has also been proposed by the European Medicines Agency. 26 Importantly, such adaptations did not change the approximately four-fold greater odds of achieving NEDA-3 and NEDA-4 with fingolimod than with placebo.
As an objective measure of tissue damage in MS, and in the absence of other confounding factors that could account for brain volume changes, BVL is clinically relevant because it correlates with, and is predictive of, long-term disability progression and cognitive decline.10–13 Treatment effects on BVL correlated with effects on slowing down disability progression in a meta-analysis of 13 randomized clinical trials, and these effects were independent of the effect on MRI lesions. 27 A recent analysis showed that approximately 25% of the effect of fingolimod on disability progression in patients with relapsing MS is mediated by the reduction of BVL, and that this impact is independent of the contribution of relapse reduction. 28
Adding BVL to the NEDA-3 concept requires identification of a diagnostically relevant rate of BVL. As expected, the range of annual BVL thresholds evaluated had an impact on the total number of patients failing to achieve NEDA-4 but did not change the advantage of fingolimod relative to placebo. We favour the 0.4% annual BVL threshold because it is above the mean annual rate of BVL reported for healthy individuals (0.1%–0.3%), and is below the range of mean rates usually reported in untreated patients with MS when measured using the SIENA method. 9 This threshold is also consistent with a recent longitudinal analysis of MRI data processed using SIENA, which found that an annual BVL rate of 0.4% provides 80% specificity in discriminating patients with MS from healthy controls and also had a prognostic value for discriminating patients who would develop disability progression in a follow-up of up to 12 years. 29 We further investigated if the rate of BVL remained stable over the study period and found that the majority of patients with an AR-BVL of at least 0.4% at 6 months also had an AR-BVL of at least 0.4% at both 12 and 24 months. Approximately one-quarter of patients did fluctuate between annual rates of BVL above and below the 0.4% threshold at individual MRI assessments within the 2-year study period, suggesting some limitations of using a single study-end measure of PBVC when calculating the AR-BVL.
Measurement of BVL has been widely adopted as an outcome in clinical trials, but has not yet entered clinical practice in the field of MS, thus limiting the utility of NEDA-4 as a routine assessment of disease activity or worsening in individual patients with MS. 9 For the assessment of individual patients, methodological issues including optimal reproducibility of image acquisition and uniform application of image analysis tools would need to be resolved, and more data on the development of BVL over time in different groups of normal individuals will need to be sampled. 29 A potential confounding factor in determining the rate of BVL could be pseudoatrophy as a result of the early anti-inflammatory effect of an intervention, which was proposed as an explanation of lacking or even adverse effects of some clinically effective DMTs in the first 6 months of treatment. 30 This was not observed with fingolimod in the overall clinical trial populations; however, post hoc analysis provided some evidence of the phenomenon in patients with one or more Gd+ lesions at baseline. In these patients, the rate of BVL at 6 months was still lower than in those treated with placebo but the effect was less pronounced than in patients without Gd+ lesions at baseline. 31 A real-world longitudinal analysis of 219 patients with MS (not stratified by treatment, but most received IFN or glatiramer acetate) revealed that 46% of patients achieved NEDA-3 at 1 year, 27.5% achieved it at 2 years, but only 8% achieved it at 7 years. 32 This illustrates that the conventional definition of NEDA-3 is already difficult to meet over long observation periods, at least with interferons beta or glatiramer acetate. Proportionately fewer patients had NEDA as defined by NEDA-4 (with the 0.4% annual BVL threshold) than by NEDA-3. In the pooled FREEDOMS population studied here, only 5% of patients on placebo achieved NEDA-4 compared with almost 20% of patients receiving fingolimod 0.5 mg. In addition to supporting the treatment benefit of fingolimod, this result also highlights that NEDA-4 represents a very stringent assessment of efficacy, the aspiration of which is complete disease remission based on a more comprehensive consideration of the underlying pathology.
Determining whether patients who achieve NEDA-4 are at lower risk of future disability than those with disease activity or achieving NEDA-3 will require validation in long-term studies. Acknowledging the importance of BVL in MS disease progression, and monitoring it both in the clinic and through clinical research using measures such as NEDA-4, should improve treatment strategies and patient outcomes. The results of the present analysis should encourage further validation of NEDA-4 in MS clinical studies and across different treatments.
Footnotes
Acknowledgements
Editorial assistance was provided by Jeremy Bright from Oxford PharmaGenesis and was funded by Novartis Pharma AG. Daniela Piani Meier and Davorka Tomic contributed equally to the development of this manuscript.
Conflict of interest
Ludwig Kappos’s institution, University Hospital Basel, has in the last 3 years received the following fees which were used exclusively for research support: steering committee, advisory board and consultancy fees from Actelion, Addex, Bayer HealthCare, Biogen, Biotica, Genzyme, Lilly, Merck, Mitsubishi, Novartis, Ono Pharma, Pfizer, Receptos, Sanofi-Aventis, Santhera, Siemens, Teva, UCB and Xenoport; speaker fees from Bayer HealthCare, Biogen, Merck, Novartis, Sanofi-Aventis and Teva; support of educational activities from Bayer HealthCare, Biogen, CSL Behring, Genzyme, Merck, Novartis, Sanofi and Teva; royalties from Neurostatus Systems GmbH; grants from Bayer HealthCare, Biogen, European Union, Merck, Novartis, Roche, Roche Research Foundations, Swiss MS Society and Swiss National Research Foundation. Nicola De Stefano has received honoraria for consulting services, speaking and travel support from Biogen Idec, Genzyme, Merck Serono S.A., Novartis, Roche, Schering and Teva, serves on advisory boards for Biogen Idec, Merck Serono S.A. and Novartis, and has received research grant support from the Italian MS Society. Mark S Freedman has received compensation for consulting services or a sponsored speaker’s bureau from Actelion, Bayer HealthCare, Biogen Idec, Chugai, EMD Canada, Genzyme, Hoffman-La Roche, Merck Serono, Novartis, Sanofi-Aventis and Teva Canada Innovation, and is a member of a company advisory board, board of directors or other similar group for Actelion, Bayer HealthCare, Biogen Idec, Hoffman-La Roche, Merck Serono, Novartis, Opexa and Sanofi-Aventis. Bruce Cree has received honoraria for consultancy services from Abbvie, Biogen Idec, EMD Serono, Genzyme/Sanofi-Aventis, MedImmune, Novartis, Teva Neurosciences, and has received research support from Acorda, Avanir, Biogen Idec, EMD Serono, F Hoffman-La Roche, MedImmune, Novartis and Teva Neurosciences. Ernst-Wilhelm Radue has received honoraria for serving as a speaker at scientific meetings and/or as a consultant from Actelion, Basilea, Bayer Schering, Biogen Idec, Merck Serono and Novartis; he has also received financial support for research activities from Actelion, Basilea, Biogen Idec, Merck Serono and Novartis. Till Sprenger’s previous institution, the University Hospital Basel, has received compensation for his serving on scientific advisory boards or for speaking fees from Actelion, Allergan, ATI, Biogen Idec, Electrocore, Eli Lilly, Genzyme, Janssen, Mitsubishi Pharma, Novartis and Teva. These fees were used exclusively for funding of research. He received research grants from the Swiss MS Society, the Swiss National Science Foundation, EFIC-Grünenthal and Novartis Pharmaceuticals. Maria Pia Sormani has received compensation for consulting services and speaking activities from Actelion, Biogen Idec, Genzyme, Merck Serono, Novartis, Synthon and Teva. Terence Smith is an employee of Oxford PharmaGenesis and was funded by Novartis Pharma AG. Dieter Häring, Daniela Piani Meier and Davorka Tomic are employees of Novartis Pharma AG.
Funding
Financial support for this analysis and for preparation of the paper was provided by Novartis Pharma AG, Basel, Switzerland. Data analysis was conducted and funded by Novartis Pharma AG. The corresponding author had full access to all data in the study and holds the final responsibility for the decision to submit for publication.
References
Supplementary Material
Please find the following supplemental material available below.
For Open Access articles published under a Creative Commons License, all supplemental material carries the same license as the article it is associated with.
For non-Open Access articles published, all supplemental material carries a non-exclusive license, and permission requests for re-use of supplemental material or any part of supplemental material shall be sent directly to the copyright owner as specified in the copyright notice associated with the article.