
Abstract
Daclizumab is a humanized monoclonal antibody that prevents interleukin-2 (IL-2) binding to CD25, blocking IL-2 signaling by cells that require high-affinity IL-2 receptors to mediate IL-2 signaling. The phase 2a CHOICE study evaluating daclizumab as a treatment for multiple sclerosis (MS) included longitudinal analysis of activated T cell counts. Whereas an exposure-dependent relationship was observed between daclizumab and reductions in HLA-DR+-activated T cells, a similar relationship was not observed for reductions in CD25 levels. The objective of this report is to determine the mechanism by which daclizumab reduces CD25 levels on peripheral blood mononuclear cells (PBMCs) using cytometric techniques. Daclizumab reduced T cell CD25 levels through a mechanism that required the daclizumab-Fc domain interaction with Fc receptors (FcR) on monocytes, but not on natural killer (NK) cells, and was unrelated to internalization or cell killing. Activated CD4+ T cells and FoxP3+ Treg cells showed evidence of trogocytosis of the CD25 antigen in the presence of monocytes. A daclizumab variant that retained affinity for CD25 but lacked FcR binding did not induce trogocytosis and was significantly less potent as an inhibitor of IL-2-induced proliferation of PBMCs. In conclusion, Daclizumab-induced monocyte-mediated trogocytosis of CD25 from T cells appears to be an additional mechanism contributing to daclizumab inhibition of IL-2 signaling.
Introduction
Daclizumab (DAC) is a humanized monoclonal antibody directed against the alpha-chain subunit (CD25) of the high-affinity IL-2 receptor (IL-2R). DAC binding to CD25 prevents formation and selectively blocks signaling by the heterotrimeric (CD25, CD122, CD132) high-affinity IL-2R. 1 CD25 is upregulated on many immune cell lineages upon activation. Increased IL-2, increased CD25-expressing immune cells, as well as increased soluble forms of CD25, have been observed within the serum and diseased central nervous system (CNS) compartment of patients with multiple sclerosis (MS).2–6 MS is a chronic inflammatory disease characterized by immune cell-mediated damage to CNS tissues in which autoreactive T cells are suspected of playing prominent roles in the pathology. 7
Results from open-label studies have led investigators to hypothesize therapeutic effects of DAC in MS were mediated, in part, by expansion of immunoregulatory CD56bright natural killer (NK) cells shown to be capable of killing in vitro autologous activated T cells from patients with MS. 8 The significant correlation between reductions in magnetic resonance imaging (MRI) lesion activity and DAC-mediated expansion of these regulatory CD56bright NK cells was confirmed in two controlled clinical trials.9,10 In contrast to T cells, CD56bright NK cells express elevated levels of intermediate IL-2 receptors (CD122/CD132) and these cells readily signal in response to IL-2 when CD25 is blocked by DAC, despite the approximate 100-fold reduced affinity of the intermediate receptor for IL-2.11,12 Additional mechanisms through which DAC is believed to directly limit activities of activated T cells include inhibition of IL-2-dependent upregulation of the co-stimulatory molecule CD40L on T cells, as well as the inhibition of myeloid dendritic cell-mediated trans-presentation of IL-2 at the T cell synapse.13,14
The term trogocytosis describes active transfer of plasma membrane fragments between two live cells triggered by interaction between a cognate antigen on one cell and an antigen receptor signaling pathway on another cell, as might take place at the synapse of an immune cell and an antigen-presenting cell. 15 The process has since been described for some therapeutic antibodies following interaction between the Fc region of antibodies bound to the surface of cells and FcγR1-expressing monocytes. 16
Materials and methods
Patients and study design
CHOICE was a randomized, double-blind, phase 2, placebo-controlled study of patients with MS that showed a dose-dependent effect of DAC in reducing gadolinium-enhanced contrast-enhancing lesions (Gd+ CELs) on monthly brain MRI between weeks 8 and 24 in patients with relapsing–remitting MS (RRMS). 9 Three subcutaneous dose arms were evaluated: interferon-beta (IFNβ) + placebo (placebo/IFNβ); IFNβ + DAC low-dose (DAC Low/IFNβ); and IFNβ + DAC high-dose (DAC High/IFNβ). Sixty-four patients from CHOICE consented to participate in optional pharmacokinetic (PK) and pharmacodynamic (PD) assessments. PD assessments were performed in the same subset of patients in whom PK evaluations were performed. Samples for PD evaluations were collected at screening and at weeks 0, 2, 12, 20, 22, 28, 34, 40, and 44 (prior to dosing on dosing visits). The DAC treatment phase was weeks 0–24, and approximately eight to 12 weeks were required for antibody washout. Blood samples for PK analysis were collected in a subset of patients on days 0, 4, 7, 14, 28, 84, 140, 147, 154, 168, 196, 238, 280, 308, and 504.
Flow cytometry of MS patient blood
Flow cytometric phenotyping of patient tissues was performed using BD Biosciences (San Jose, CA, USA) antibodies on acid-citrate-dextrose (ACD)-B anticoagulated blood collected and shipped at ambient temperature for analysis next day by validated assays at Esoterix Clinical Trials Inc. CD25 expression and saturation levels were measured with antibody clones M-A251 and 2A3. An antibody against an invariant region of major histocompatibility complex (MHC) Class 2, anti-HLA-DR specific clone L243, was used to calculate percentages of activated CD4 T cells. TruCOUNT™ assay (BD Biosciences) was used to convert percentage values into cell counts per unit of blood.
Statistical analysis
Statistical and graphic analysis was performed using all results obtained from PD patients who had at least one baseline and one corresponding post-dosing laboratory measurement. Between-treatment group comparisons for differences in cell count values at nominal timepoint visits were analyzed by unpaired t test. Both parametric paired t test and nonparametric Wilcoxon signed-rank test were performed when analyzing for significant change from baseline and percentage change from baseline at each post-treatment timepoint.
Individual DAC exposure characteristics, including area under the concentration-time curve at steady state (AUCss (µg*hr/ml)) and steady-state trough concentration (Cmin,ss (µg/ml)), were used as predictors to model changes from baseline level in individual immune subsets or changes over time. Relationship between changes from baseline level of HLA-DR+-activated T cells and total new or enlarged Gd+ CELs between weeks 8 and 24 was also evaluated using linear correlation, negative binomial correlation, analysis of variance, and Kruskal-Wallis Tests statistical analysis approaches.
Peripheral blood mononuclear cell (PBMC) isolation and culture
Blood from healthy volunteers was collected in sodium heparin anticoagulant vacutainer tubes and PBMC were isolated using Ficoll-Hypaque gradient centrifugation. Cells were plated at 2 × 10⁶ cells/ml in culture medium (CM) consisting of Roswell Park Memorial Institute (RPMI) medium containing 10% heat-inactivated fetal bovine serum (FBS; Sigma-Aldrich, St Louis, MO, USA), 1 mM HEPES buffer, 20 nM L-glutamine, 1 mM sodium pyruvate, and 0.05 mM 2-mercaptoethanol, 100 units/ml Penn-Strep (ThermoScientific (Hyclone), Logan, UT, USA) and maintained in a humidified CO2 incubator.
Analysis of effects of DAC on CD25 levels in vitro
PBMCs were stimulated for 47 hours with phytohemagglutinin (PHA-P at 5 μg/ml, Sigma-Aldrich, St Louis, MO, USA) followed by addition of 10 µg antibody treatment (or molar equivalents for F(ab’)2 fragments) for one hour. F(ab’)2 antibody fragments were produced through enzymatic cleavage of DAC and purified by Southern Biotech Inc (Birmingham, AL, USA). The non-FcR binding variant monoclonal antibody DAC-IgG2m3 was generated by replacing the immunoglobulin G (IgG)1 Fc portion of DAC with an IgG2a Fc domain with replacements of alanine for valine at positions 234 and 237 to render the antibody Fc domain incapable of binding FcR and leaving FcRn binding ability intact. 17 NK cells and monocytes were selectively removed at 0 hour by positive selection using antibodies specific for removal of NK cells and monocytes according to the manufacturer’s (Miltenyi Biotech, Auburn, CA, USA) suggested isolation procedures. After removal of NK and monocytes, flow cytometric analysis was performed to confirm > 95% removal of NK and monocytes from the cultures. For all in vitro culture experiments involving flow cytometric analysis, cells were cultured at 1 × 10⁶ per ml in 96-well round-bottom plates. Cells were harvested and washed with ice-cold Staining Buffer™ (BD Biosciences) prior to incubation with fluorescently conjugated, antigen-specific antibodies for 30 minutes at room temperature (RT). Antibodies obtained from BD Biosciences were used to stain CD3 (clone SK7) and CD4 (clone RPA-T4).
Images of fluorescently stained cells were also obtained using an IN Cell Image Analyzer™ (GE Healthcare, USA) after cells were cultured at 2 × 10⁶ per ml in 24-well flat-bottom plates for 47 hours followed by harvest (including plate-bound monocytes) with phosphate-buffered saline (PBS) and ethylenediaminetetraacetic acid (EDTA), repeated wash using CM, and culture in 12 × 72 mm culture tubes. Antibody treatments were added at 10 µg (or molar equivalents for F(ab’)2 fragments) per 1 × 10⁶ cells for one hour. Treatments included DAC, isotype control Ig1 (clone MSL109) antibody, and F(ab’)2 purified fragments of each respective antibody, when chemically conjugated to fluorescently labeled AF647 (Southern Biotech Inc). After incubation for 40 minutes at 37°C, the cellular contents of each tube were washed two times with CM followed by incubation for 15 minutes with ER Tracker™ (Invitrogen, Carlsbad, CA, USA), a vital fluorescent staining marker that incorporates into endoplasmic reticulum for the purposes of identifying viable cells and determining whether fluorescently labeled anti-CD25 antibodies were intracellular and not surface bound.
PBMCs from each treatment were then prepared for IN Cell analysis using methods similar to those used for flow cytometry. Monocytes were identified using an anti-CD14 specific antibody (clone M5E2, BD Biosciences). Intra-nuclear staining of the FoxP3 transcription protein was performed using clone 259D/C7 (BD Biosciences) following the manufacturer’s suggested procedures. Briefly, cells were incubated and vortexed in FoxP3 buffer A for 10 minutes at RT followed by washing twice in Staining Buffer™ and incubation in FoxP3 buffer C for 30 minutes at RT. Cells were then washed repeatedly prior to staining with cocktails of fluorescently conjugated antibodies for 30 minutes at RT. After repeated washes, cells were suspended in BD Stabilizing Fixative™ (BD Biosciences), followed by dilution 1:4 in PBS to minimize formaldehyde effects on the ER tracker™ (blue) reagent. Anti-CD14 antibody was used to identify monocytes (green); anti-CD4 (green) and anti-FOXP3 (green) antibodies were used to identify regulatory T (Treg) cells.
CD25 inhibition of IL-2-induced proliferation by lymphoblasts
Lymphoblast cultures were generated using three days’ stimulation of PMBCs with 1 ng/ml IL-2. Proliferation of lymphoblasts was measured by quantifying 3H thymidine incorporation after pulsing with 1 μCi per well methyl-3H thymidine (GE Healthcare, Pittsburgh, PA, USA) in RPMI medium for the last 16 hours of cell culture. Cells were harvested onto FilterMate™ membranes using a Packard Harvester (PerkinElmer, Waltham, MA, USA), and beta particle emission was measured by scintillation counting. Individual replicates were performed on separate days. Statistical analysis using unpaired t test were performed for between-treatment group comparison after normalizing mean 3H thymidine counts per minute (cpm) for each antibody treatment condition of each day’s experiment to the stimulation only, no antibody, control treatment condition. Concentrations of antibody evaluated included: 0, 0.001, 0.005, 0.01, 0.05, 0.1, 1, 10, and 20 µg/ml.
Results
DAC treatment in vivo decreased CD25+ T cells
As seen in Figure 1, a reduction of approximately 30% in the percentages of CD25-expressing CD4+ T cells was observed two weeks after a single dose of DAC for patients in DAC Low/IFNβ and DAC High/IFNβ treatment groups. Percentages of CD25+ cells generally returned to baseline levels at antibody washout between weeks 28 and 40. 9 No treatment-associated changes were seen for the Placebo/IFNβ treatment group. The sustained reductions in percentages of CD25-expressing CD4+ cells were observed throughout the treatment phase and in the absence of significant changes in CD4 cell counts for the two DAC treatment groups. 9
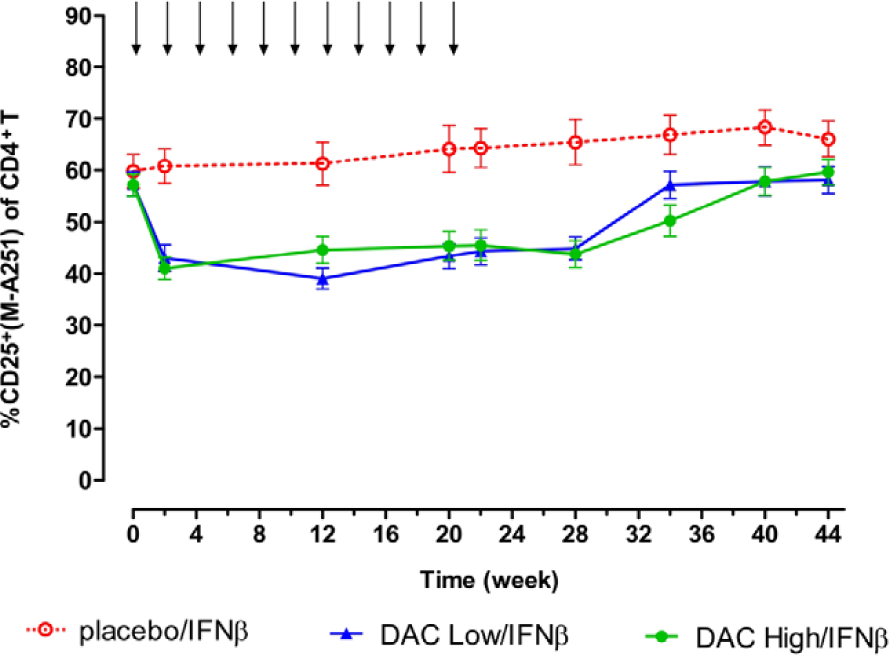
Reductions in percentages of CD4+ T cells that stained positive for CD25 expression were observed for DAC Low/IFNβ and DAC High/IFNβ patients, throughout the dosing period. Shown are mean and SEM measurement results for patients in the Placebo/IFNβ (open circles, n = 17), Low DAC/IFNβ (upward triangles, n = 25), and High DAC/IFNβ (closed circles, n = 21) treatment groups. DAC and placebo dosing visits are indicated by downward arrows. Surface CD25 protein levels generally returned to baseline levels following DAC washout and CD25 desaturation beginning around week 28. 9 Reductions in surface CD25 levels were not observed for the placebo/IFNβ group patients.
DAC treatment in vivo reduced activated HLA-DR+ T cells
In contrast to the reduction in CD25+ T cells that had reached maximum levels at the week 2 timepoint, steady reductions in HLA-DR+-activated CD4 T cell counts that eventually attained statistical significance (p < 0.05) compared with placebo treatment group levels were observed in the DAC treatment groups at weeks 12 and 20 (Figure 2). Both DAC dose groups showed statistically significant (p < 0.01) reduced levels of activated HLA-DR+ T cells at two, 12, 20, and 22 weeks (and week 28 for DAC Low/IFNβ only) when the comparisons were within treatment groups, i.e. change from baseline and percentage change from baseline. The timing of these reductions in activated HLA-DR+ T cells, during the treatment phase, approximated when DAC dosing groups were associated with maximum reductions in the inflammatory lesion activity, as determined by MRI. 9 Significant reductions compared to baseline levels in activated HLA-DR+ T cells were not observed for the placebo/IFNβ dose group. Statistically significant increases in absolute HLA-DR+CD4+ T cell counts were observed during the washout period, a time of diminished clinical benefit in both DAC dose groups according to results of within-treatment comparisons (DAC Low/IFNβ, p < 0.05, week 34, 40, 44; and DAC High/IFNβ, p < 0.01, week 44), while significant increases were not observed when the analysis was compared with levels in the placebo/IFNβ group.
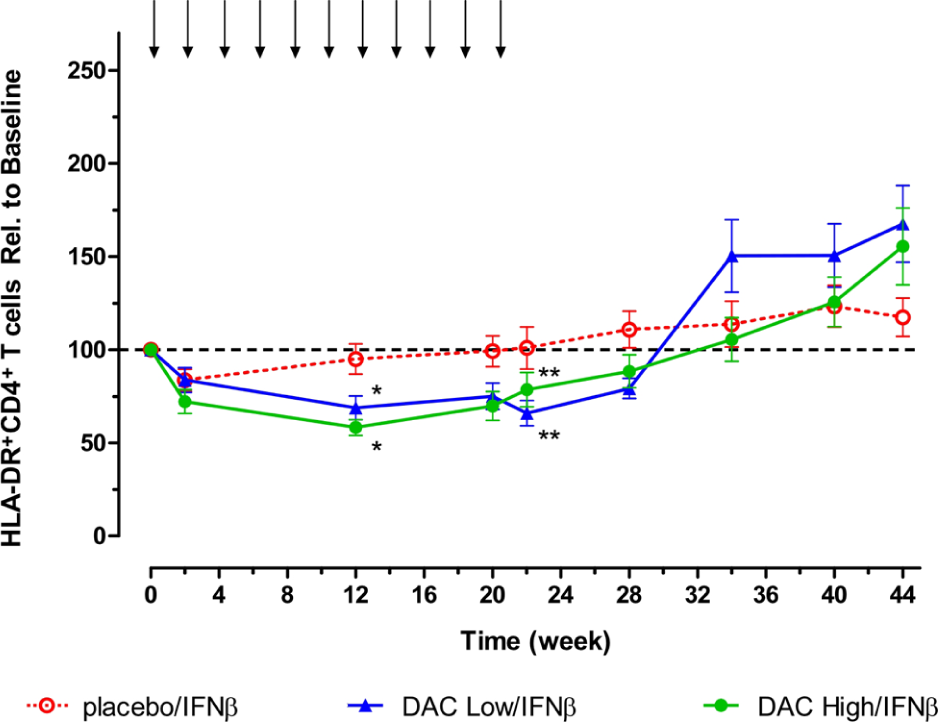
Decreases from baseline in levels of absolute HLA-DR+-activated CD4+ T cell counts were observed for both DAC dosing groups. Shown are mean and SEM measurement for patients in the Placebo/IFNβ (open circles, n = 17), Low DAC/IFNβ (upward triangles, n = 25), and High DAC/IFNβ (closed circles, n = 21) treatment groups. Statistically significant reductions (p < 0.05) compared with placebo group counts were observed at week 12 (*p < 0.05) and week 22 (**p < 0.01).
Because a dose-response was observed in the CHOICE study in terms of efficacy, i.e. the DAC High/IFNβ and not the DAC Low/IFNβ treatment group achieved significance as defined by the study primary efficacy endpoint, an exposure versus PD response correlation was assessed to examine the relationship between patients’ serum DAC exposure levels (AUCss or Cmin,ss) and activated T cell counts. Statistically significant, but biologically weak, correlations were observed between serum DAC antibody Cmin,ss and average HLA-DR+ cell counts (Figure 3(a)) and change from baseline levels in average activated T cell counts during the treatment phase. When examining the effect of DAC treatment on average HLA-DR+CD4+ T cell count during the treatment period using analysis of variance (Figure 3(b)), a treatment effect was significant only for the DAC high-dose group (DAC high dose vs placebo: p = 0.0103; DAC low dose vs placebo: p = 0.1044).
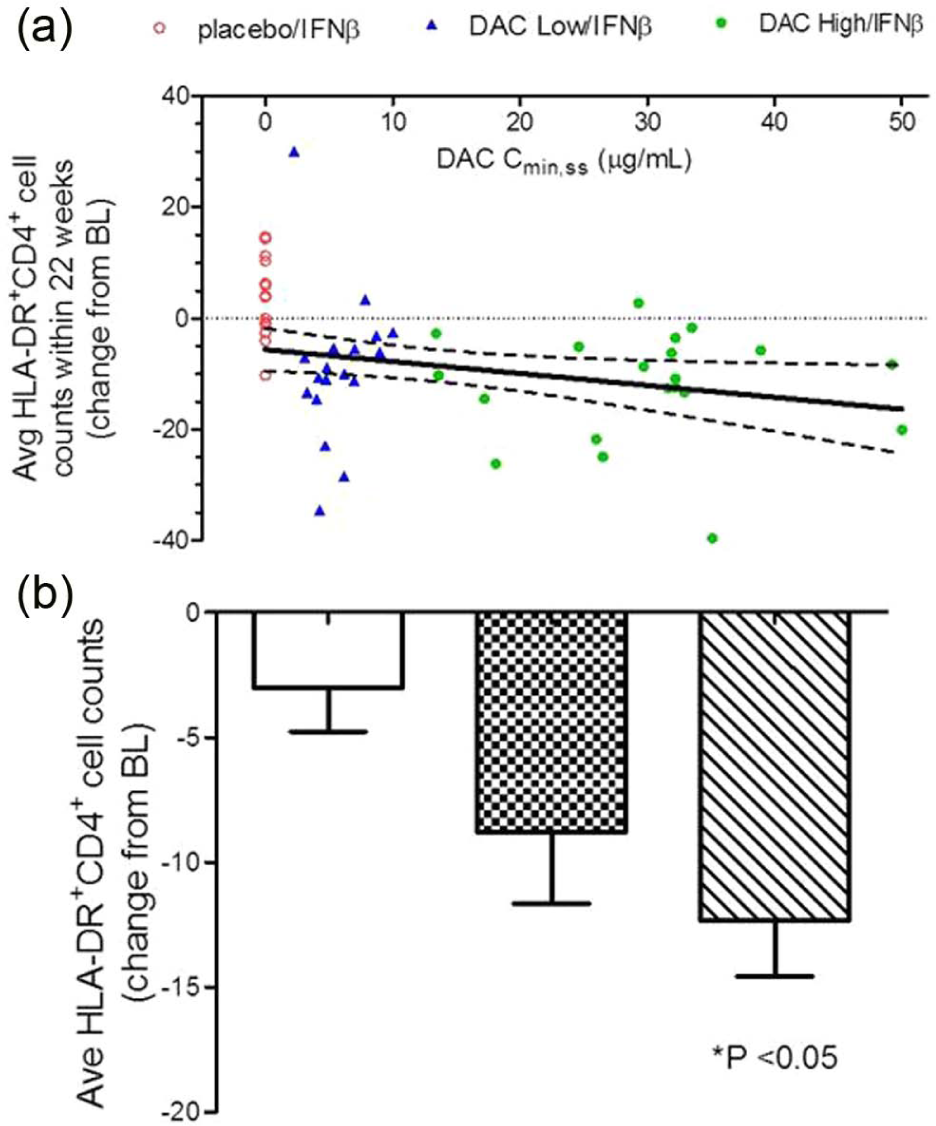
A significant relationship was observed between changes in individual patients’ activated HLA-DR+ T cell counts and DAC serum exposure levels (Figure 3). Placebo/IFNβ (open circles), DAC Low/IFNβ (triangles), DAC High/IFNβ (closed circles), and 95% confidence interval for Pearson correlation are indicated. Although weak (r2 = 0.127), the negative linear correlation observed between individual DAC trough concentration at steady state (Cmin,ss) and patients’ average reductions from baseline level absolute HLA-DR+CD4+ T cell counts during the dosing period (Figure 3(a)) was statistically significant when the high DAC dose was compared to placebo (Figure 3(b)).
Dose-dependent down-modulation of CD25 on activated T cells by DAC in vitro
In attempting to understand how DAC exposure might lead to in vivo reductions in CD25 levels on T cells, DAC effects were studied using PHA-activated PBMC cultures of T, B, NK and monocytes in vitro (Figure 4). DAC, DAC-IgG2M3 and DAC-F(ab’)2 were capable of blocking CD25 on the antigen-rich CD4 T cell population in a dose-dependent manner (Figure 4(a)); however, only the FcR binding CD25 blocking antibody (i.e. DAC) reduced CD25 cell surface expression (Figure 4(b)). The experiment was repeated after selective removal of NK cells and monocytes prior to adding the anti-CD25 antibody or antibody fragments to the remaining PBMC cultures. Complete removal of monocytes abolished CD25 reduction by DAC antibody (Figure 5(a)). In contrast, complete removal of NK cells had no effect on DAC-mediated CD25 reduction (Figure 5(b)).
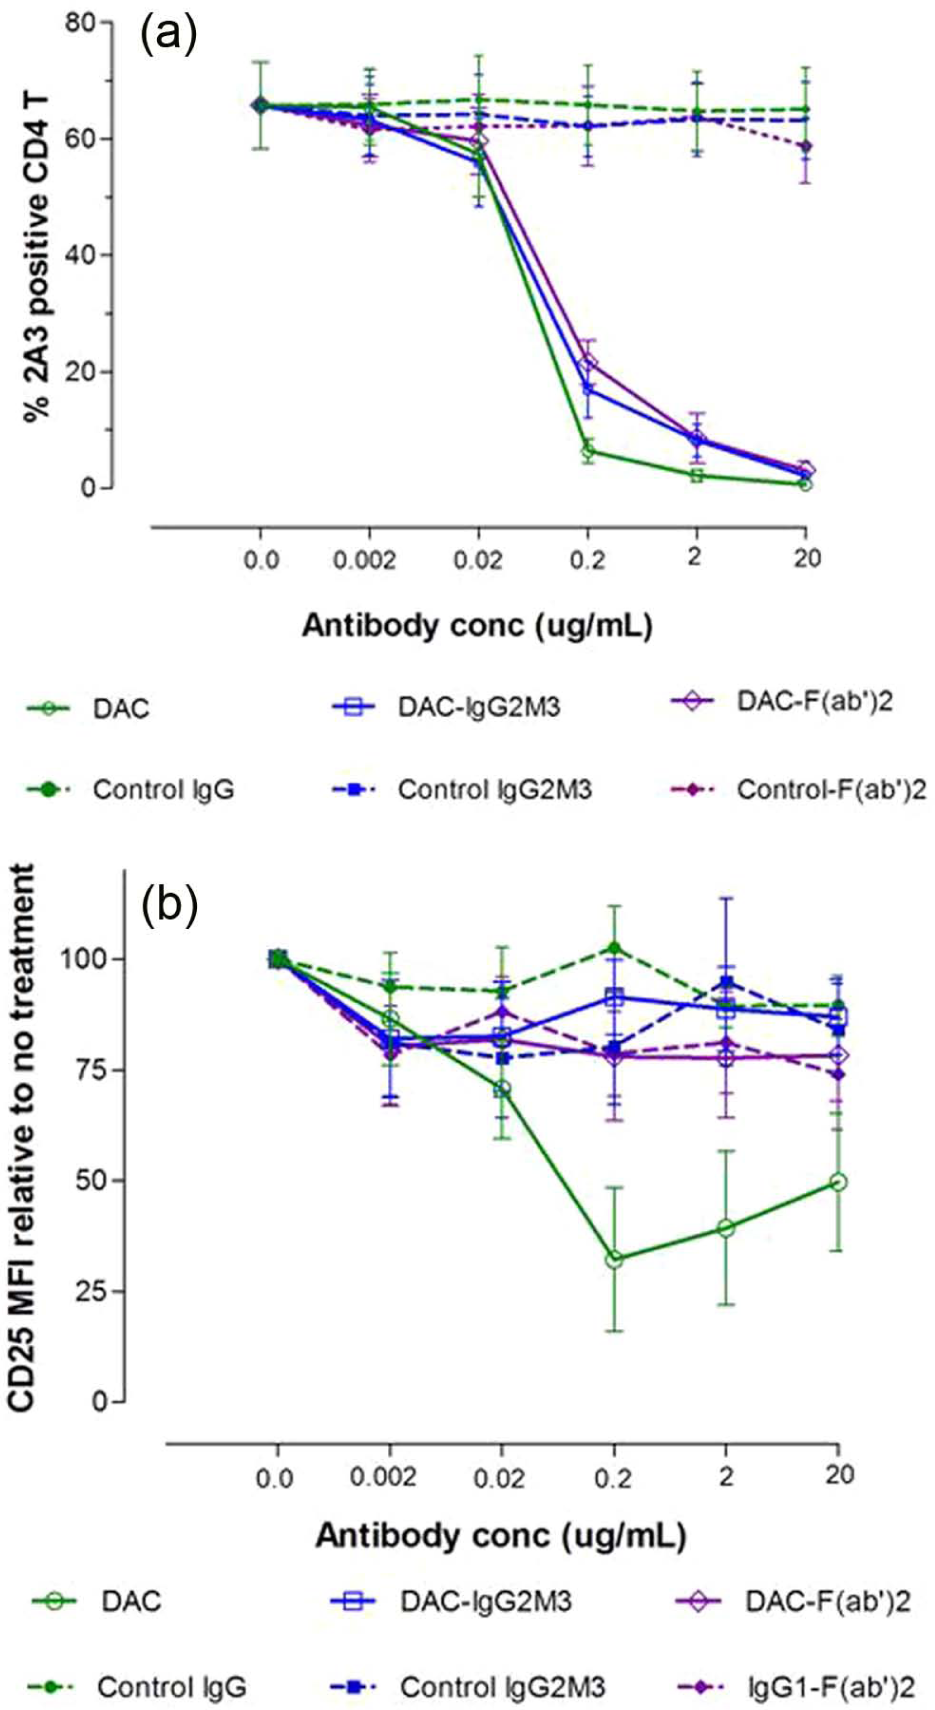
DAC rapidly reduced CD25 levels on PHA-activated T cells in vitro. The DAC, DAC-F(ab’)2, and DAC-IgG2M3 were capable of saturating CD25 receptors on antigen-rich CD4 T cells (Figure 4(a)) as evidence of blocking binding of competing anti-CD25 binding clone 2A3. Only the Fc containing DAC antibody was associated with CD25 reduction (Figure 4(b)), control antibodies, and the non-FcR binding DAC variants DAC-F(ab’)2 and DAC-IgG2M3 and had no effect on CD25 levels, as determined by fluorescence intensity of the noncompeting anti-CD25 antibody clone M-A251. Actual concentrations of F(ab’)2 fragments reflect molar equivalents of complete IgG1 antibody expressed as µg/ml. CD25 levels were expressed as MFI relative to the level in the absence of antibody. Mean and standard error of the mean (SEM) from the four experiments are shown.
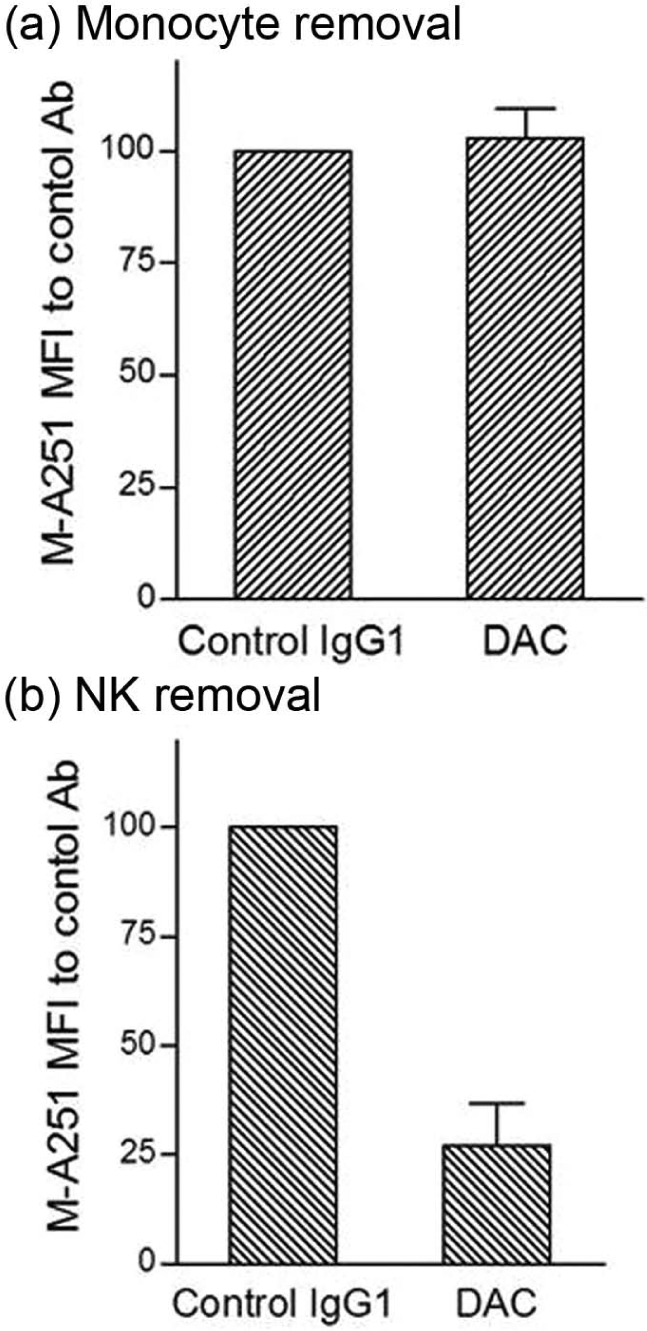
DAC antibody-dependent reduction in CD25 levels on antigen-rich CD4 T cells was prevented after selective monocyte removal prior to addition of 2 µg/ml DAC antibody to remaining PHA-stimulated PBMC cultures (Figure 5(a)). In contrast, prior selective removal of NK cells did not prevent significant (p = 0.032) reductions in CD25 levels when DAC was added to the remaining PBMC in the cultures. Mean and SEM shown (n = 5).
To confirm DAC-mediated CD25 reduction was not caused by killing of CD25+ lymphocytes, percentages of dead cells in the cultures were measured using two sensitive reagents, 7-amino-actinomycin D (7AAD) and AnnexinV-FITC. Despite reductions in CD4+CD25+ cells of roughly 60% or greater, in the presence of DAC antibody the percentages of dead cells were in low single digits (data not shown), suggesting that a cell-killing mechanism could not account for the observed reduction in CD4+CD25+ cells.
Monocyte-mediated trogocytosis removes DAC from the cell surface
Further experiments were conducted to determine whether the Fc-mediated, monocyte-dependent removal of CD25 from the surface of DAC antibody-treated lymphocytes shared characteristic morphological features of trogocytosis, and whether antibody Fc-dependent removal of CD25 also took place on FoxP3 expressing Treg cells (Figures 6 and 7). Two-day PHA-stimulated PBMC cultures were incubated one hour with AF647-labeled DAC antibody and corresponding isotype controls (all staining red). Only cultures treated with the Fc containing full-length DAC antibody were associated with a punctate cytoplasmic staining pattern corresponding to internalized fluorescently labeled DAC-AF647 antibody, and such a staining pattern was observed only for CD14+ monocytes (Figures 6(b) and (d)).
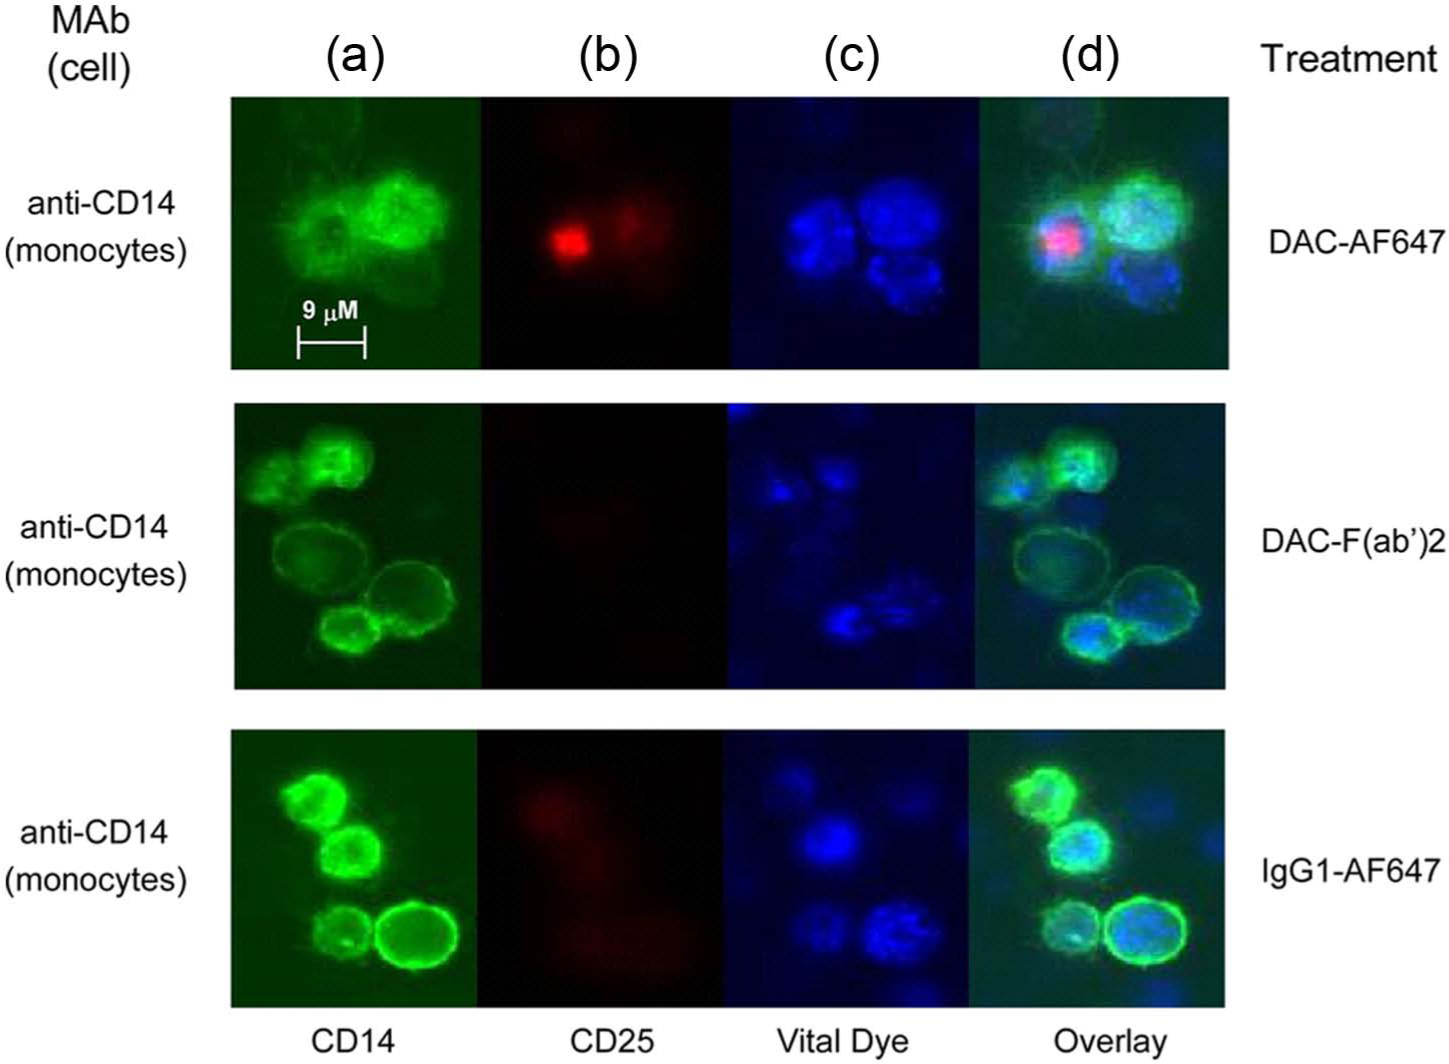
Fluorochrome-labeled DAC-AF647 was internalized by monocytes after PHA-stimulated PBMC cultures were incubated with DAC-AF647 antibody. Monocytes were identified by anti-CD14 antibody (a: green). CD25 was identified with DAC-AF647 (b: red). Viable cells were identified with the endoplasmic reticulum-specific ER-Tracker™ reagent (c: blue). Overlay images with the labeled DAC-AF647 antibody, the ER-Tracker™ and CD14+ monocytes are shown (d). Negligible or faint staining was observed for CD14+ monocytes following treatments with AF647-labeled DAC-F(ab’)2 fragment and AF647-labeled isotype control antibody.
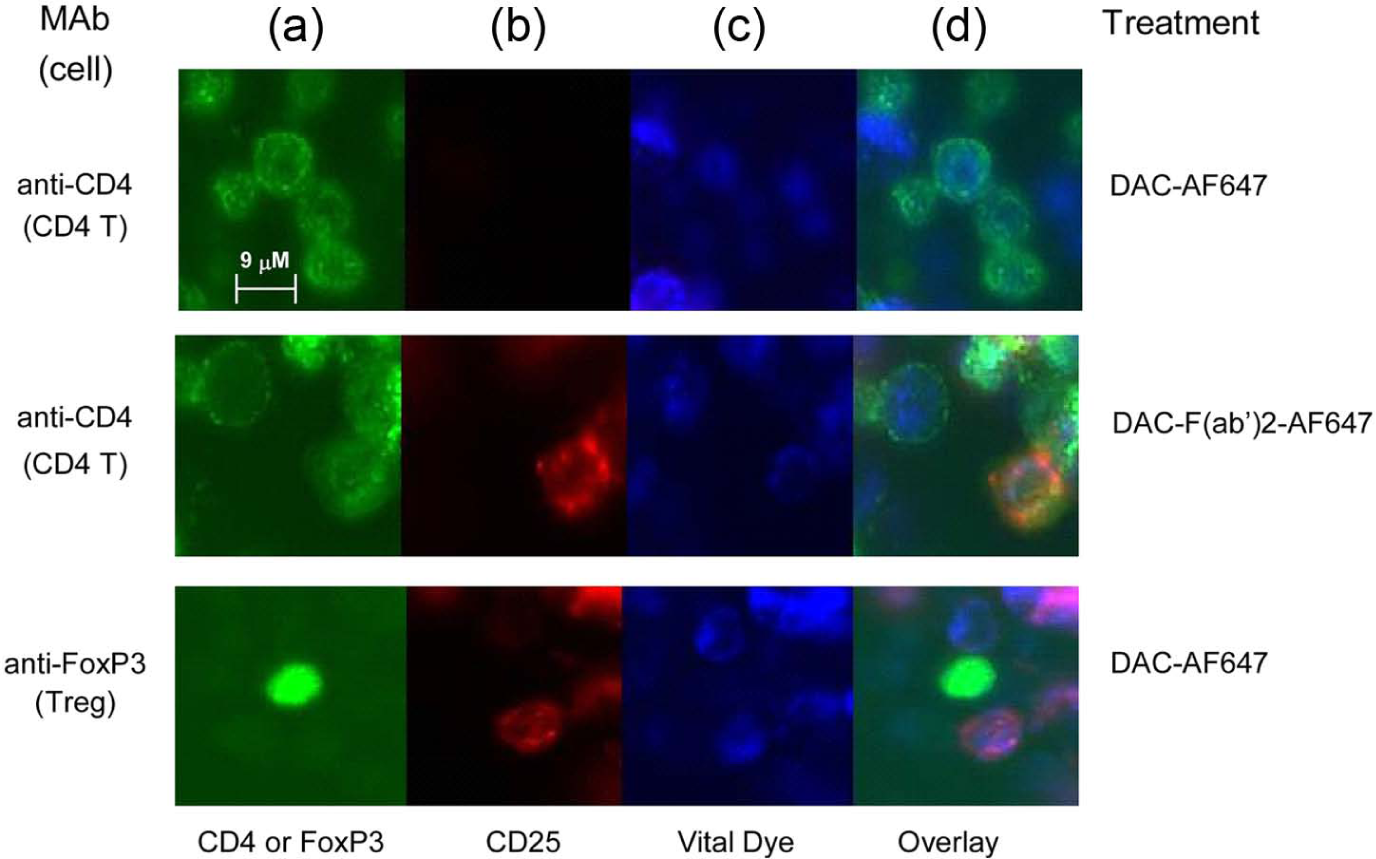
Fluorochrome-labeled DAC-AF647 was faint or undetectable on the surface of CD4+ T cells and FoxP3+ T cells when PHA-stimulated PBMC cultures were incubated with the DAC-AF647-labeled antibody. CD4 T cells were identified by anti-CD4 antibody (a: green) and putative Treg cells were identified in separate staining by anti-FOXP3 antibody (a: green). Viable cells were identified using ER-Tracker™ (c: blue). Abundant staining was observed for CD4+ T cells after incubation with the AF647-labeled DAC-F(ab’)2 fragment. The DAC-F(ab’)2-AF647 staining pattern on T cells was punctuate in appearance on the cell surface. Following trogocytosis by monocytes, the AF647-labeled DAC antibody was strikingly absent from surfaces of FoxP3+ Treg cells.
Longer exposure times revealed the DAC-F(ab’)2-AF647 antibody bound to surfaces of CD14+ monocytes (data not shown); in contrast, longer exposures could not reveal surface staining with DAC-AF647 antibody, suggesting the monocytes in culture express CD25, but FcR-dependent monocyte on monocyte trogocytosis and internalization of CD25 was taking place in the presence of DAC antibody. After the incubation to allow trogocytosis by the monocytes, the AF647-labeled DAC antibody was remarkably devoid from the surfaces of FoxP3+ Treg cells (Figure 7(d)).
More potent IL-2 inhibition by trogocytosis competent anti-CD25 antibody
Both the CD25 blocking antibodies DAC and DAC-IgG2M3 inhibited IL-2-induced proliferation of lymphoblasts in a dose-dependent manner (Figure 8(a)), but the maximum inhibition was reached at different concentrations of 1.0 (DAC) and 10 µg/ml (DAC-IgG2M3), respectively. Although the CD25 epitope binding domains for each of the antibodies are identical, the DAC-IgG2M3 antibody exhibited significantly less inhibition of IL-2-mediated proliferation in comparison to DAC antibody at concentrations near the inflection points for the inhibition assay. As a control, the DAC and DAC-IgG2M3 antibodies were evaluated for ability to dose-dependently inhibit IL-2-mediated proliferation of a T leukemia cell line, Kit225. No significant difference was observed for the DAC-IgG2M3 antibody’s ability to inhibit IL-2-mediated proliferation in the FcγR1-expressing cell null culture conditions of a T leukemia monoculture (Figure 8(b)). In the presence of monocytes, the trogocytosis-competent DAC IgG1 antibody has significantly greater ability to block IL-2-dependent proliferation in comparison to the trogocytosis-null DAC-IgG2M3 antibody.
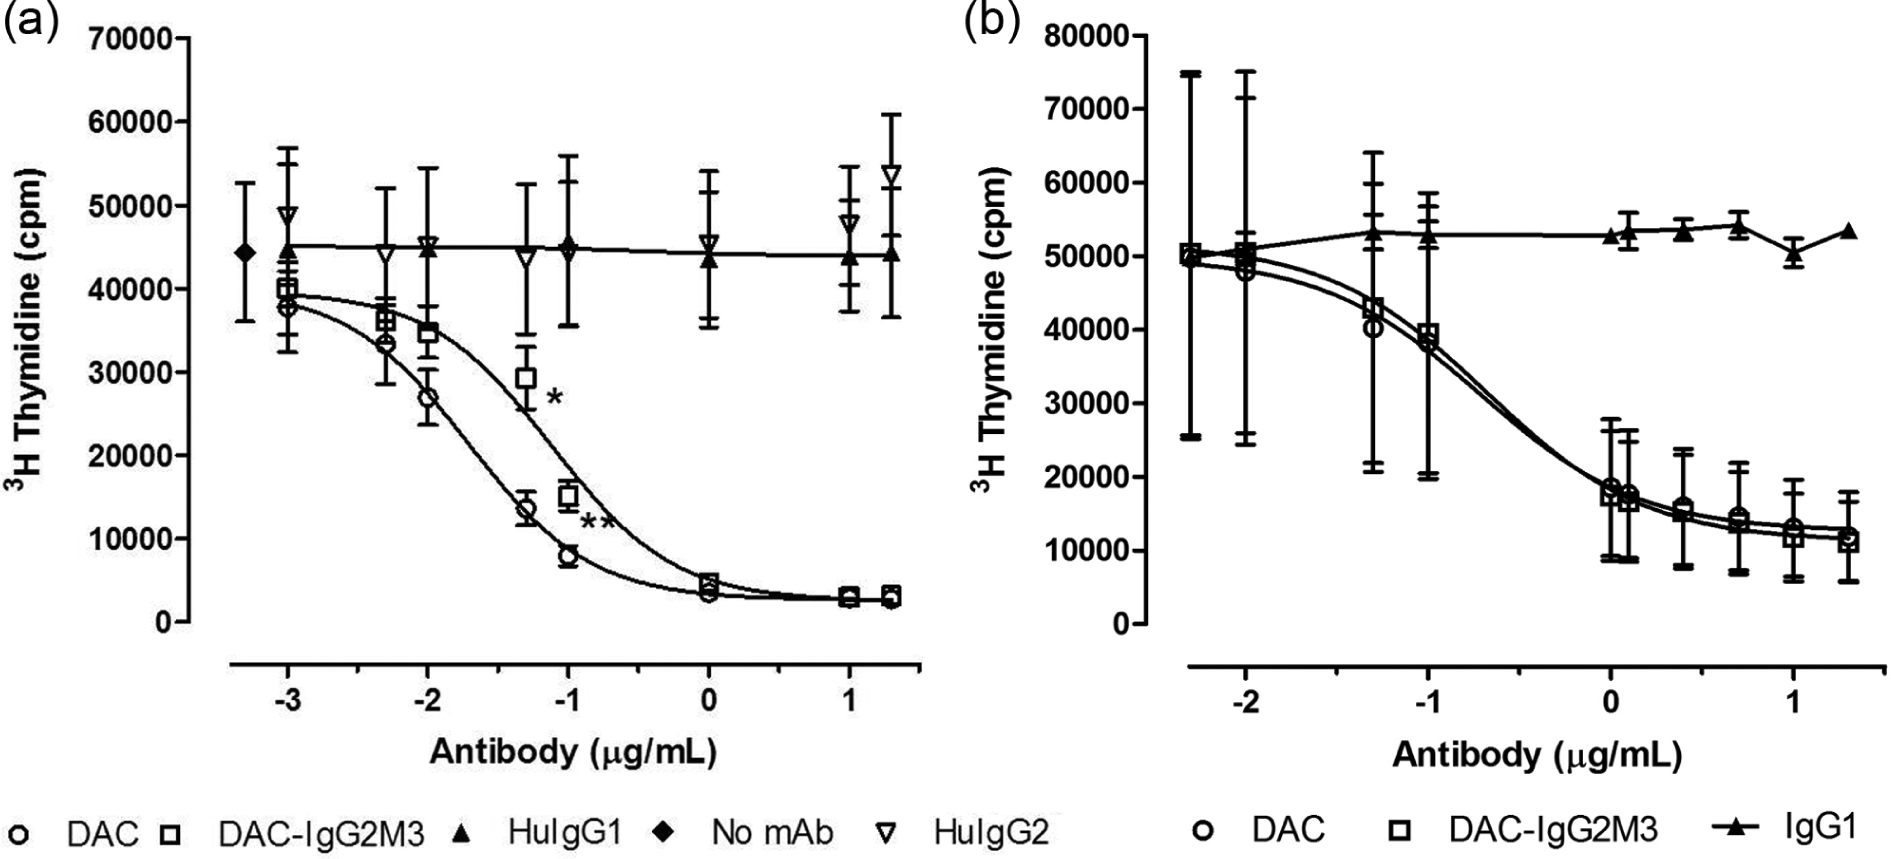
The CD25-blocking antibodies DAC and DAC-IgG2M3 inhibited IL-2-induced proliferation of lymphoblasts in a dose-dependent manner. Data are presented as mean and SEM measurements of total counts per minute of 3 H thymidine-associated emission for three independent experiments. At concentrations near the inflection points for the inhibition curves, the non-FcR-binding DAC-IgG2M3 antibody had significantly (0.05 µg/ml, p < 0.045 and 0.1 µg/ml, p < 0.014) reduced ability to inhibit IL-2-mediated proliferation of PBMCs compared with DAC (a). Both DAC and DAC-IgG2M2 antibodies inhibited IL-2-induced proliferation of a T cell leukemia cell line, Kit223, in a dose-dependent fashion; however, under the trogocytosis-null culture condition of a tumor cell line, there is no significant difference in proliferation inhibition by the IgG1 versus the IgG2M3 antibodies (b).
Discussion
Results described in this paper demonstrate DAC can mediate removal of CD25 from the surface of immune cells through monocyte-dependent trogocytosis. The CD25 removal by trogocytosis contributes to the inhibition of IL-2-mediated responses in vitro and suggests the transfer of this IL-2-binding subunit from effector cells to monocytes may be yet another mechanism through which DAC antibody reduces activated effector cell responses to IL-2 in vivo. These observations are also consistent with DAC’s observed in vivo effects of sustained reductions in CD25 expression on T cells during the DAC treatment phase of RRMS patients. 9
Using flow cytometric methods, we determined trogocytosis removal of CD25 could not be blocked by maintaining the culture conditions at 4ºC (data not shown), which is consistent with what has been reported for B cell-mediated acquisition of membrane-bound antigens through trogocytosis, and distinct from the trogocytosis pathways used by T cells. 18 Unlike trogocytosis of an antigen by T and NK cells, which can result in presentation of that antigen on the surface and confer functional activity of proteins, trogocytosis by monocytes leads to internalization and destruction of proteins, suggesting it is unlikely that trogocytosis of CD25 by monocytes results in the presentation of functional IL-2-binding CD25 protein on the surface.19–22 Rituximab is an anti-CD20-specific antibody that binds selectively to B cells through the antibody idiotypic domain. Taylor and Lindorfer have hypothesized that the trogocytosis-inducing antibody rituximab may exert some portion of its mechanism of action in autoimmune diseases by attracting and binding Fcγ receptor-expressing monocytes to antibody-coated β cells, diminishing recruitment of Fcγ receptor-expressing effector cells to sites of inflammation. 22 If true, a similar immune complex mechanism might also apply to DAC. The removal of CD25 from the surface of immune cells may also contribute, indirectly, to observed PD effects by DAC during treatment. Decreased IL-2 consumption by T cells as a combined consequence of the steric hindrance mechanisms following DAC binding, as well as trogocytosis removal of antibody-bound CD25 proteins by monocytes, may be two mechanisms that lead to greater interaction of IL-2 with CD122high-expressing immune cells, such as CD56bright NK cells and innate lymphoid cell precursors.8,23 Therefore, we view this mechanism as complementary to previously described mechanisms of DAC-induced immunomodulation. For example, the difference in the rapid dynamics of the decrease in CD25-expressing CD4+ T cells (Figure 1) in comparison to slow decrease in HLA-DR-expressing effector T cells (Figure 2) observed during DAC dosing suggest that the former is likely the consequence of the direct binding of the DAC to CD25 and is fully consistent with the rapidly induced trogocytosis by monocytes, observed in our in vitro mechanistic experiments. On the other hand, we believe that the slow, dose-dependent decline in the numbers of activated (i.e. HLA-DR-expressing) effector T cells is most likely an indirect effect of DAC therapy, caused by DAC-induced inhibition of T cell priming by dendritic cells, or killing of activated T cells by CD56bright NK cells.8,14
Footnotes
Acknowledgements
We thank the clinical centers and investigators who participated in the CHOICE study. The authors wish to acknowledge the many helpful contributions resulting from discussions with Jake Elkins, MD, of Biogen Idec, on the possible mechanisms of action of daclizumab.
Confidentiality
Use of the information in this manuscript for commercial, noncommercial, research, or purposes other than peer review not permitted prior to publication without expressed written permission of the author.
Conflicts of interest statement
Dr Bielekova is co-inventor on several NIH patents related to daclizumab and as such has received patent royalty payments. Ying Zhang, Lyubov Efros, Jia Shi, Meina Tang and Vladimir Vexler were employed by Protein Design Labs and PDL Biopharma, some of whose assets were acquired as a consequence of Abbott Laboratories’ (later AbbVie) acquisition of Facet Biotech. Merriam McClellan and James Sheridan are employees of AbbVie Biotherapeutics, a wholly owned subsidiary of AbbVie.
Funding
Participation of Dr Bielekova in this work was supported by the intramural research program of the NINDS/NIH.