
Abstract
Every year, significant amounts of non-biodegradable, toxic lubricants enter the environment. While legislative measures are being taken to reduce the environmental impact of this pollution, demand for environmentally acceptable lubricants (EAL) is increasing. These EALs differ in terms of their base oil and additives, thereby having a significant influence on the degradation behavior and degradation-related changes of tribological performance like oil film formation or boundary layer formation. However, the sensitivity of EALs to different degradation paths is not yet known. Therefore, the aim of this study is to determine the sensitivity of different lubricants to degradation based on their change in tribological performance. For this purpose, an ester- and polyglycol-based EAL as well as a mineral oil (polyalphaolefin) were degraded synthetically by oxidative and hydrolytic degradation. The degraded lubricants are visually, rheologically and chemically analyzed. In addition, the tribological performance in terms of oil film formation and tribological boundary layer formation was studied in a ball-on-disc tribometer. Afterwards the results are compared to their corresponding fresh lubricants. For the tested ester-based EAL no significant sensitivity to degradation could be shown, as no significant change in tribological performance occurred. Both polyalphaolefin and polyglycol proved to be sensitive to degradation leading to a significant reduction in the tribological boundary layer thickness. These results show, that mineral oil-based lubricants and EALs, as well as EALs themselves, differ in terms of their sensitivity to degradation. These effects must be considered in qualification process of lubricants.
Keywords
Introduction
Lubricants are used in order to reduce friction and prevent wear by separating the contacting surfaces of machine elements like bearings in machinery. During the operation of these machinery almost 50% of the lubricants used end up in the environment, which results in an annual pollution of 5 million tons of mostly non-biodegradable and toxic lubricants in Europe. 1 In sensitive application areas like forestry, shipping or food industry this pollution can have serious ecological consequences. The possibility of these ecological consequences led to stricter legal requirements in terms of the usage of lubricants in those sensitive application areas.2–5 Due to these legal requirements, operators of machinery have to use environmentally acceptable lubricants (EAL) in sensitive application areas.2–5
However, after switching from conventional mineral- or polyalphaolefine-based lubricants to EALs an increase in failures of machinery has been reported.6–8 A possible reason for this increase in failures could be a more severe degradation of EALs during operation compared to conventional lubricants, which could be caused by the different composition. 9 EALs consist of alternative base oils like esters or polyglycols and are restricted in terms of type and concentration of additives. Due to this different chemical composition, operational conditions and contaminants (e.g., oxygen and water) could lead to an accelerated degradation and promote degradation paths (DP) like oxidation and hydrolysis of the lubricant. These DPs can impair the properties of the lubricant (viscosity, effectiveness of additives) and therefore the tribological performance of the lubricant in terms of oil film formation and wear protection.10–16 An investigation of possible degradation-related changes in tribological performance is not considered in the current qualification processes of lubricants.17,18 This requires knowledge of the sensitivity of different lubricants to degradation.
Therefore, the aim of this study is to examine the sensitivity of different lubricants to oxidative and hydrolytic degradation based on their change in tribological performance. For this purpose, full formulated gear oils will be synthetically degraded. Afterwards, the tribological performance in terms of oil film formation and tribological boundary layer (TBL) formation will be investigated and compared to the corresponding fresh lubricants.
Materials and methods
Lubricants
In this study, three full formulated gear oils of ISO VG class 150 were used as lubricants. The lubricant properties are listed in Table 1.
Lubricant properties of used gear oils.
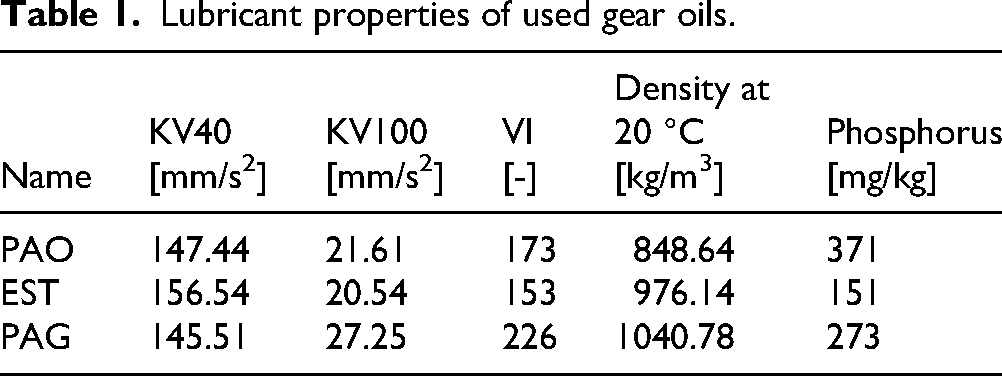
The kinematic viscosity at 40 °C (KV40) and 100 °C (KV100), as well as the density, were measured for all lubricants. Viscosity was determined using a capillary viscometer, and density was measured using a pycnometer. The values of the viscosity index (VI) were calculated based on the measured viscosity values. 19 The phosphorus content of the lubricants originating from the EP/AW additives was determined using inductively coupled plasma (ICP) analysis.
Synthetic degradation of lubricants
For the synthetic degradation of the lubricants a well-known test rig from industry (so called ZF-Apparatus) was used. Using the ZF apparatus, thermal-oxidative degradation in accordance with ASTM D2893 and hydrolytic degradation in accordance with ASTM D2619 can be performed on the lubricants.20,21 In addition, the ZF apparatus enables the degradation of lubricating oil in sufficiently large quantities (up to 6 liters) for subsequent analysis of the remaining tribological performance. 22 The schematic structure of the ZF-Apparatus is shown in Figure 1 and is explained in more detail below.
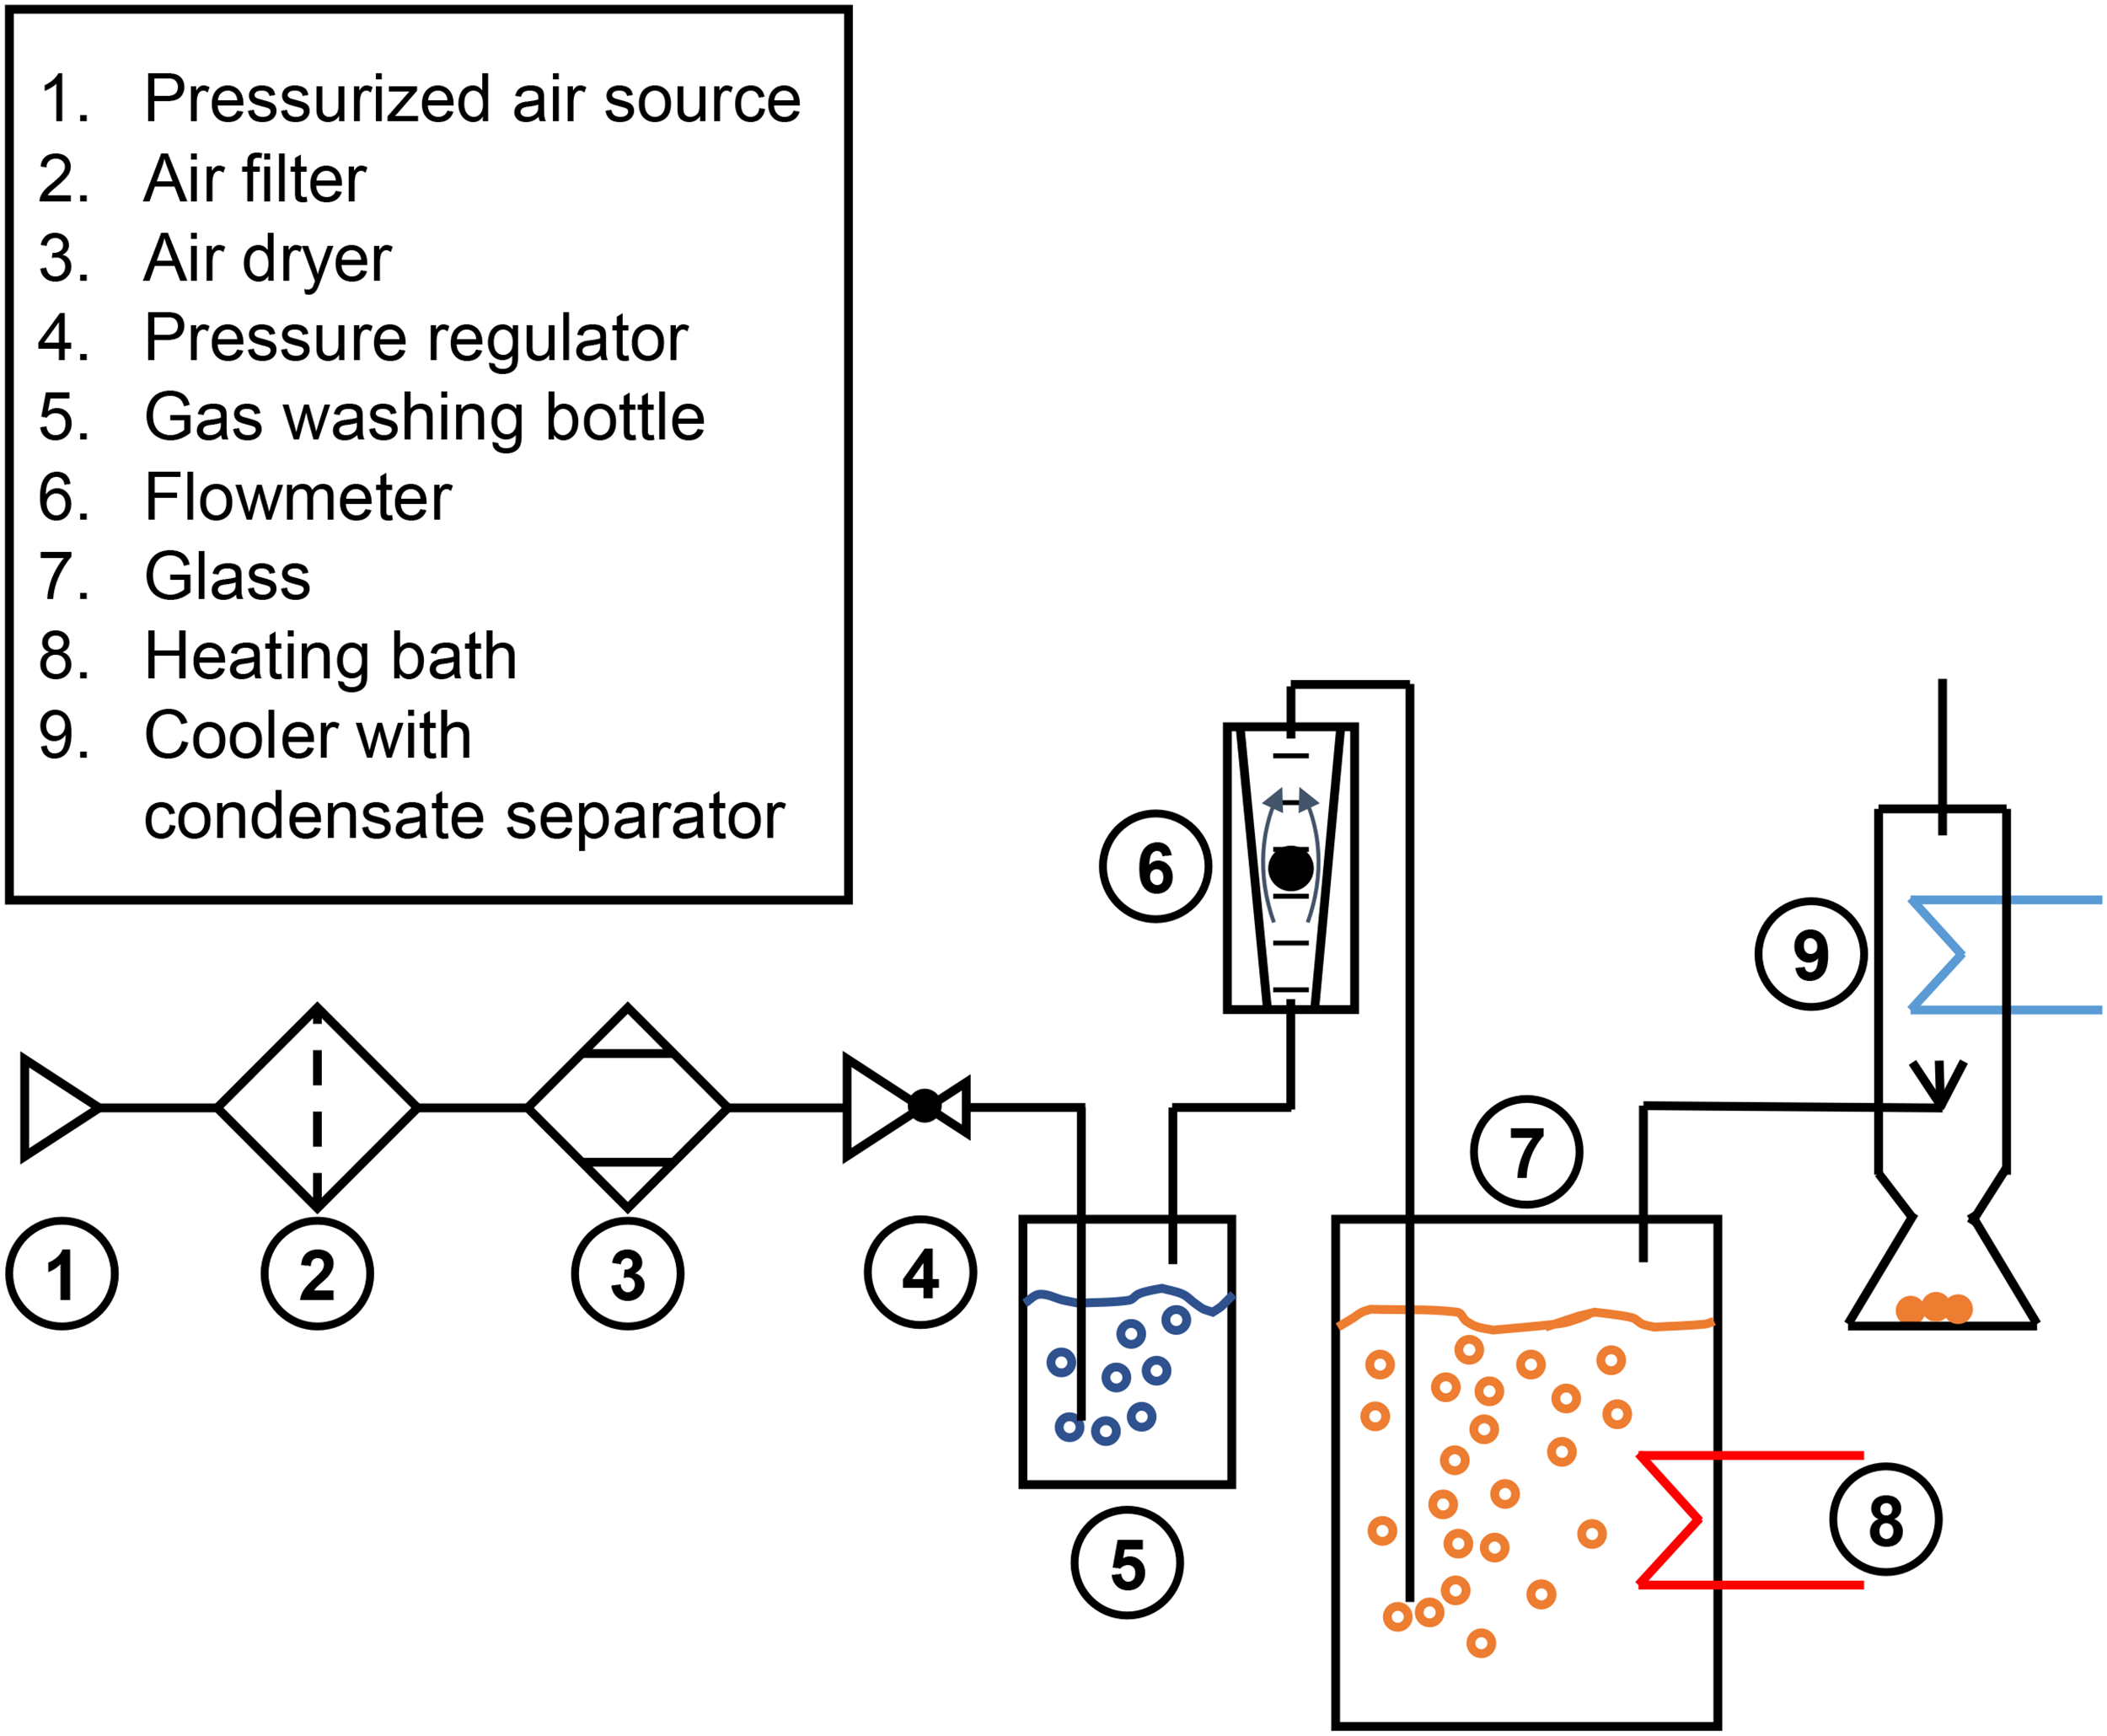
Schematic structure of the ZF-Apparatus.
In the structure shown, pressurized air is fed into the system by a compressor (1). The pressurized air is then passed through two filters with increasing fineness (5 µm (2) and 0.01 µm (3)) to remove contaminants such as particles, water and the compressor oil. The pressure of the air flow is then reduced to 1 bar above ambient pressure in a pressure regulator (4) and passed through a gas washing bottle (5). The gas washing bottle is filled with distilled water to ensure a flow of saturated, humid air. After the gas washing bottle, the air flow is directed to a flowmeter (6), where it is divided into three individual air streams with defined flow rates. The individual air flows are then directed into the three sealed glasses (7). The glasses are placed in a heating bath (8) to regulate the temperature of the lubricant. Through another opening in the glass, the air flow is directed into a cooler (9), where volatile components condense and are collected in a separate vessel.
Two DP were carried out for the synthetic degradation of the lubricants in the ZF-Apparatus. DP1 aims at thermal-oxidative degradation of the lubricant and is based on ASTM D2893. During degradation, a temperature of 121 °C and a saturated air flow rate of 10 L/min were set. 20 For DP2, distilled water was added to the glass in accordance with ASTM D2619 to simulate hydrolytic degradation of the lubricant. 21 The water concentration was 25% by weight. In accordance with ASTM D2893, the test duration for both DPs was 312 h. After the tests, samples of the degraded lubricants were chemically and rheological analyzed. The chemical analysis of the samples focused on the properties of lubricants that are typically affected by degradation. These include changes in kinematic viscosity, neutralization number and the content of phosphor, which is an indicator for the EP/AW-additives used in the lubricants. The kinematic viscosity was determined using a capillary viscometer in accordance with DIN 51659-3, the neutralization number was measured by titration following DIN ISO 6618, and the phosphorus content was determined by ICP analysis according to DIN 51399-1.
Evaluation of oil film formation
The lubricant's ability to form a separating lubricating film between contacting surfaces was evaluated using a ball-on-disc configuration in a mini-traction machine (MTM), combined with electric contact resistance (ECR) measurements (Figure 2).
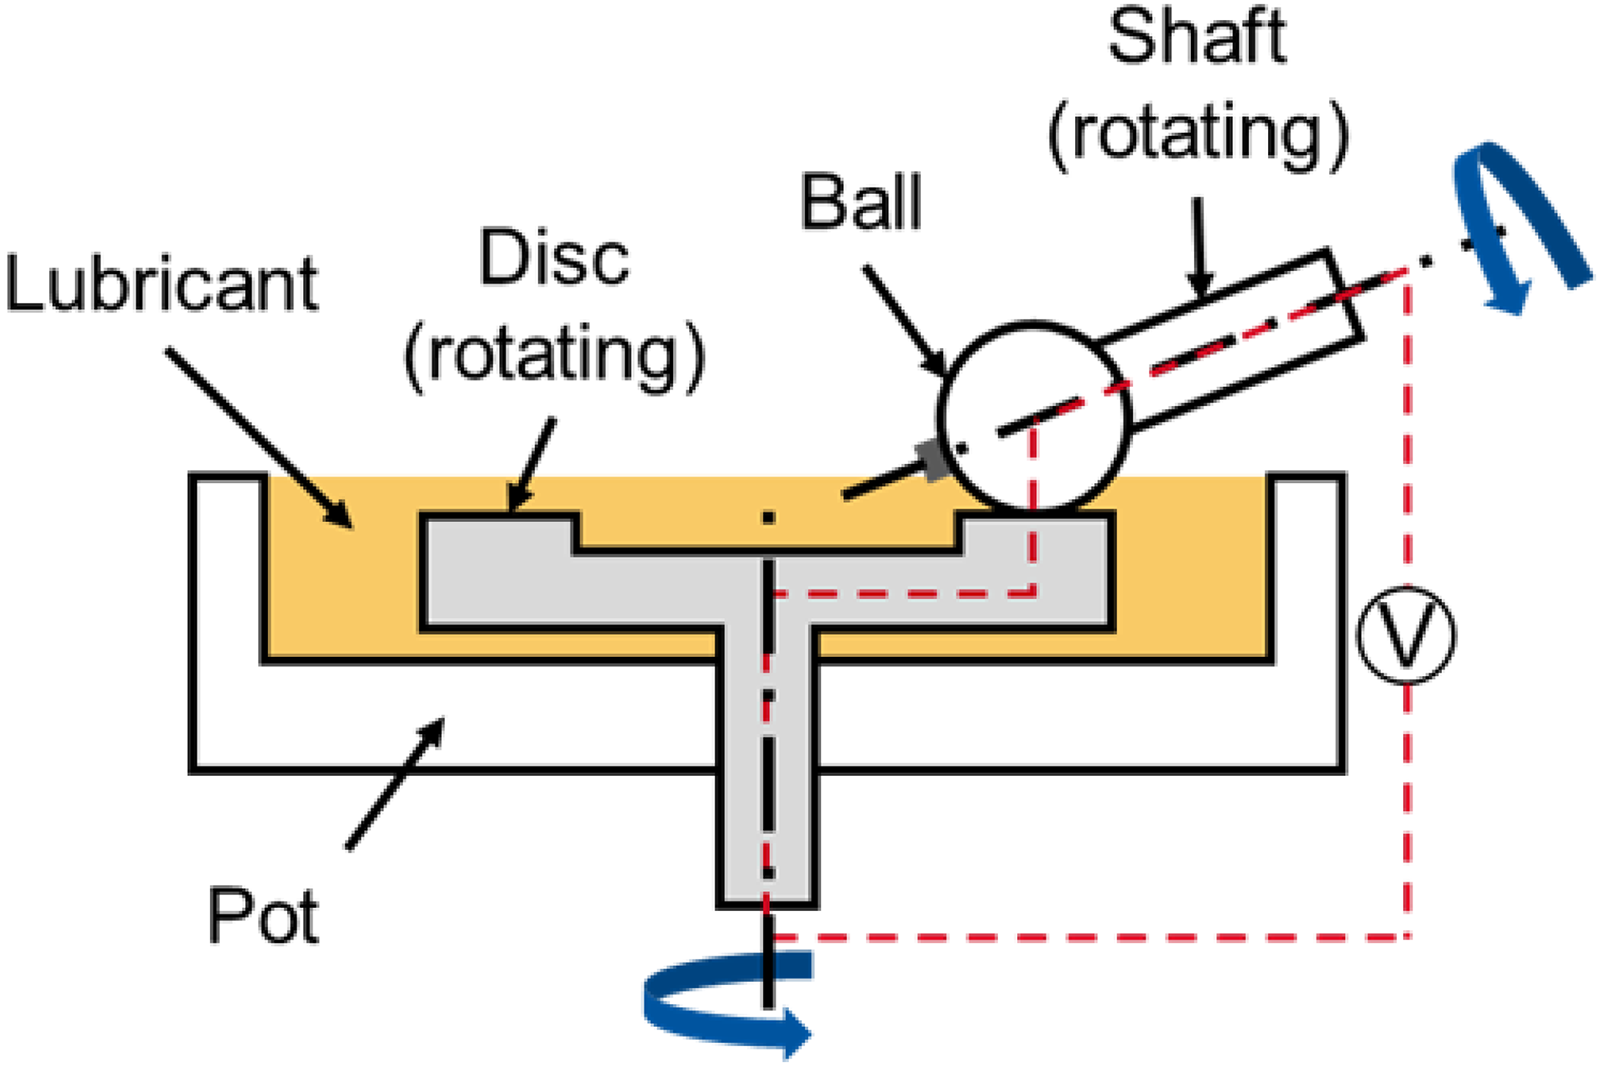
Schematic representation of the ball-on-disc configuration of the MTM (according to 23 ).
In the configuration shown, a ball with a diameter of 19.05 mm and a disc are used as test specimens. Both test specimens are made of 100Cr6 bearing steel and have Ra values of 0.01 μm. In the tests, the ball and disc are pressed against each other with a load of 75 N (1250 MPa). A lubricant temperature of 60 °C was selected, which reflects a typical temperature for lubricants in gearboxes.23,24 The ball and disc of the MTM are driven independently by two motors, allowing precise control of the slide-roll ratio (SRR). The SRR is typically expressed as a percentage, where a SRR of 0% corresponds to pure rolling and a SRR of 200% corresponds to pure sliding. During these measurements the SRR is kept constant at 0%, while the rolling speed is gradually reduced from 2500 mm/s to 5 mm/s. After the tests a sigmoid curve (yellow line in Figure 3) was fitted according to the measuring points of ECR (blue points in Figure 3).
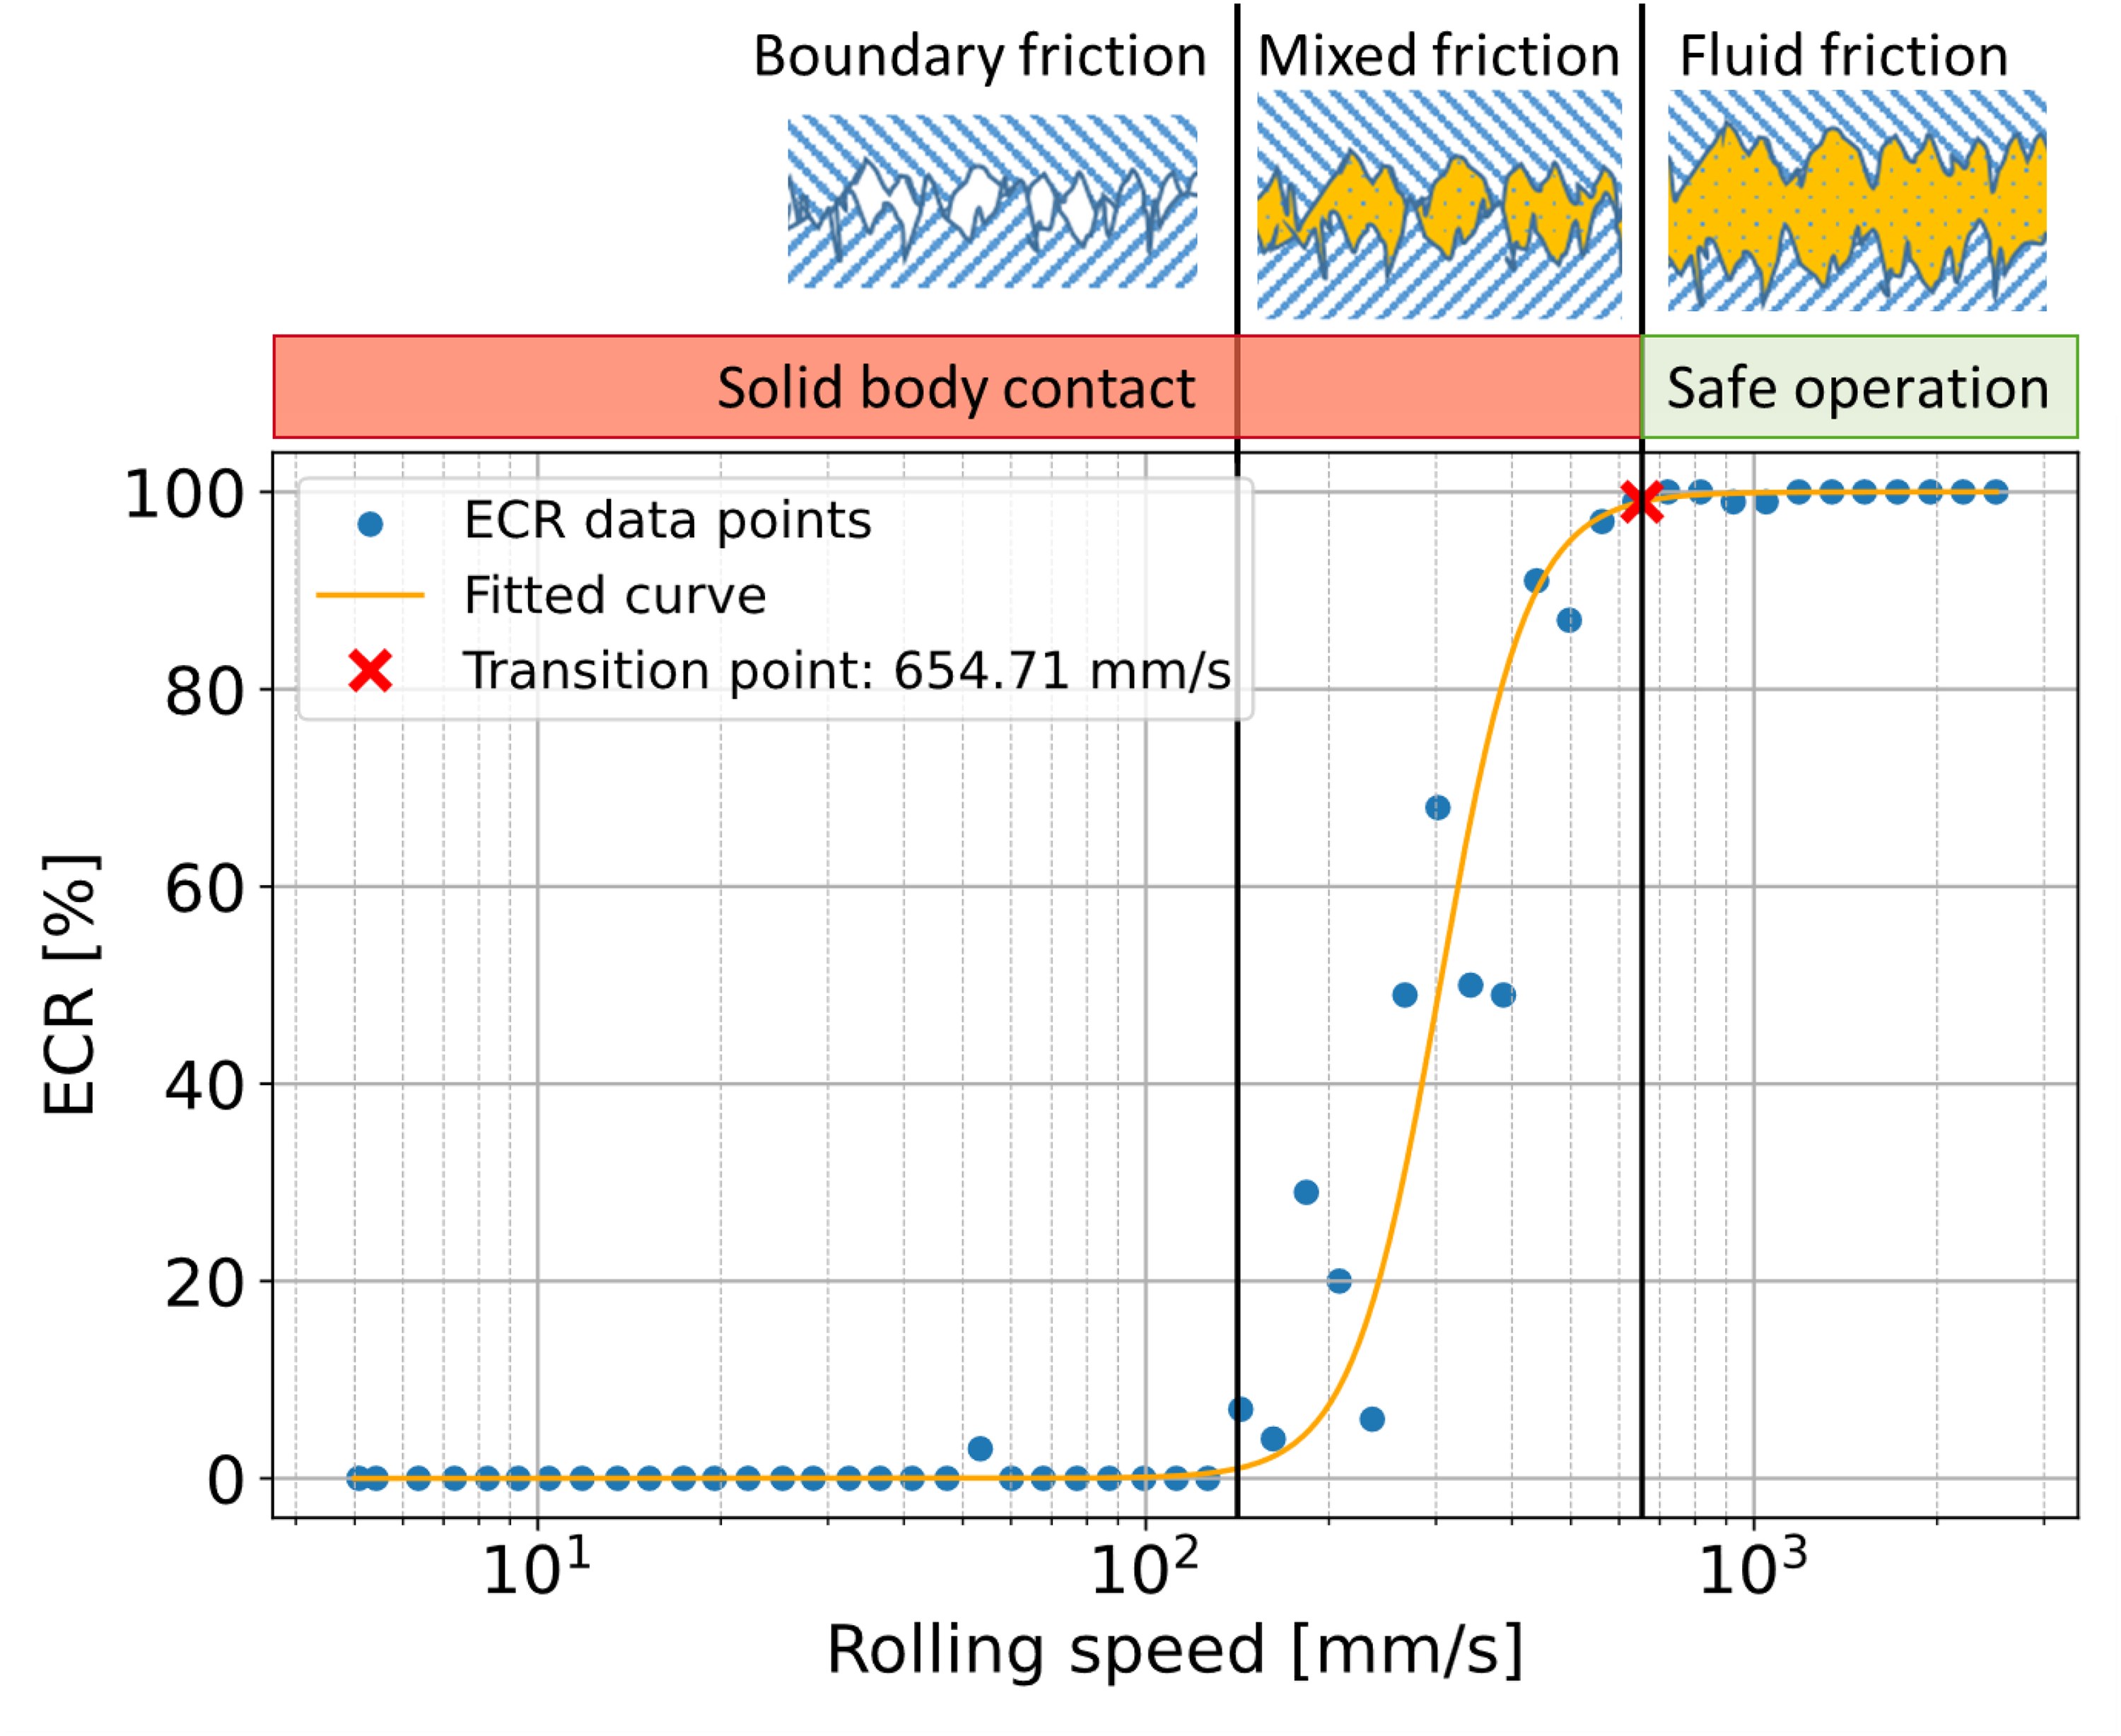
Determination of the transition point based on the measurement of the contact resistance.
To evaluate oil film formation, the rolling speed at the transition from fluid to mixed friction was determined. For this purpose, the rolling speed at which the sigmoid ECR curve first falls below 100% was identified (red cross in Figure 3). When the ECR value drops below 100%, the electrical contact resistance decreases due to direct contact between the roughness peaks of the ball and the disc indicating the transition from fluid friction to mixed friction. If the transition from fluid friction to mixed friction occurs at low rolling speeds, the lubricant ensures a thick and stable oil film. Accordingly, low rolling speeds at the transition to mixed friction are preferable in terms of wear-resistant oil films. Based on preliminary results this method has a deviation of around 13%.
Evaluation of tribological boundary layer formation
During mixed or boundary friction, wear protection is provided by a tribological boundary layer. This tribological boundary layer (TBL), also referred to as a tribofilm, forms as a result of reactions between EP/AW additives and the contacting surfaces, thereby protecting them from wear. Accordingly, the remaining effectiveness of EP/AW additives in degraded lubricants is critical for wear protection and is therefore investigated. For the investigation, the ball-on-disc configuration of the MTM was expanded by an optical system, the so-called spacer layer imaging method (SLIM). This configuration can be seen in Figure 4. The test parameters were a contact load of 75 N (1250 MPa), a lubricant temperature of 120 °C, a SRR of 50%, and a specific lubricating film height (λ) of 0.5. These test parameters are typically used in the literature for investigations of TBL on the MTM.25–29 The corresponding rolling speeds for lubricants are determined based on the λ value and the respective lubricant properties (Table 1). This results in a rolling speed of 51 mm/s for PAO, 50 mm/s for EST and 33 mm/s for PAG.
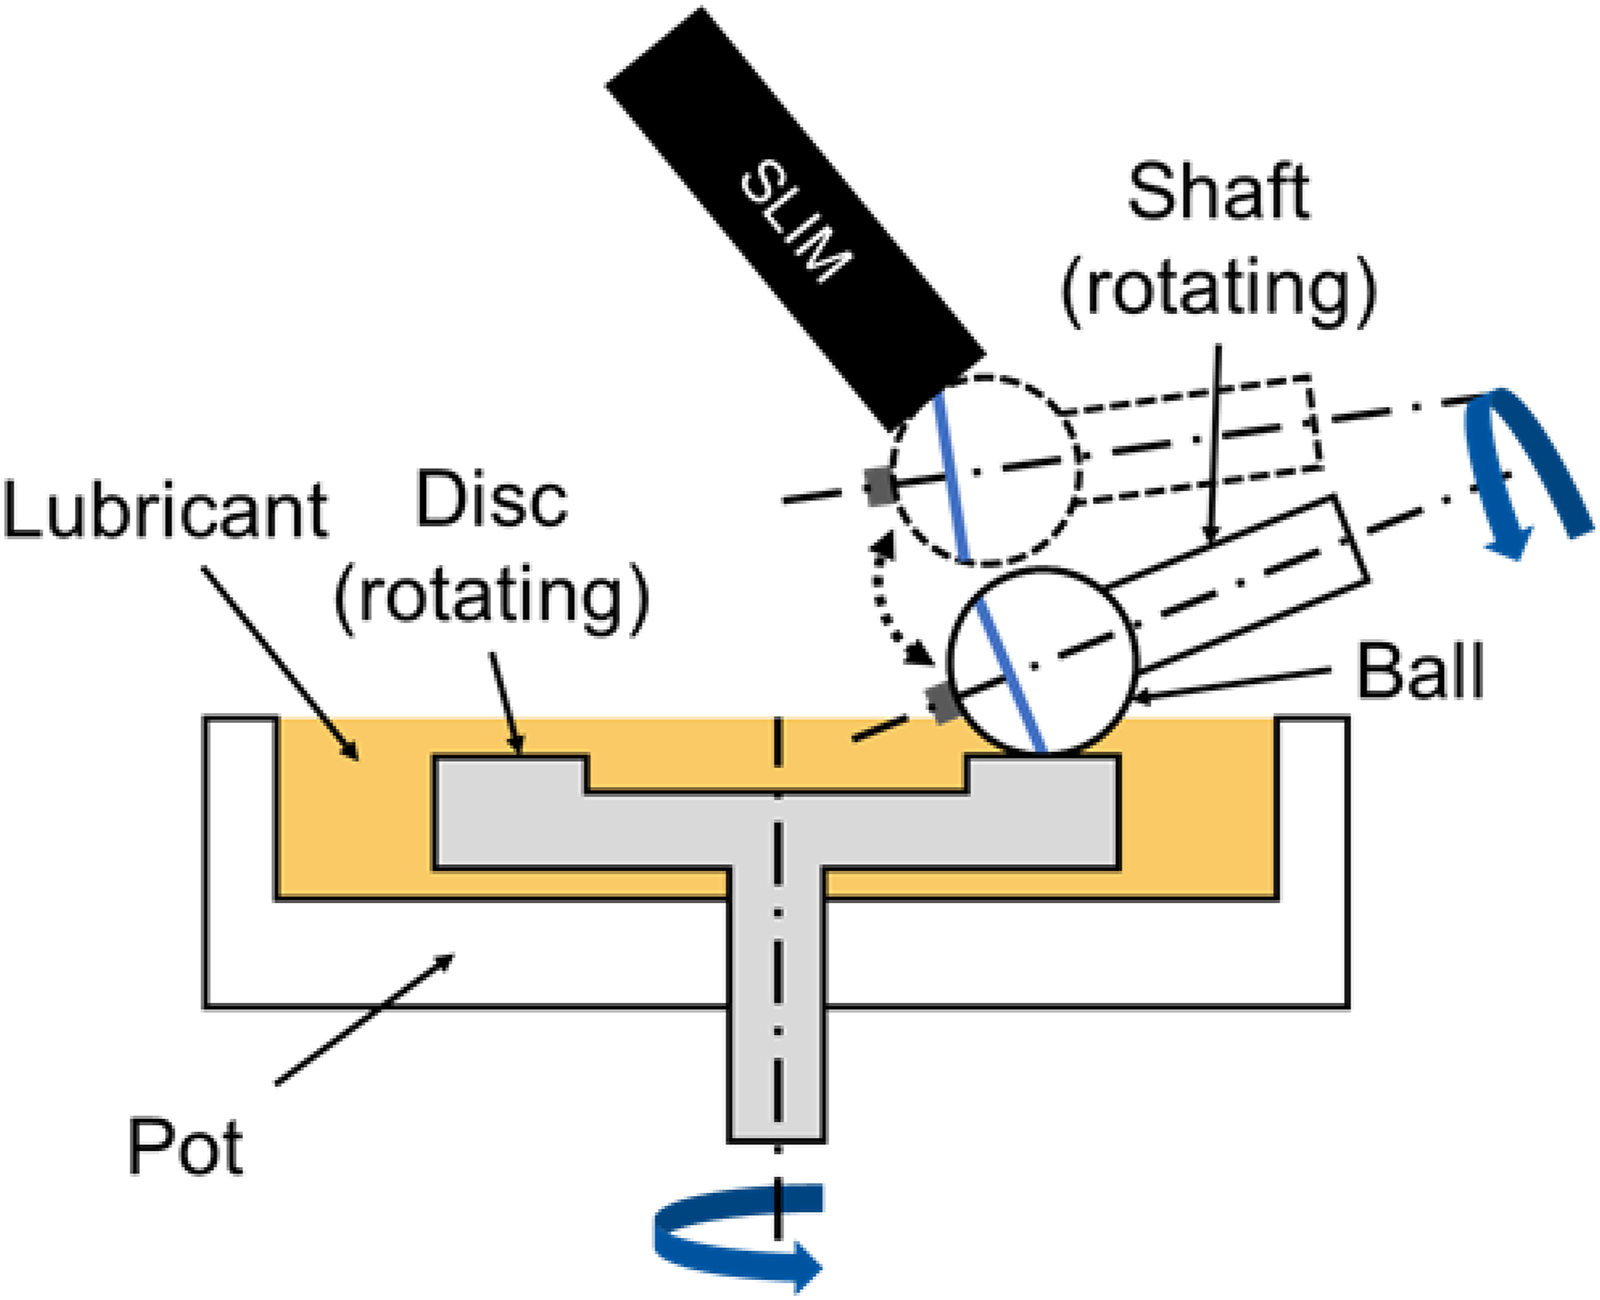
Schematic illustration of the ball-on-disc configuration of the MTM with the SLIM extension.
To analyze TBL formation, the ball is pressed against a glass disc coated with a semi-transparent layer of chromium and silicon dioxide at defined time intervals during the test. The contact surface between the glass disc and ball is illuminated with white light. This light is reflected partly by the chrome layer and partly by the steel ball. If a TBL has formed on the steel ball, the light waves must pass the boundary layer before they are reflected by the steel surface. The reflected waves from the steel ball and glass disc form an interference pattern, which is then recorded by a camera. The thickness of the boundary layer can be determined by comparing the interference pattern with a calibrated map. If the process is repeated at several time steps during the experiment, the transient boundary layer formation during the experiment can be determined.27,28,30 Therefore, after a test duration of 5 min, 10 min, 15 min, 30 min, 45 min, 60 min, 90 min, 120 min, 150 min, 180 min, 210 min, and 240 min, a SLIM image is created. Based on these SLIM images the mean boundary layer thickness is determined.
Results
This section presents the results of rheological and chemical analysis. Furthermore, the results of the tribological performance in terms of oil film formation and TBL formation are shown. The results for the fresh samples are marked with a green dot, while the degraded samples are marked with a red triangle (DP1) and a blue square (DP2).
Rheological and chemical analysis
This subsection describes the changes of the oil samples due to degradation based on the changes in visual appearance as well as rheological and chemical properties. In Figure 5 the changes in visual appearance of fresh and degraded oil samples are presented.
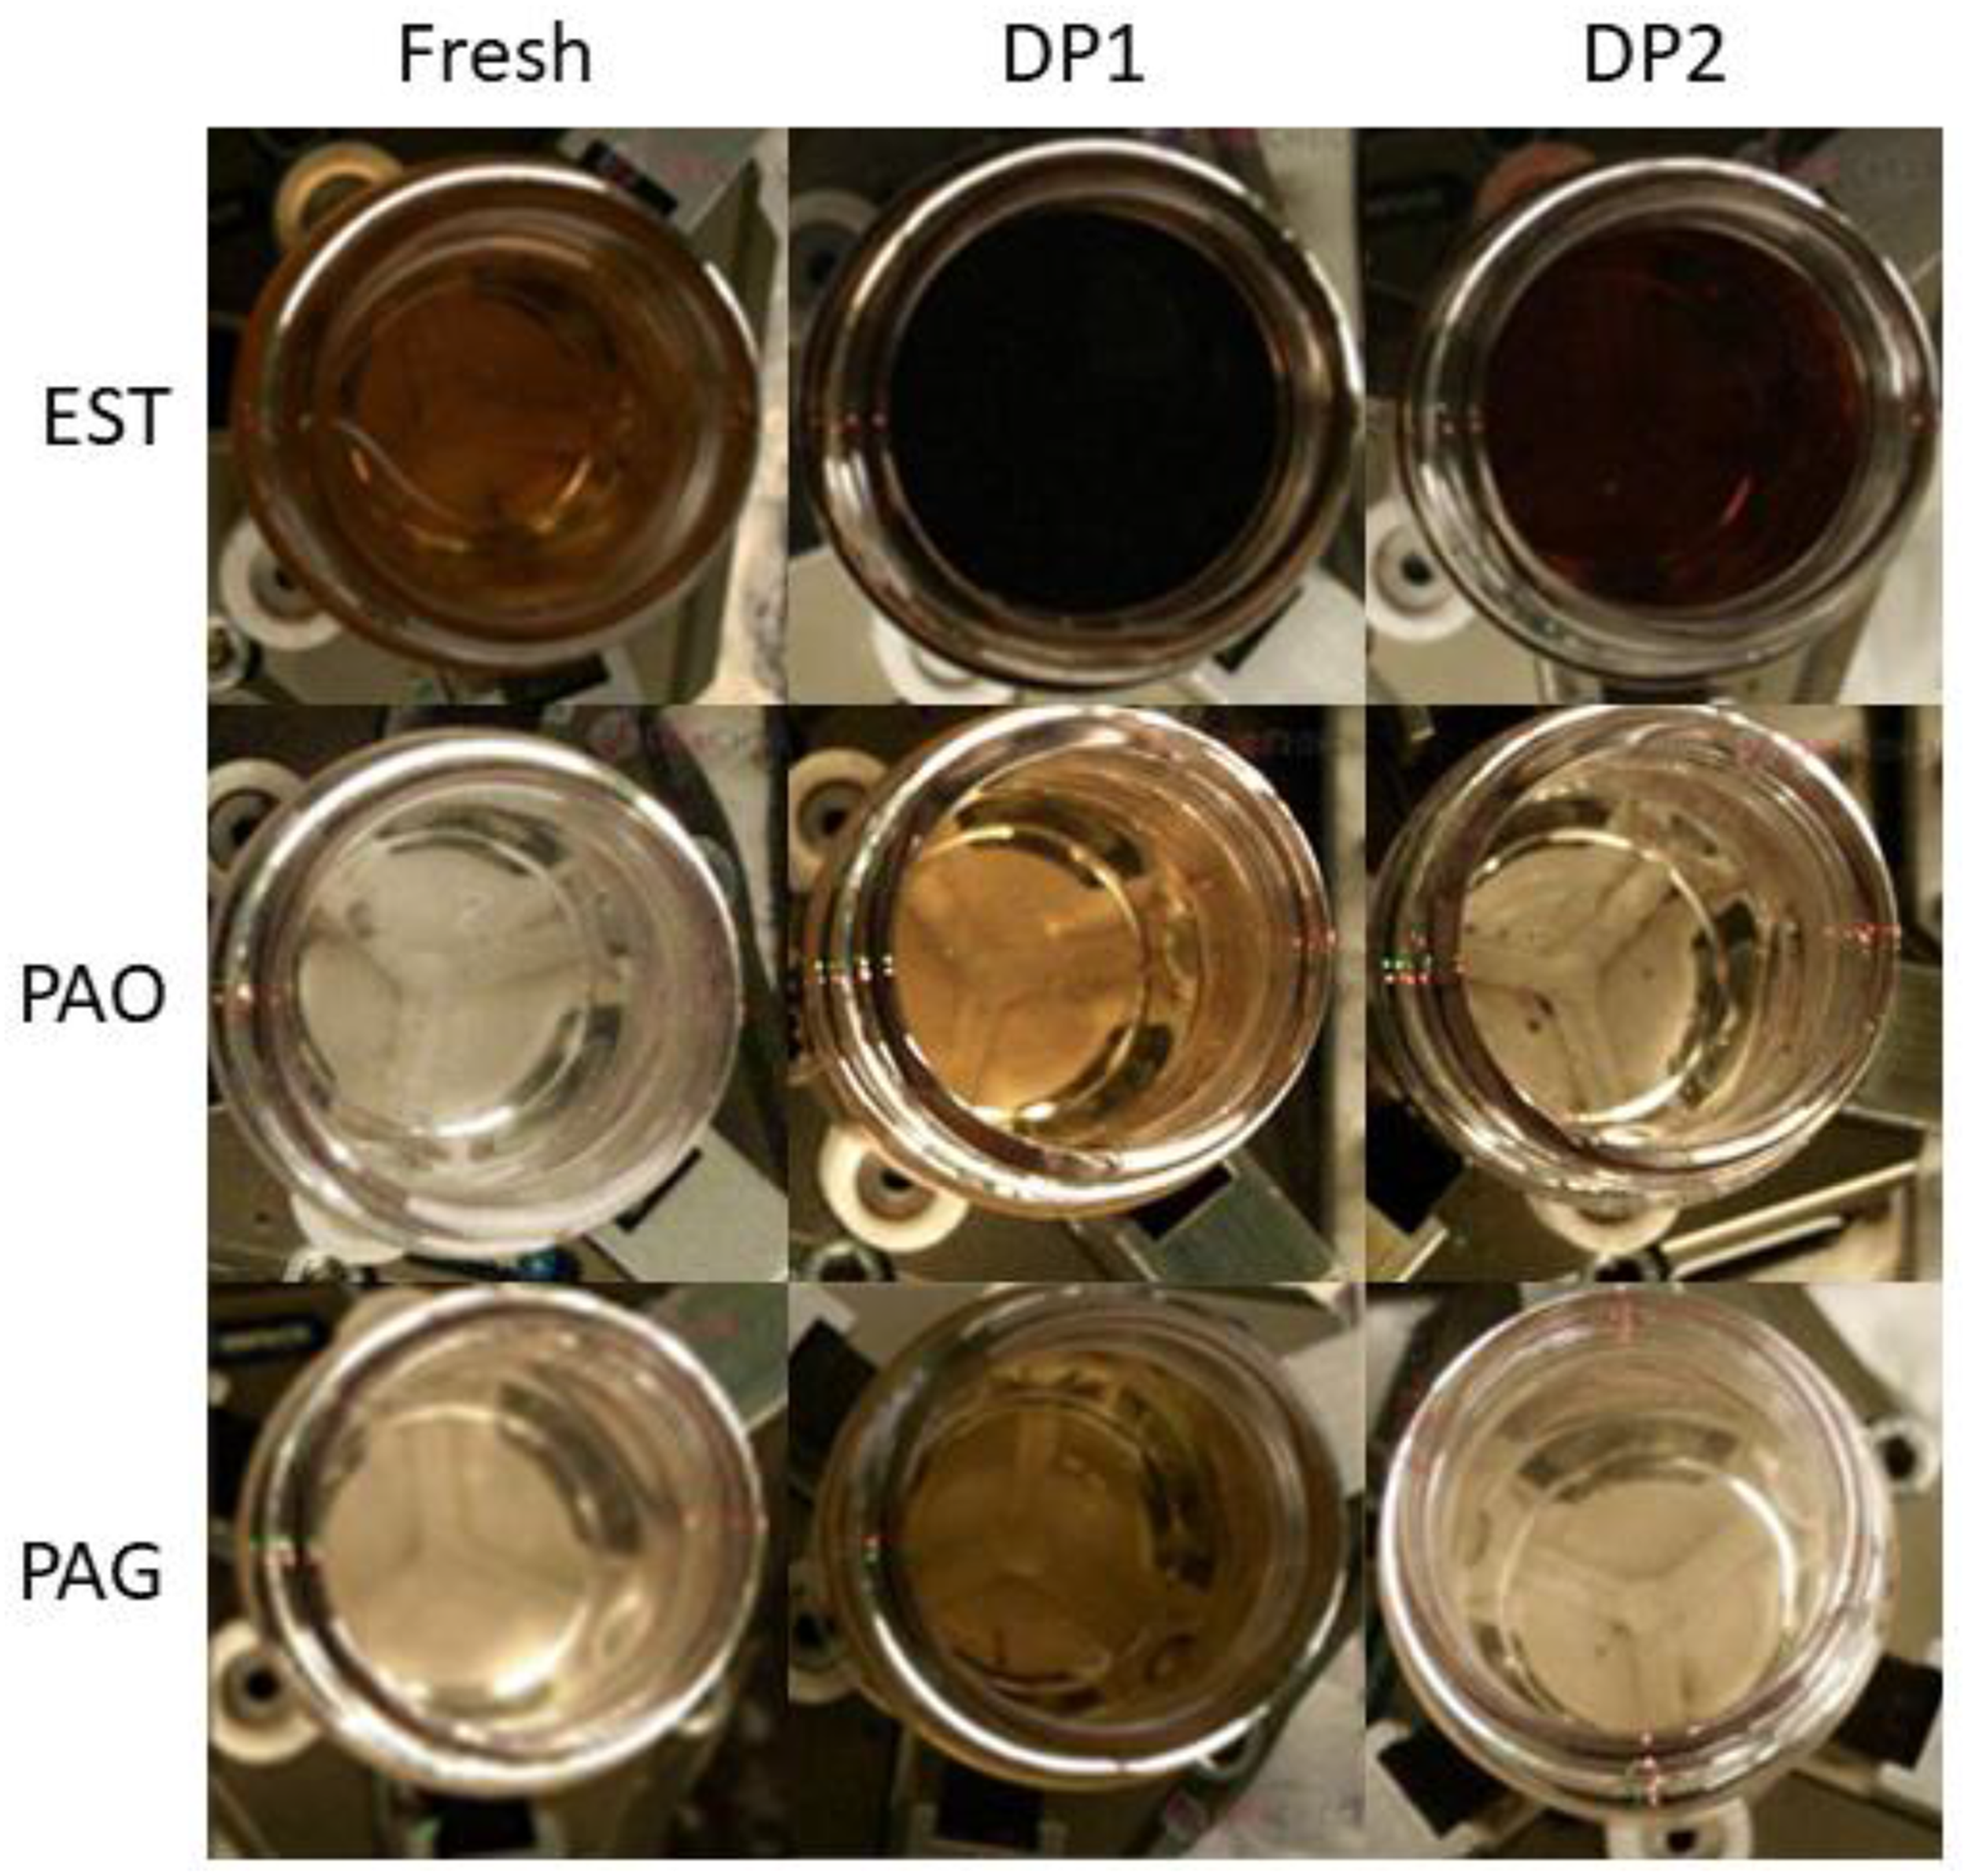
Comparison of visual appearance of fresh and degraded oil samples for determination of degradation related changes.
The pictures show a darkening of the color for all degraded oil samples. EST changes color from light brown to black as a result of DP1 and DP2. DP1 results in a darker color than DP2 for EST. With PAO and PAG, the color of the oil sample changed from a transparent, colorless tint to a darker tint. Similar to EST, DP1 tended to cause darker discoloration of PAO and PAG. The changes in kinematic viscosity under ambient pressure are shown in Figure 6. The diagrams show the kinematic viscosity of each lubricant (fresh and degraded) for the temperature range from 40 to 120 °C. The curves were extrapolated based on ASTM D341 using the measured values for V40 and V100. 31 The diagrams show that DP1 and DP2 did not cause any significant change in viscosity for the respective lubricants, as the curves are almost identical. In a next step, the viscosity was examined more closely at temperatures of 60 °C and 120 °C, as these correspond to the temperatures selected for the tests. In terms of kinematic viscosity at 60 °C, a slight increase in viscosity was observed for all lubricants with both DPs. DP1 tended to have a stronger influence on the viscosity of lubricants at 60 °C than DP2. The maximum increase of viscosity was 2.5% for PAG and DP1. Similar to the viscosity at 60 °C, a slight increase in viscosity could also be seen for all lubricants with both DPs at 120 °C. PAG also showed the biggest change in viscosity (4.2%) due to DP1.
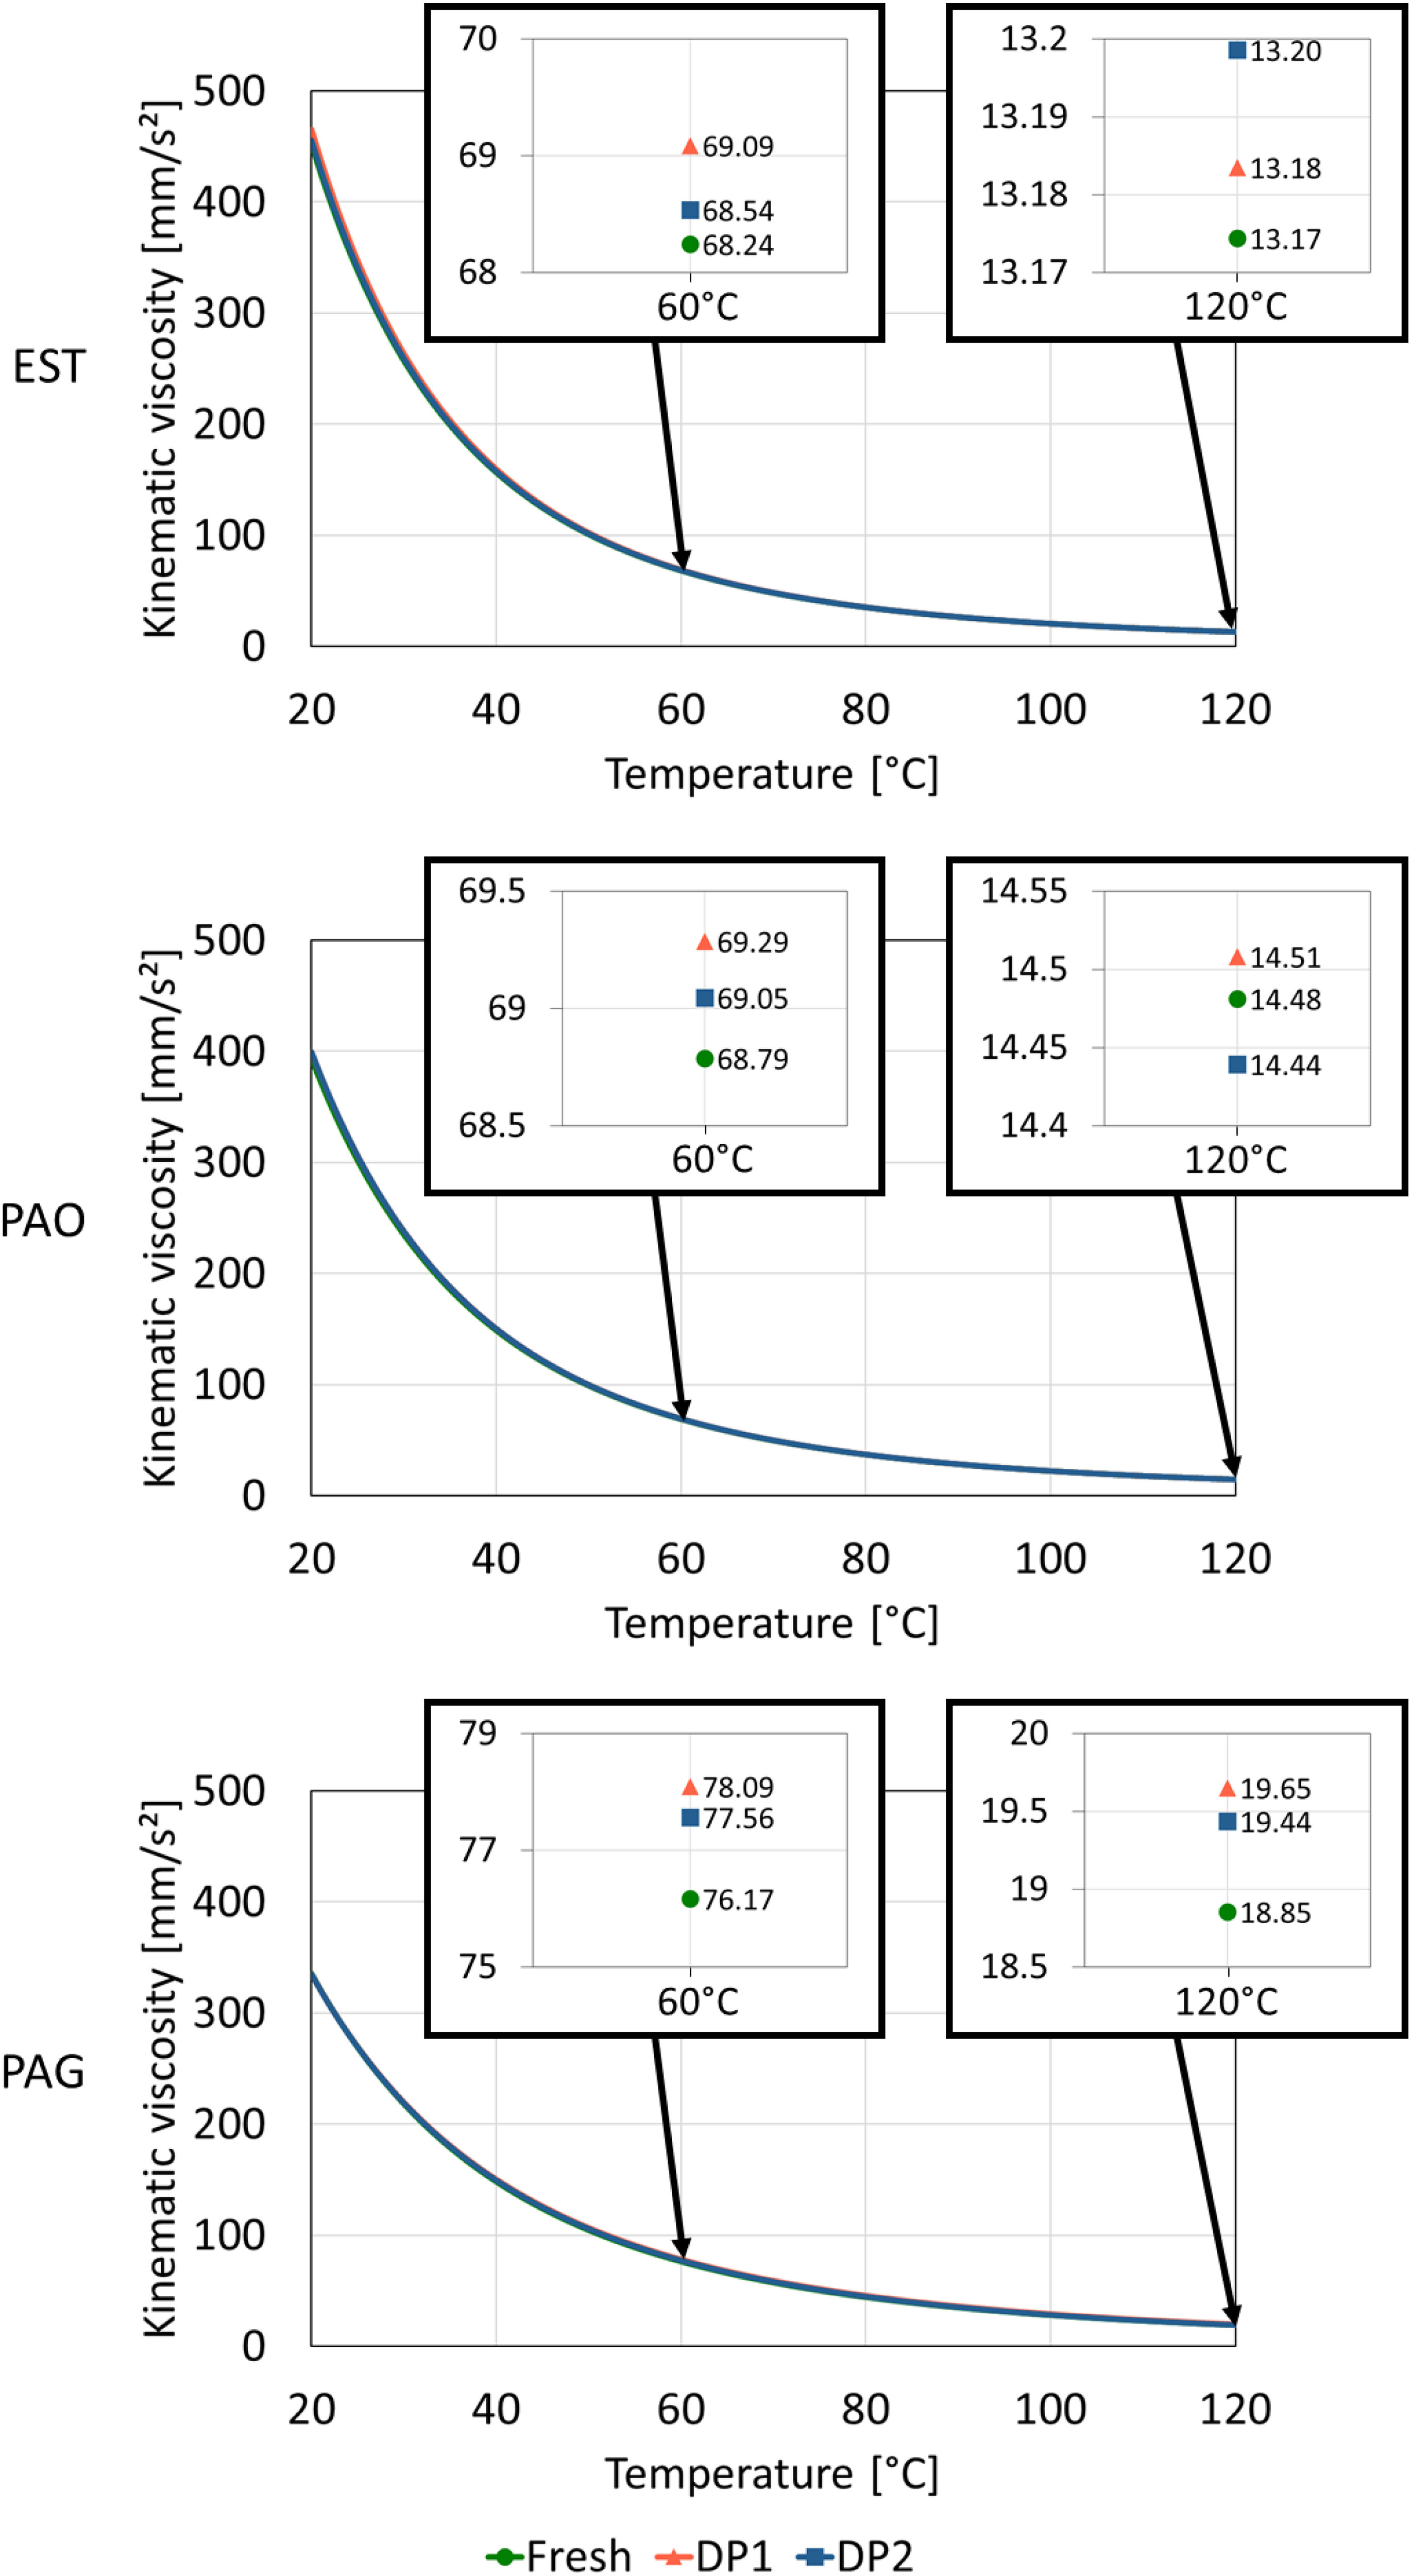
Comparison of kinematic viscosity of fresh and degraded oil samples for determination of degradation related changes.
The neutralization number of the oil samples was determined to investigate the change of acidic components due to degradation. The results of this analysis are presented for the fresh and degraded oil samples of each lubricant in Figure 7. The neutralization number of EST showed a significant decrease due to DP1, which led to a reduction by 0.43 (44.3%). The reduction in the neutralization number of EST due to DP2 was 0.1 (10.3%), which was smaller than DP1.
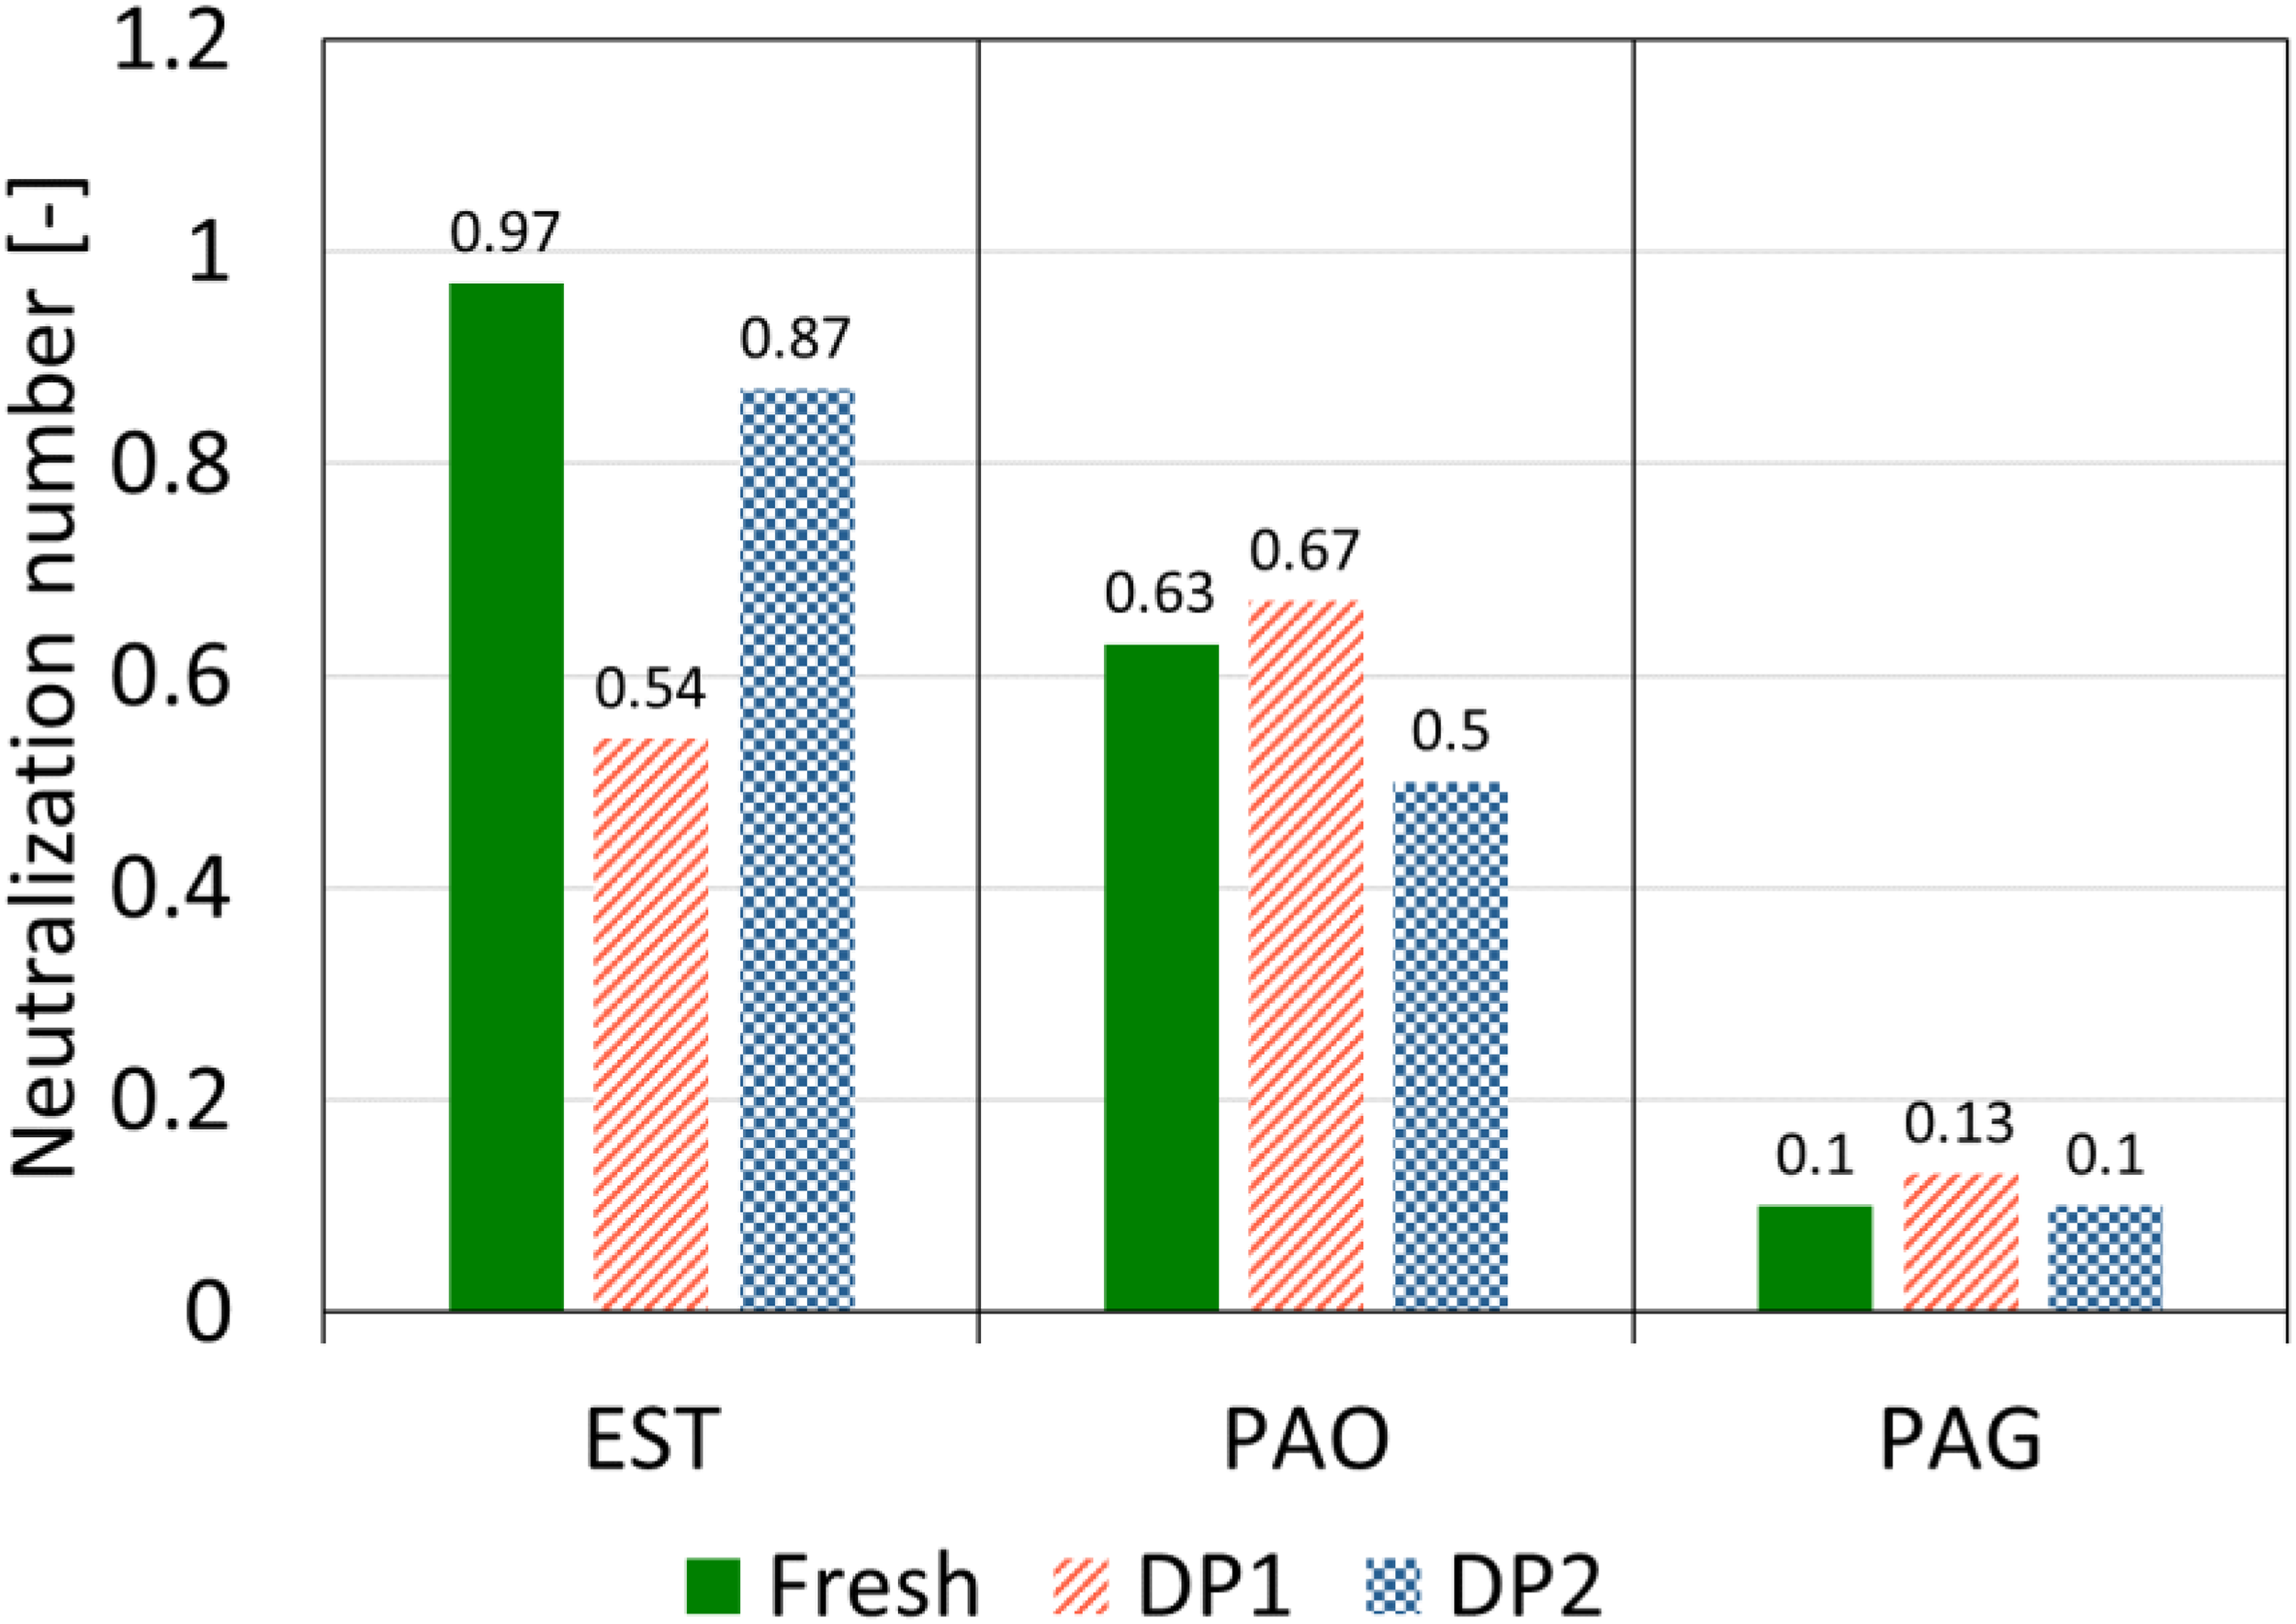
Comparison of neutralization number of fresh and degraded oil samples for determination of degradation related changes.
For PAO, DP1 had less influence on the neutralization number than DP2. While DP1 did not cause a significant change in PAO (0.04), DP2 resulted in a slight reduction of 0.13 in the neutralization number. Overall, the observed changes corresponded to an increase of 6.3% for DP1 and a decrease of 20% for DP2. In the case of PAG, both DPs had no effect on the neutralization number and only led to negligible changes. Nevertheless, with the exception of EST degraded by DP1, the changes in the neutralization number for all degraded oil samples remain within the expected standard measurement deviation of 10%.
The results of the elemental composition of the oil samples are shown in Figure 8. The diagram shows the change in phosphorus content of EST, PAO, and PAG as a result of DP1 and DP2 compared to the fresh sample. For EST, a slight decrease in phosphorus content was observed for both DP1 and DP2, with a greater reduction for DP2 (17 ppm, 11%) compared to DP1 (6 ppm, 4%). A similar trend was observed for PAO, where DP2 caused a more pronounced decrease in phosphorus content (51 ppm, 13.7%) than DP1 (8 ppm, 2%). PAG exhibited the same behavior, with a reduction of 20 ppm (7%) for DP2 and 9 ppm (3%) for DP1. The results of the oil samples degraded by DP1 and DP2 show a tendency towards a reduction in phosphorus content compared to the corresponding fresh lubricant. Here, the lubricants degraded by DP2 tended to show a greater reduction than DP1. However, with the exception of PAO degraded by DP2, the individual reductions in phosphorus content of the degraded oil samples fall within the expected standard measurement deviation.
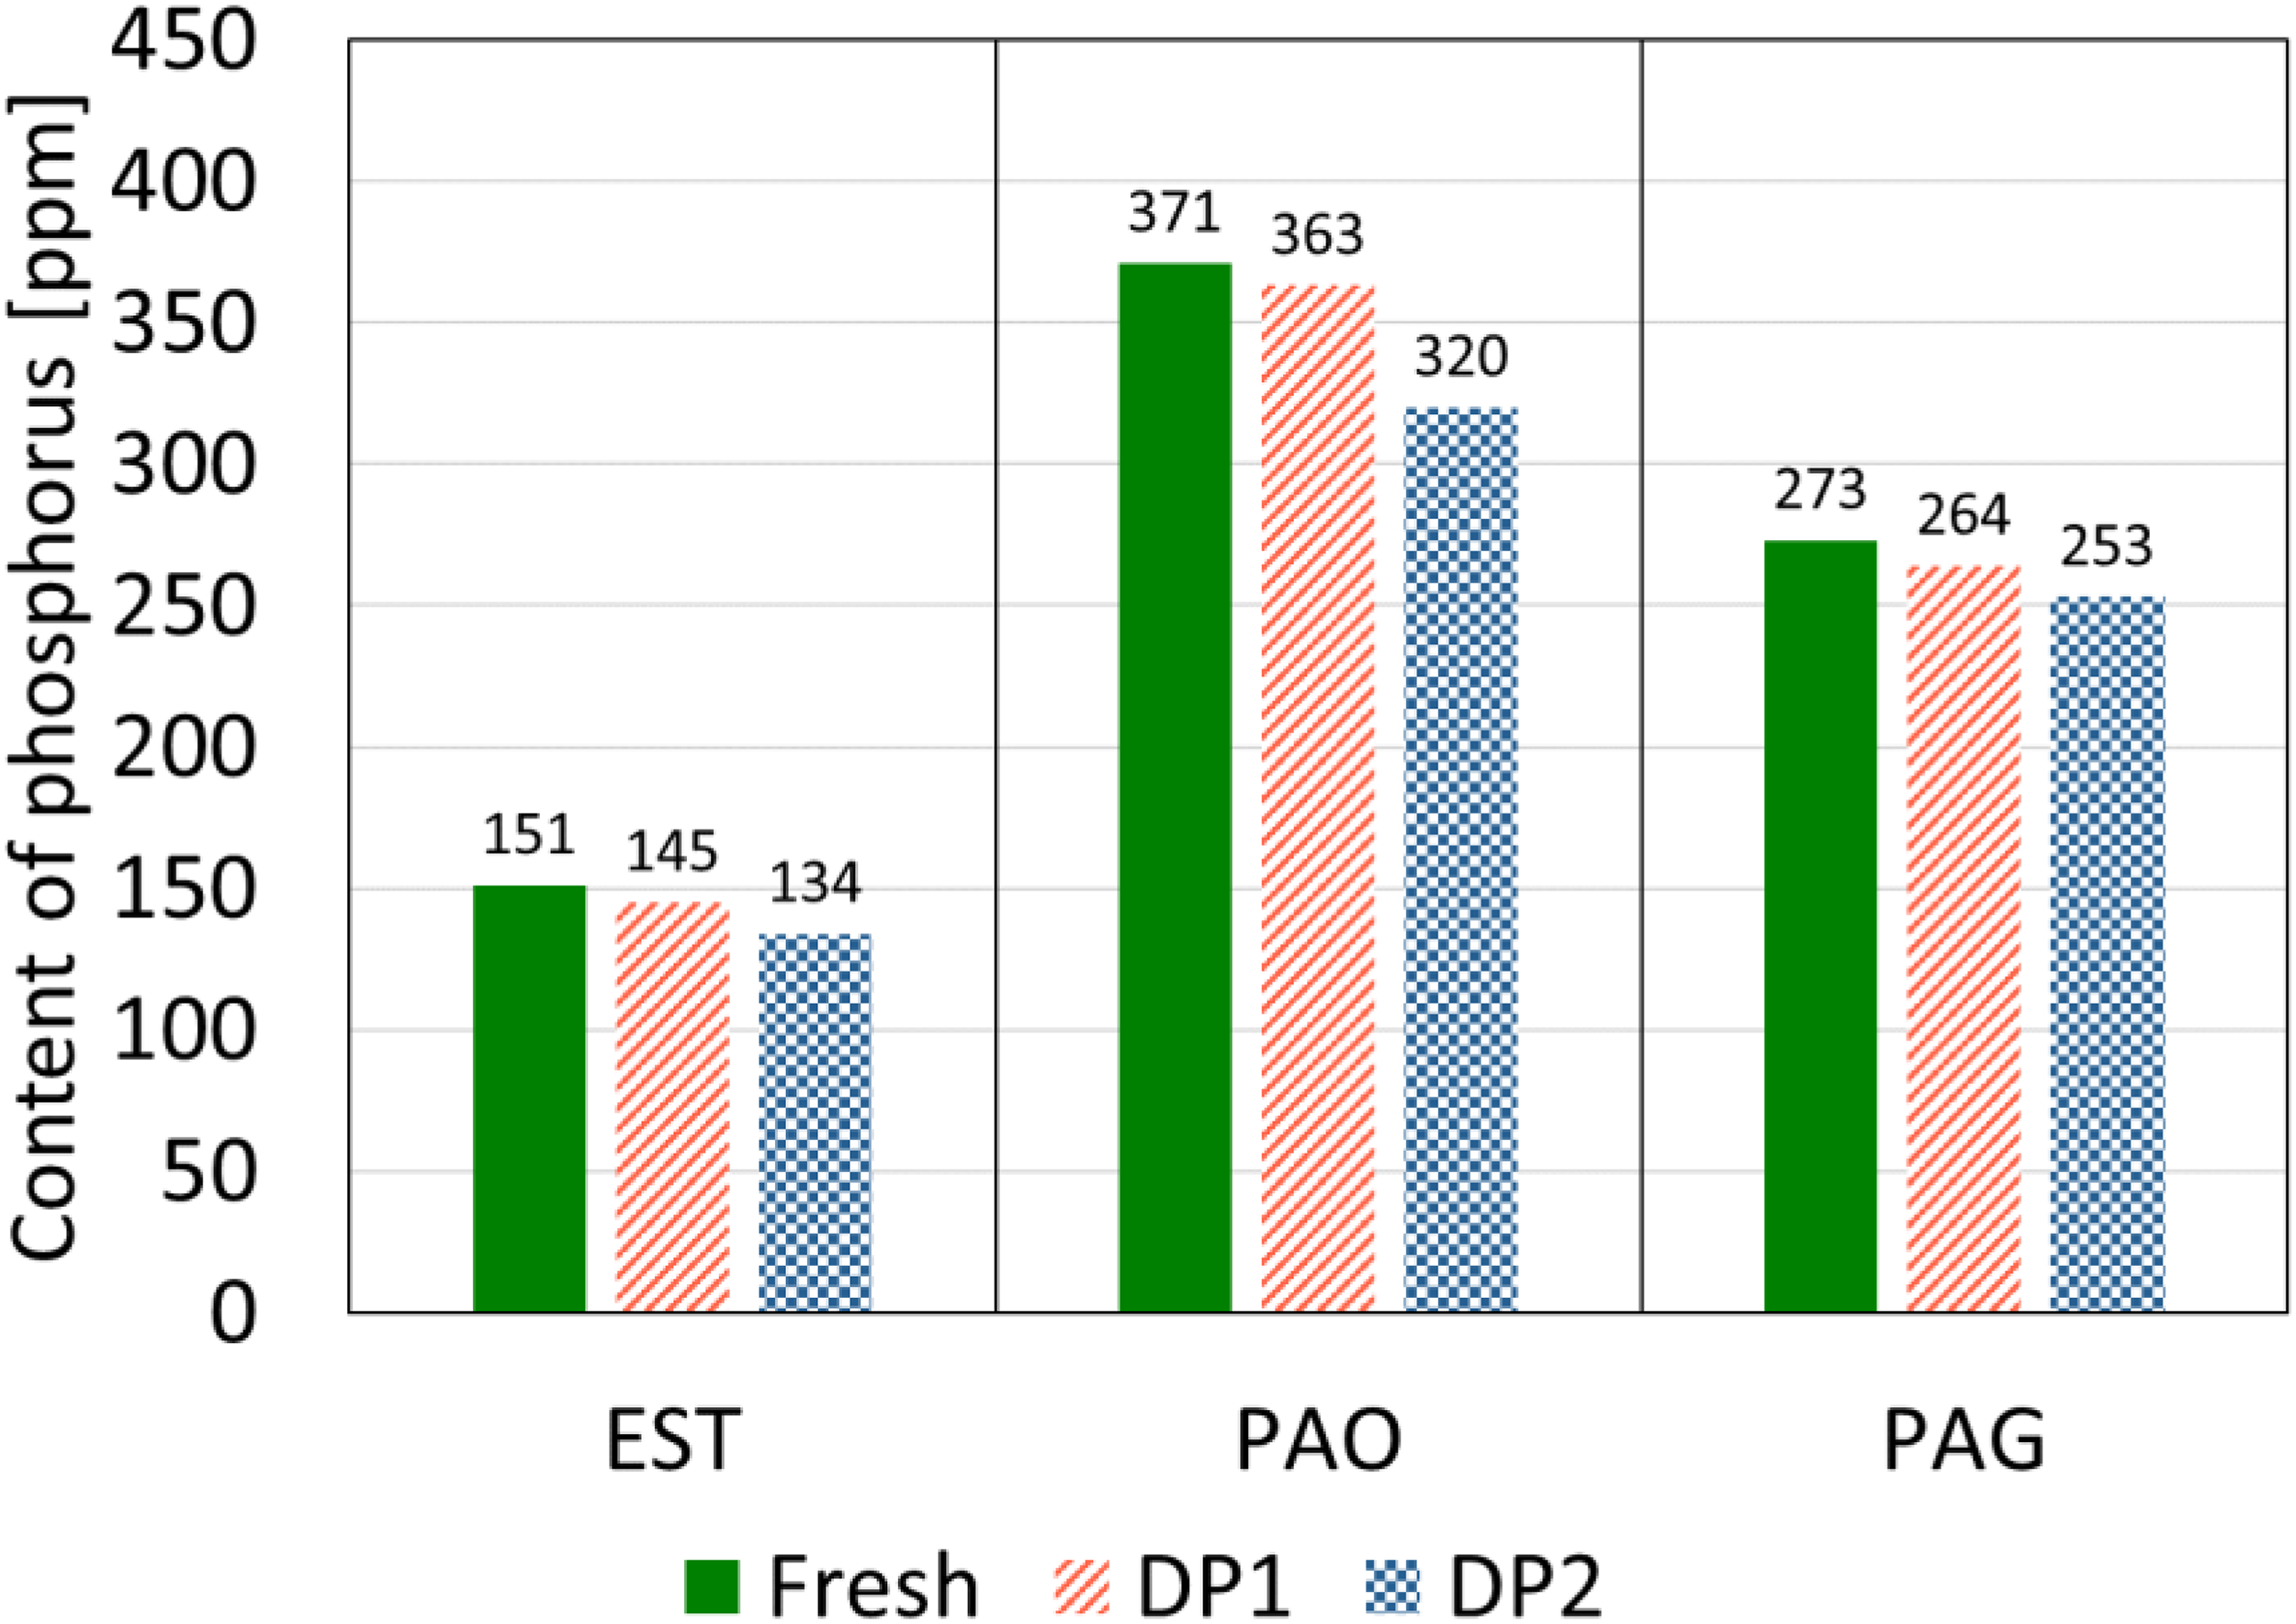
Comparison of content of phosphorus of fresh and degraded oil samples for determination of degradation related changes.
Oil film formation
In this subsection the results of the oil film formation of the fresh and degraded lubricants are presented. The results of the transition points from mixed to fluid lubrication are presented in Figure 9 for fresh and degraded samples of EST, PAO and PAG. It can be seen that the impact of both DPs on rolling speed at transition point of the lubricants is not significant. The observed changes fall within the 13% uncertainty of the measurement method. Therefore, the oil film formation of all lubricants was not significantly influenced by both DPs.
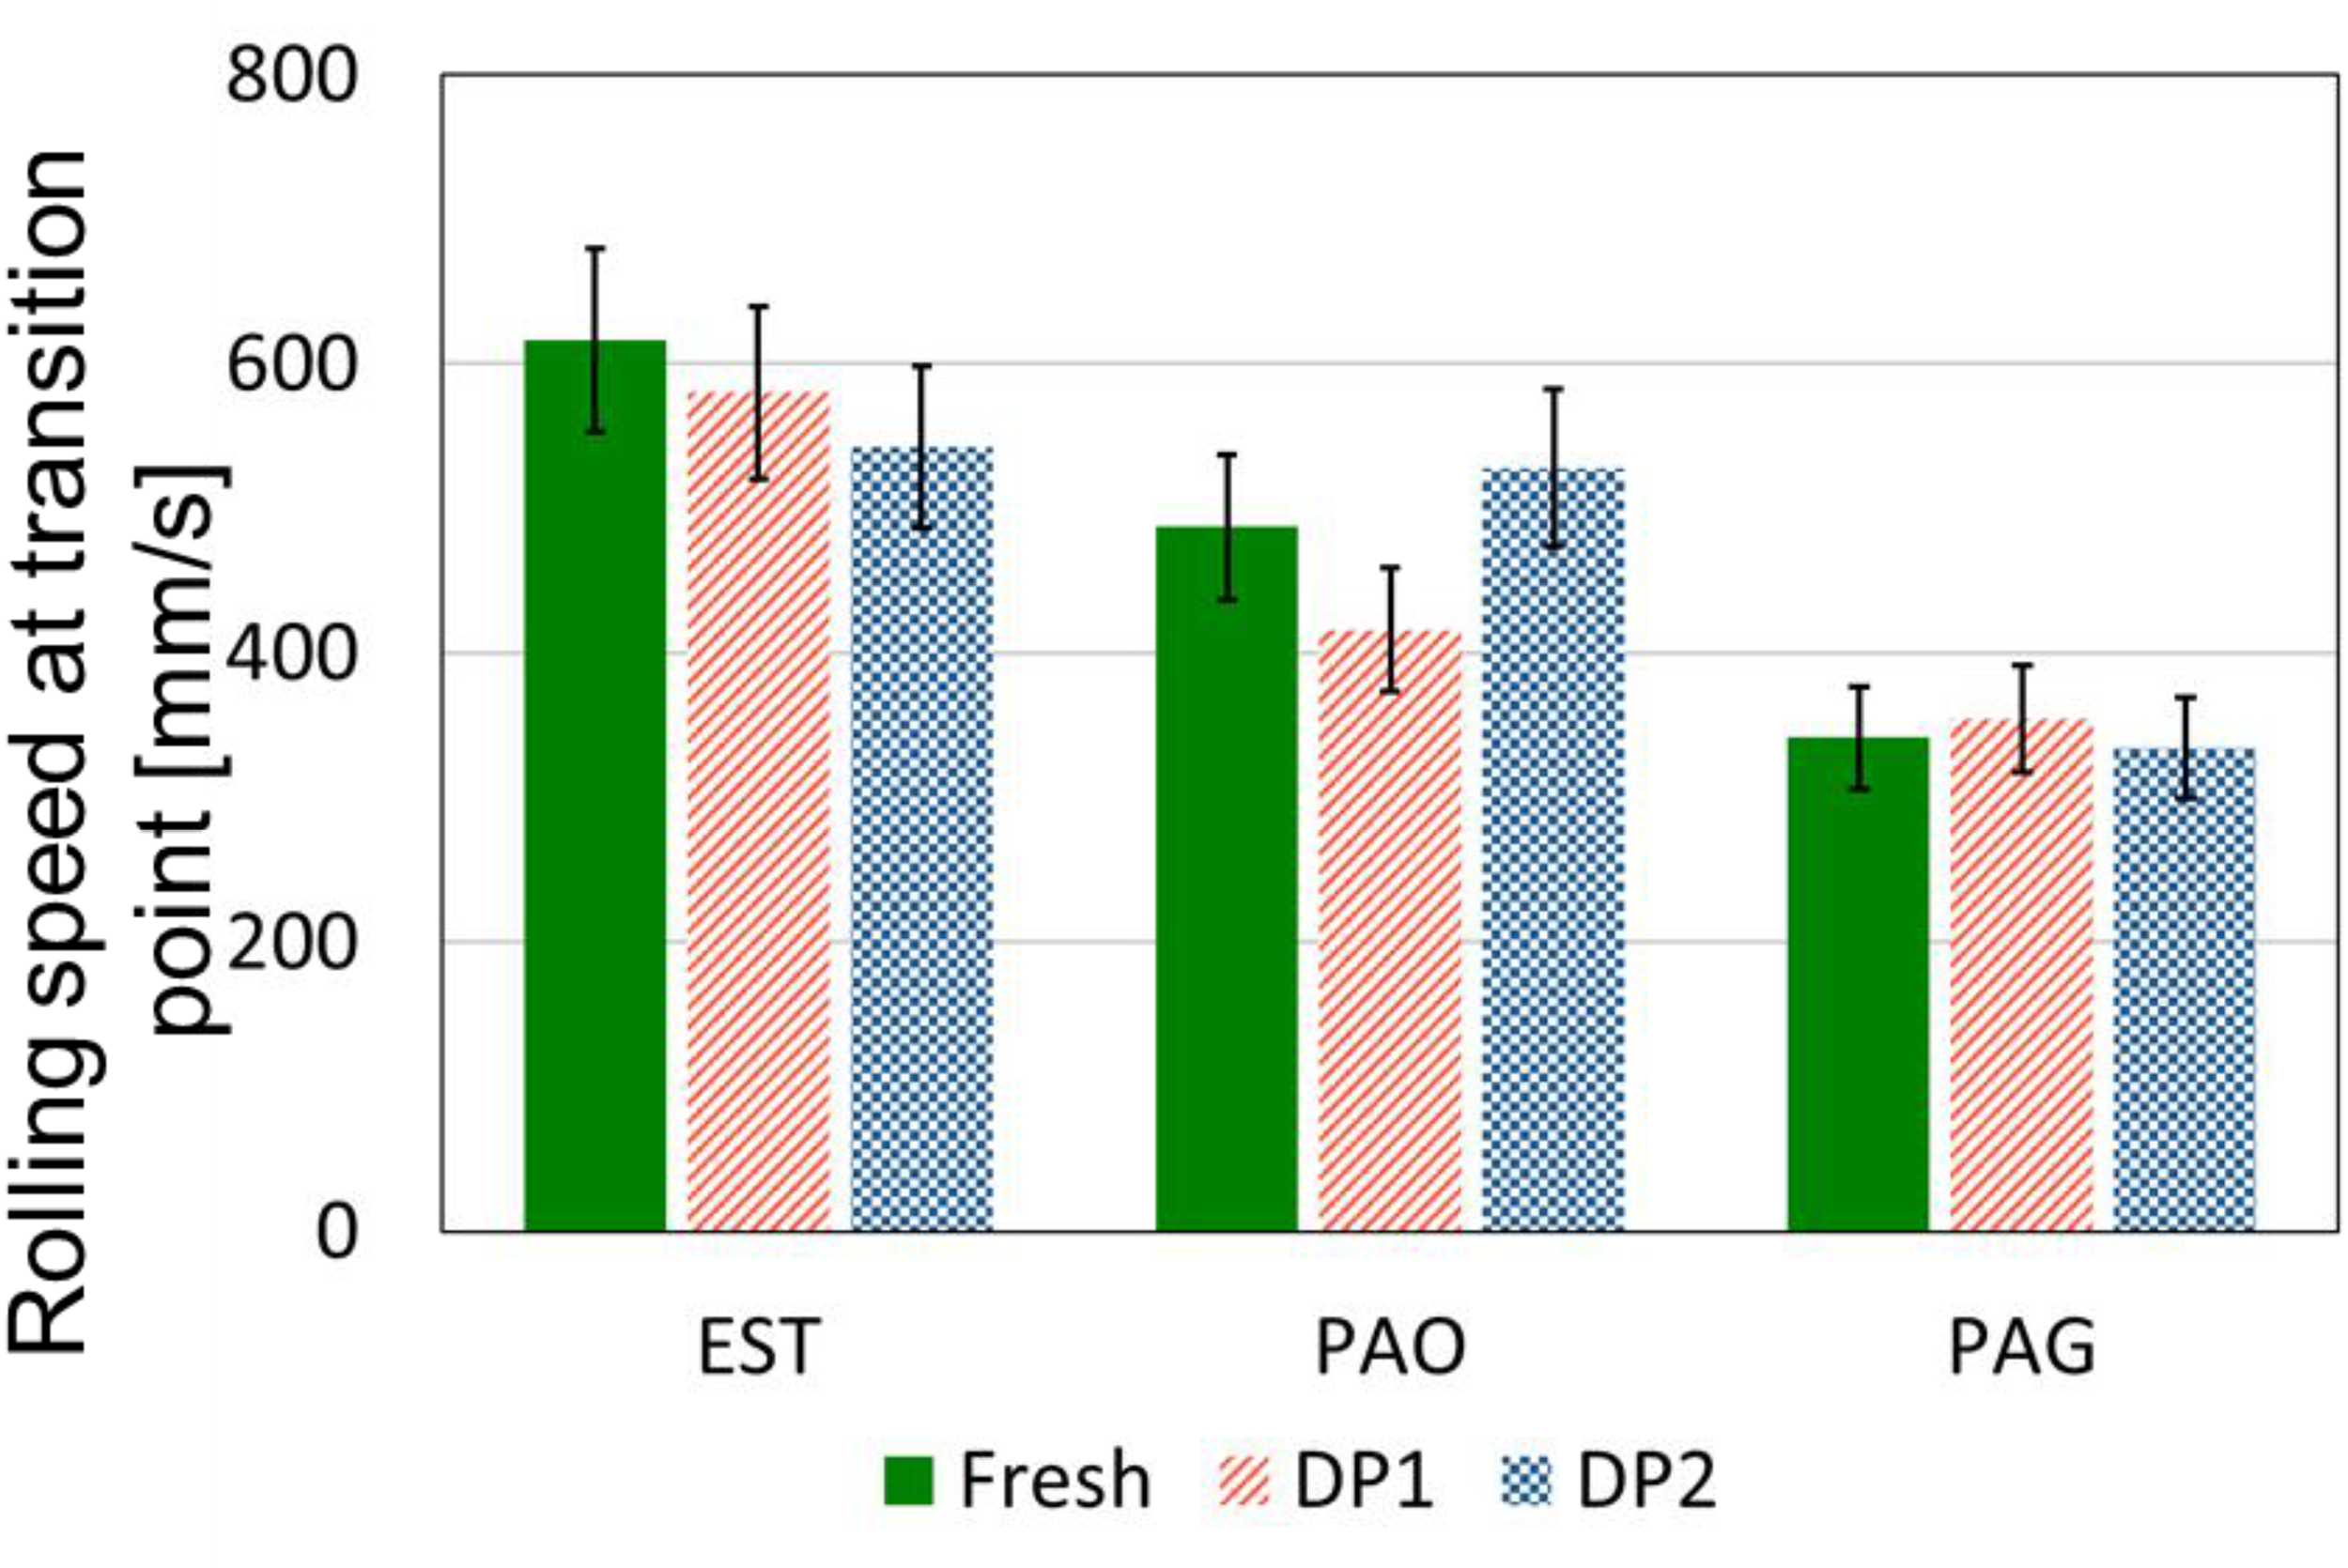
Comparison of rolling speeds at transition point from fresh and degraded EST, PAO and PAG samples to determine oil film formation.
TBL formation
The results of the TBL formation are presented in Figure 10. The diagrams show the mean thickness of TBL for fresh and degraded samples of EST, PAO and PAG at different time steps. In the first 5 min the mean thickness of all oil samples (fresh and DPs) is at 5 nm. In the following no significant growth of TBL is observed for both fresh and degraded oil samples of EST. The final mean thickness of TBL for oil samples of EST is at 10 nm. Therefore, no significant influence of both DPs on TBL formation could be observed. However, for PAO and PAG the formation of TBL was affected. TBLs of the fresh samples of PAO and PAG continue growing until a test duration of 80 min (PAO) or 120 min (PAG). The final mean thickness of TBL is 40 nm for PAO and 25 nm for PAG.
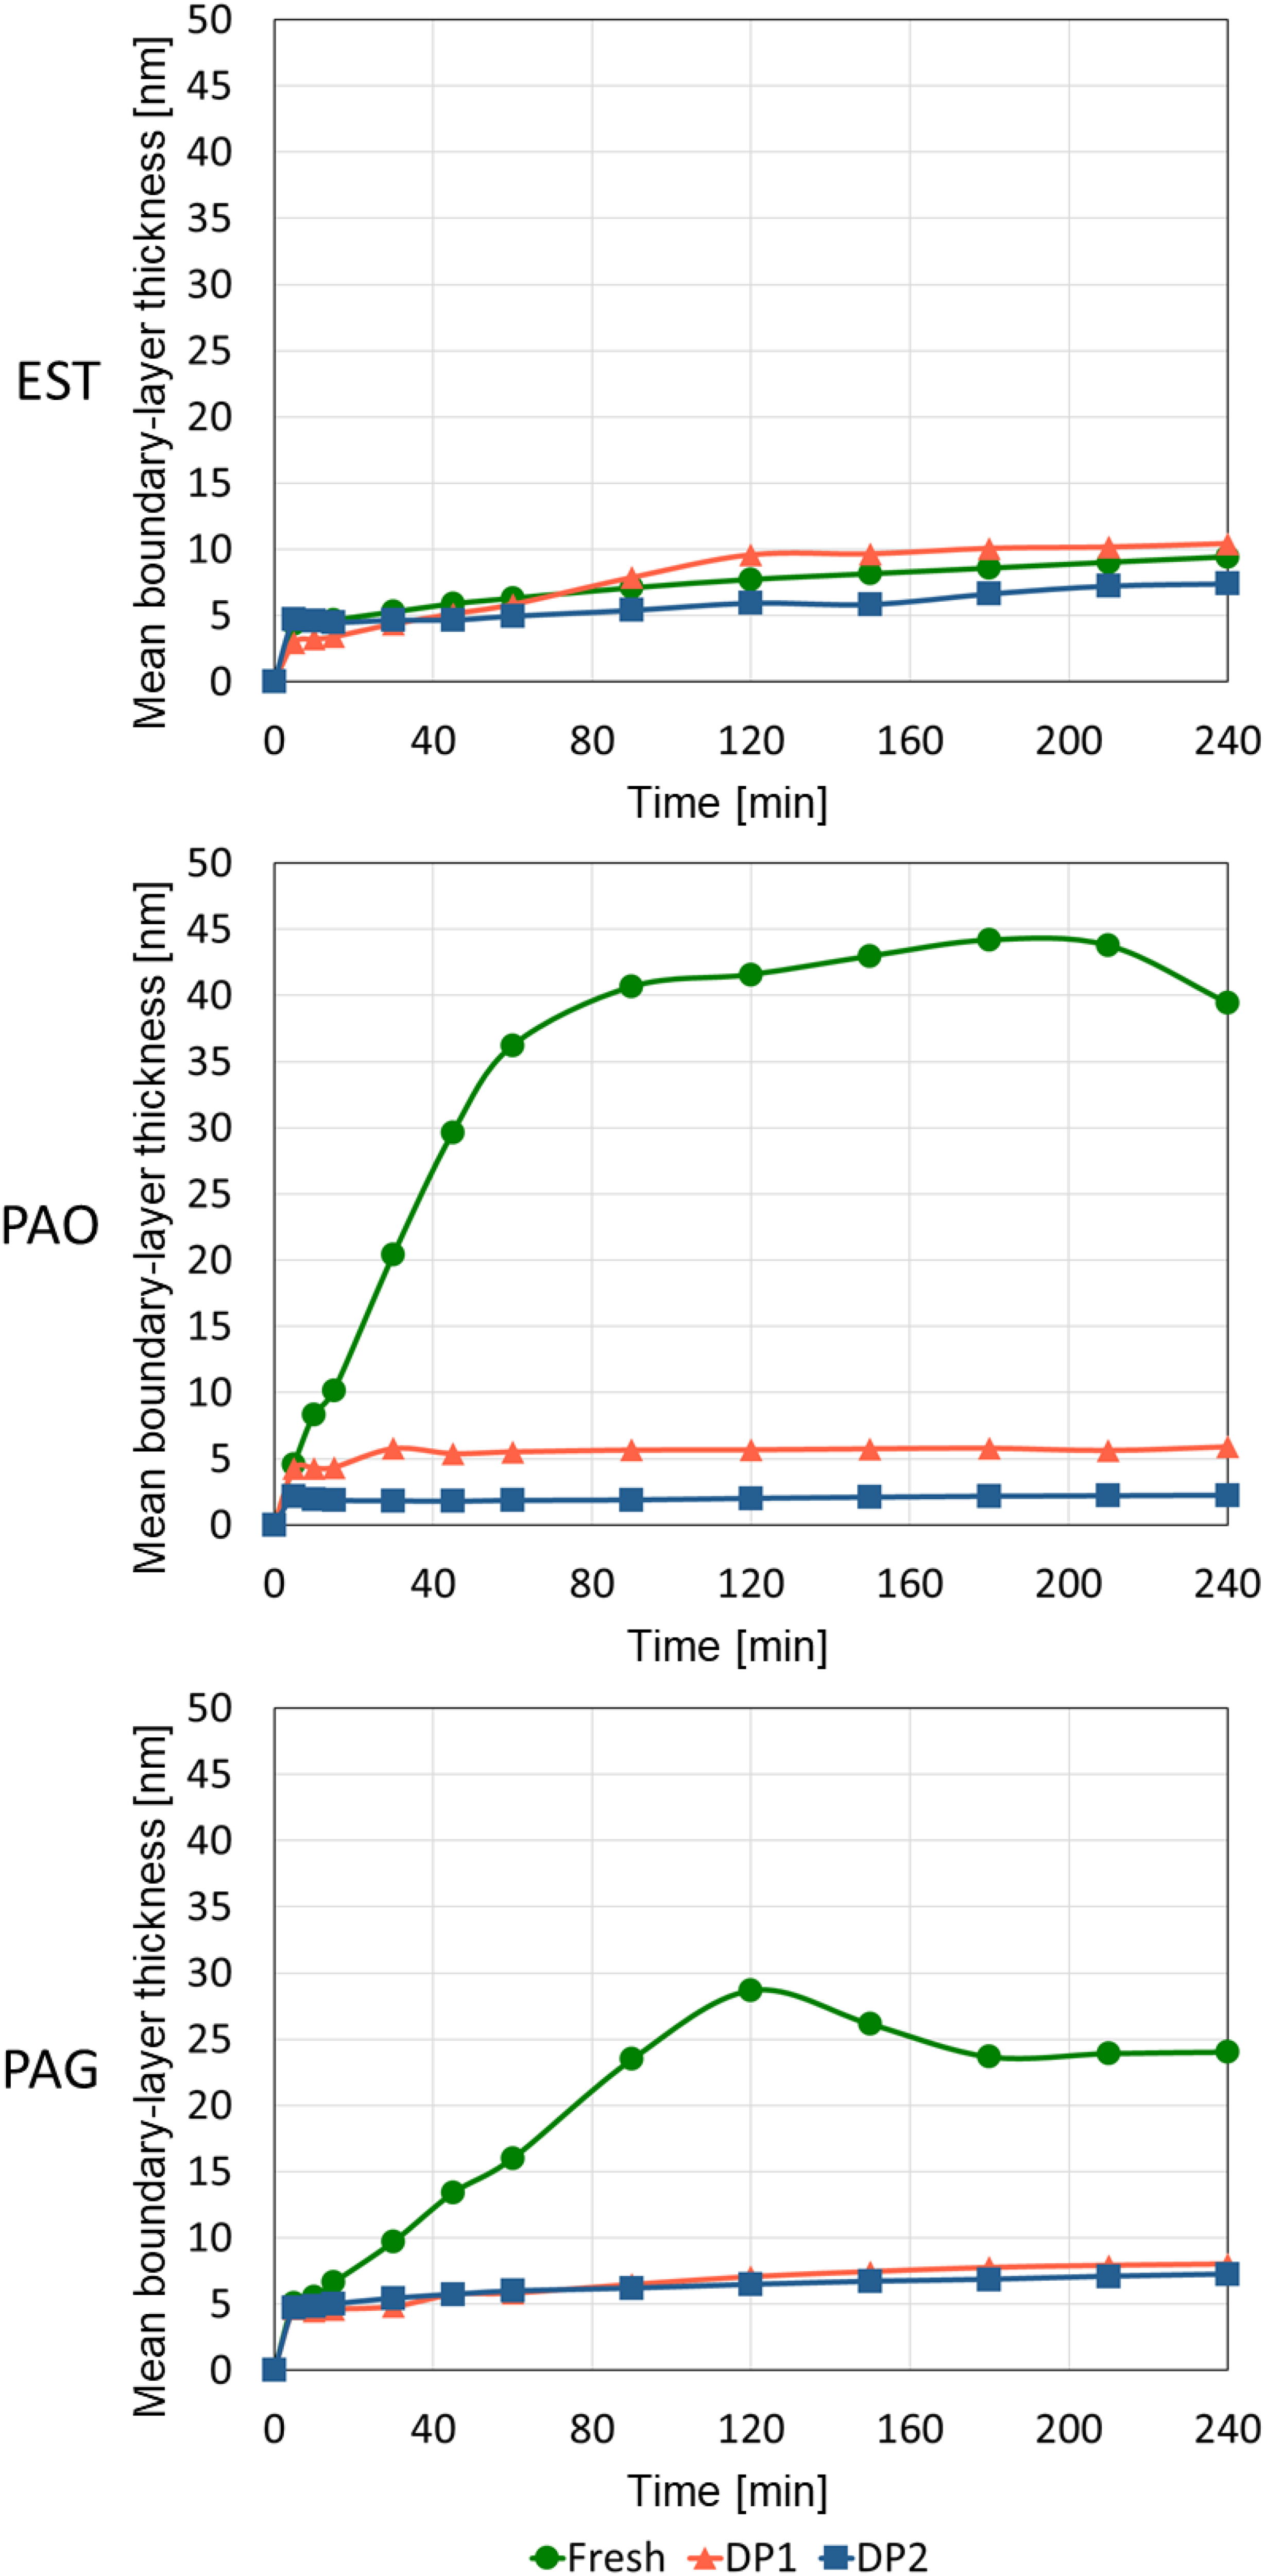
Comparison of mean boundary-layer thickness from fresh and degraded EST, PAO and PAG samples to determine boundary layer formation.
The degraded samples of PAO and PAG show similar to EST no further TBL formation after the first 5 min. The final mean thickness of TBL is between 2 nm (PAO degraded by DP2) and 10 nm (PAG degraded by DP1) for the degraded oil samples of PAO and PAG. Therefore, due to a decrease of TBL thickness of 90% for PAO and 67% for PAG a significant influence of degradation on TBL formation could be observed.
Following the SLIM tests, the surfaces of the balls were examined using an optical microscope. Microscope images of the ball surfaces are shown in Figure 11. For all lubricants, the running surface within the contact zone exhibited a brownish boundary layer, while scratches indicative of wear were barely visible. Brown discoloration of boundary layers has been associated in the literature with the formation of phosphate layers. 32 However, the intensity of the brown discoloration varies among the microscope images for fresh and degraded PAO and PAG.
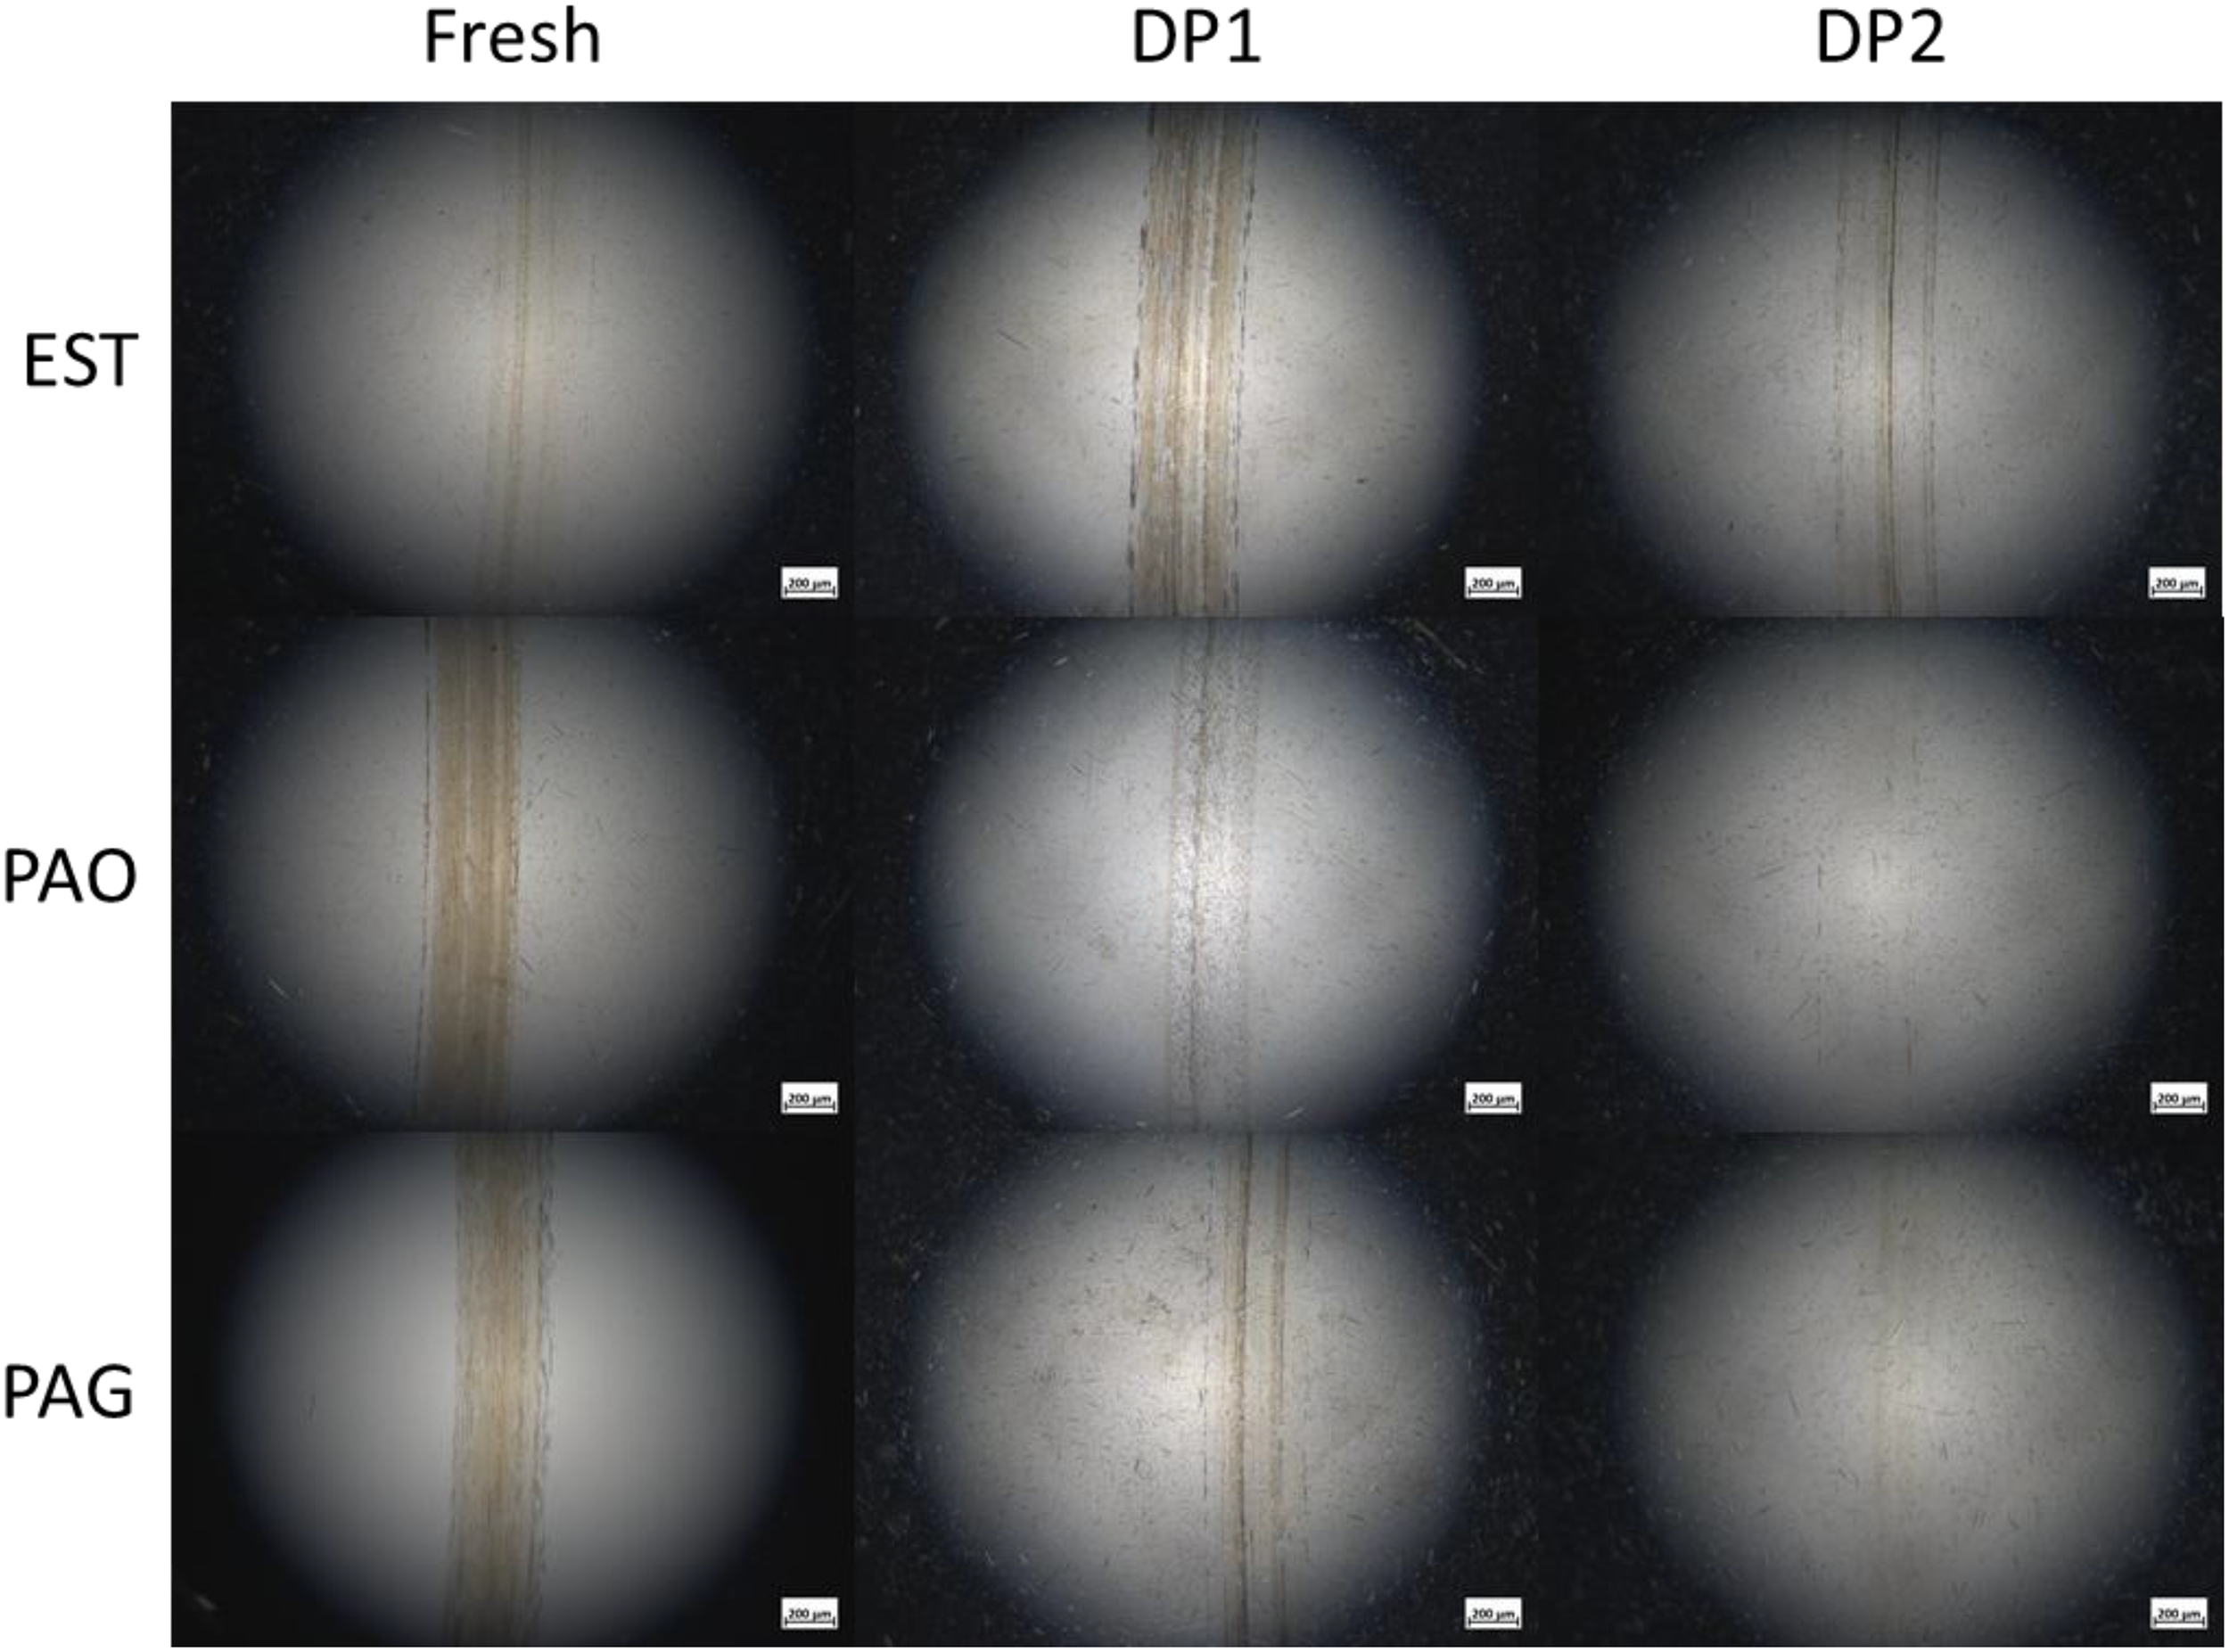
Optical microscope images of the ball surfaces after SLIM tests.
While the fresh PAO and PAG samples exhibit strong brown discoloration, the degraded PAO and PAG samples show a significantly lower discoloration intensity. In addition, the brown discoloration intensity of DP1 is greater than that of DP2. These optical microscope observations for PAO and PAG therefore indicate reduced TBL formation in the degraded oil samples. In contrast, for the EST samples, differences in brown discoloration intensity between fresh and degraded oils are negligible. Accordingly, the optical microscope images of EST do not indicate a significant influence of degradation on TBL formation. Overall, the optical microscope observations are consistent with the SLIM test results. This may suggest a qualitative correlation between the intensity of brown discoloration on the ball surface and the boundary layer thickness determined in the SLIM tests, whereby stronger discoloration tends to coincide with greater boundary layer thickness.
Discussion
The results of the rheological and chemical analysis showcase a degradation related change of EST, PAO and PAG. This can be determined primarily by the color change of the lubricants due to DP1 and DP2. A change in color indicate a chemical change (e.g., oxidation) of the lubricants as a result of degradation. 14 An oxidation of the lubricant will typically lead to an increase in neutralization number because of the formation of acidic by-products.14,33 However, the results of this study tended to show a decrease in the neutralization number as a result of degradation. The reason for this increase could lie in the EP/AW-additives. In this study ashless EP/AW-additives (e.g., phosphoric acid esters) have been used. These phosphoric acid esters tend to degrade during degradation, which was pointed out in other studies.15,16 Due to the degradation, molecules of the phosphoric acid esters undergo a reaction, which can lead to the formation of less acidic components.15,16 As a result of the increasing amount of less acidic components, the neutralization number of the lubricant decreases.15,16 Despite the possible change in EP/AW-additives, the additive content remained unchanged because the phosphorus content remained roughly the same. This was expected since during DP1 and DP2 no TBL formation took place. Therefore, no consumption of phosphor is expected during degradation. The measurements of kinematic viscosity also showed no significant change for EST, PAO, and PAG.
The results of the transition points show no influence of degradation on oil film formation for all lubricants. This agrees with the values of the kinematic viscosity at 60 °C and ambient pressure. These measurements also did not reveal a significant decrease in viscosity that could be responsible for a reduction in oil film formation. As the viscosity remained unchanged at 60 °C, it can be assumed that the pressure-viscosity coefficient remains unchanged as well. The reason for this is, that lubricants influence the oil film formation by their operating viscosity and pressure-viscosity coefficient (α) according to Hamrock and Dawson. 34 In summary, oil film formation is not affected by the investigated DP and therefore does not indicate sensitivity to degradation for the lubricants examined.
In terms of TBL formation, no influence of degradation on EST could be identified. These results are in contrast to the measurements of neutralization number. In those measurements a decrease of neutralization number especially due to DP1 is shown, which may indicate a change of EP/AW-additives due to degradation. However, previous studies have shown that ester-based lubricants can form TBLs based on an oxide layer. 35 These TBLs had a thickness of approximately 10 nm, consistent with the findings of this study, and demonstrated good wear protection in standardized bearing tests according to DIN 51819.35,36 For PAO and PAG a significant reduction in TBL thickness at the end of the tests could be observed. Despite this, the results of the neutralization number and phosphorus content did not show a significant decline. However, recent studies figured out that the formation of phosphate-based TBL can be hindered due to water in the lubricant.37–39 Water can be dissolved in the lubricant during the degradation with humid air (DP1) and water (DP2). Due to small amounts of dissolved water it is possible that lubricant properties like neutralization number and viscosity remain unchanged. 37 The water dissolved in the lubricants causes on the one side that long phosphate chains break apart into short phosphate chains, which accumulate on the surface.37,39 On the other hand, water binds to the short-chain phosphates on the surface via hydrogen bonds, which leads to passivation of the layer and prevents further growth. 38 Due to those effects the thickness of the TBL remains thinner compared to the fresh lubricant.37,39 In summary, TBL formation of PAO and PAG was affected by degradation, leading to a reduced TBL thickness and indicating sensitivity to degradation. In contrast, TBL formation in EST was not affected and therefore does not indicate sensitivity to degradation.
Conclusions
Due to legal requirements, EAL are becoming increasingly important. However, after switching from conventional polyalphaolefine-based lubricants to EALs an increase in failure of EAL lubricated machinery has been reported.6–8 One possible reason for this increase is severe degradation of EALs during operation, which resulted in a change of tribological performance (e.g., oil film formation and tribological boundary layer (TBL) formation). The aim of this study was therefore to determine the sensitivity of ester- and polyglycol-based EALs, as well as a conventional lubricant (polyalphaolefin), to degradation, by analyzing changes in oil film and TBL formation. Based on the results, the following conclusions can be drawn:
Both degradation paths (DPs), oxidative and hydrolytic, led to a similar degradation behavior in the respective lubricants. This indicates an impact on the degradation-related change in tribological performance for even small amounts of water (e.g., dissolved water). The ester-based lubricant used in this study showed no sensitivity to degradation among the DPs examined. Neither oil film formation nor TBL formation were influenced by either DP. The tendency of degraded ester-based lubricants to form oxide-based TBLs must be verified by appropriate chemical measurements (e.g., electron probe microanalysis). The lubricants based on polyglycol and polyalphaolefin showed sensitivity to degradation for both DPs due to a reduction in TBL formation. This behavior could be caused by the decomposition of EP/AW additives or the presence of dissolved water. For this reason, when qualifying lubricants based on polyglycols and polyalphaolefins, the effects of degradation on TBL formation should be considered.
Further investigations will be conducted to determine the sensitivity of the tested lubricants to other DP, such as thermo-mechanical degradation in roller bearings. In addition, further rheological and chemical analysis are to be carried out. The focus of these analysis is on the determination of changes of pressure-viscosity coefficient (α) and chemical structure of the additives. Furthermore, investigations of the composition of the tribological boundary layers formed during the tests will be carried out.
Footnotes
Ethical considerations
Not applicable.
Consent to participate
Not applicable.
Consent for publication
Not applicable.
Author contributions
Funding
The authors would like to thank the research circle of the food industry FEI (Forschungskreis der Ernährungsindustrie e.V.) as well as the participating member companies for the support of the IGF project 22686BG, which is funded by the German Aerospace Center DLR (Deutsches Zentrum für Luft- und Raumfahrt) within the framework of the program for the promotion of the Industrial Collective Research IGF (Industrielle Gemeinschaftsforschung) by the Federal Ministry of Economic Affairs and Energy BMWE (Bundesministerium für Wirtschaft und Energie) based on a resolution of the German Bundestag.
Declaration of conflicting interests
The authors declared no potential conflicts of interest with respect to the research, authorship, and/or publication of this article.
Data availability statement
Data will be made available on request.