
Abstract
Aerospace actuation gearboxes operate in low-temperature environments where increased lubricant viscosity leads to significant no-load power losses. Replacing fluid lubricants with coatings applied to the gear teeth is one potential approach to improving gearbox efficiency. Here we develop an approach to determining average wear rates of coated gears using a power-recirculating test stand, profile measurements and a model of the tooth contact. Worn gears are inspected using scanning electron imagery, and energy dispersive X-ray and Raman spectroscopy to understand the wear mechanisms and failure modes. Average coefficients of friction are determined at 20°C and −40°C using a power-absorbing test stand and isolation of tooth friction losses by calculation. These methods are then demonstrated on a promising C/Cr composite coating.
Introduction
The majority of gearboxes are designed to prevent wearing of the gear teeth through the use of fluid lubricants. Fluid lubricants prevent direct contact between the asperities of meshing gear teeth by maintaining a separating film between the two surfaces and help to reduce surface stresses and friction. They also contain chemical additives which, when asperity contact does occur, form easily sheared films to separate the metals and prevent wear.
The aerospace industry utilises fluid-lubricated gearboxes to actuate various control surfaces and utility systems on both civil and military aircraft. However, in the low-temperature flight environment, the high viscosity of the fluid causes significant power loss, and pressure and temperature variations make the sealing of dynamic interfaces challenging. This leads to both an increase in system weight and a reduction in reliability. A dry lubricated approach to geared actuation has the potential to reduce no-load losses and system weight, and to eliminate problems with leakage.
Modern physical vapour deposition (PVD) processes allow metal substrates to be coated with tailored nanocomposite films that combine the beneficial properties of multiple elements. This has produced a generation of wear-resistant coatings with the hardness and low friction characteristics of thin hard films, and the self-lubricating properties of softer lamellar materials.
PVD films, particularly those incorporating carbon, have been previously tested on gears to understand their impact on scuffing,1–8 pitting2–4,8–11 and friction5,12 in conventionally lubricated gearboxes. These have often focussed on the potential for coatings to be used to replace environmentally damaging lubricant additives in conjunction with biodegradable oils. Although the performance of dry PVD coatings on gears has been simulated on disc machines in mixed rolling and sliding,13,14 very little data is available for the performance and durability of these coatings when actually applied to gear teeth. The most notable effort came from Petrik et al., 15 who studied the dry performance of gear teeth coated with a:C-H:Me and a:C-H films on various substrates, including those pre-treated by nitriding. These tests were performed using a typical ‘load stage’ approach, with the gears subjected to a fixed number of revolutions at increasing torque levels until seizure of the surfaces was evident. Little focus has been placed on understanding the evolution and distribution of wear on the tooth surfaces, the wear processes or the extent of the performance benefit gained from the reduction of no-load losses.
This study develops methods for quantifying the wear and friction performance of solid lubricant coatings when applied to gear teeth as a dry lubricant in aerospace actuation gearboxes. These methods are then applied to a promising carbon–chromium composite coating.
Material and methods
Test samples
All tests were performed on coated gears assembled into a gearbox from a civil high-lift actuation application. The gearbox consists of three spur gears: a pair of identical 24-tooth input and output gears, and a central 33-tooth idler gear. Each gear is straddle mounted on a pair of deep groove ball bearings and housed within a set of cast and machined aluminium alloy housings (see Figure 1).
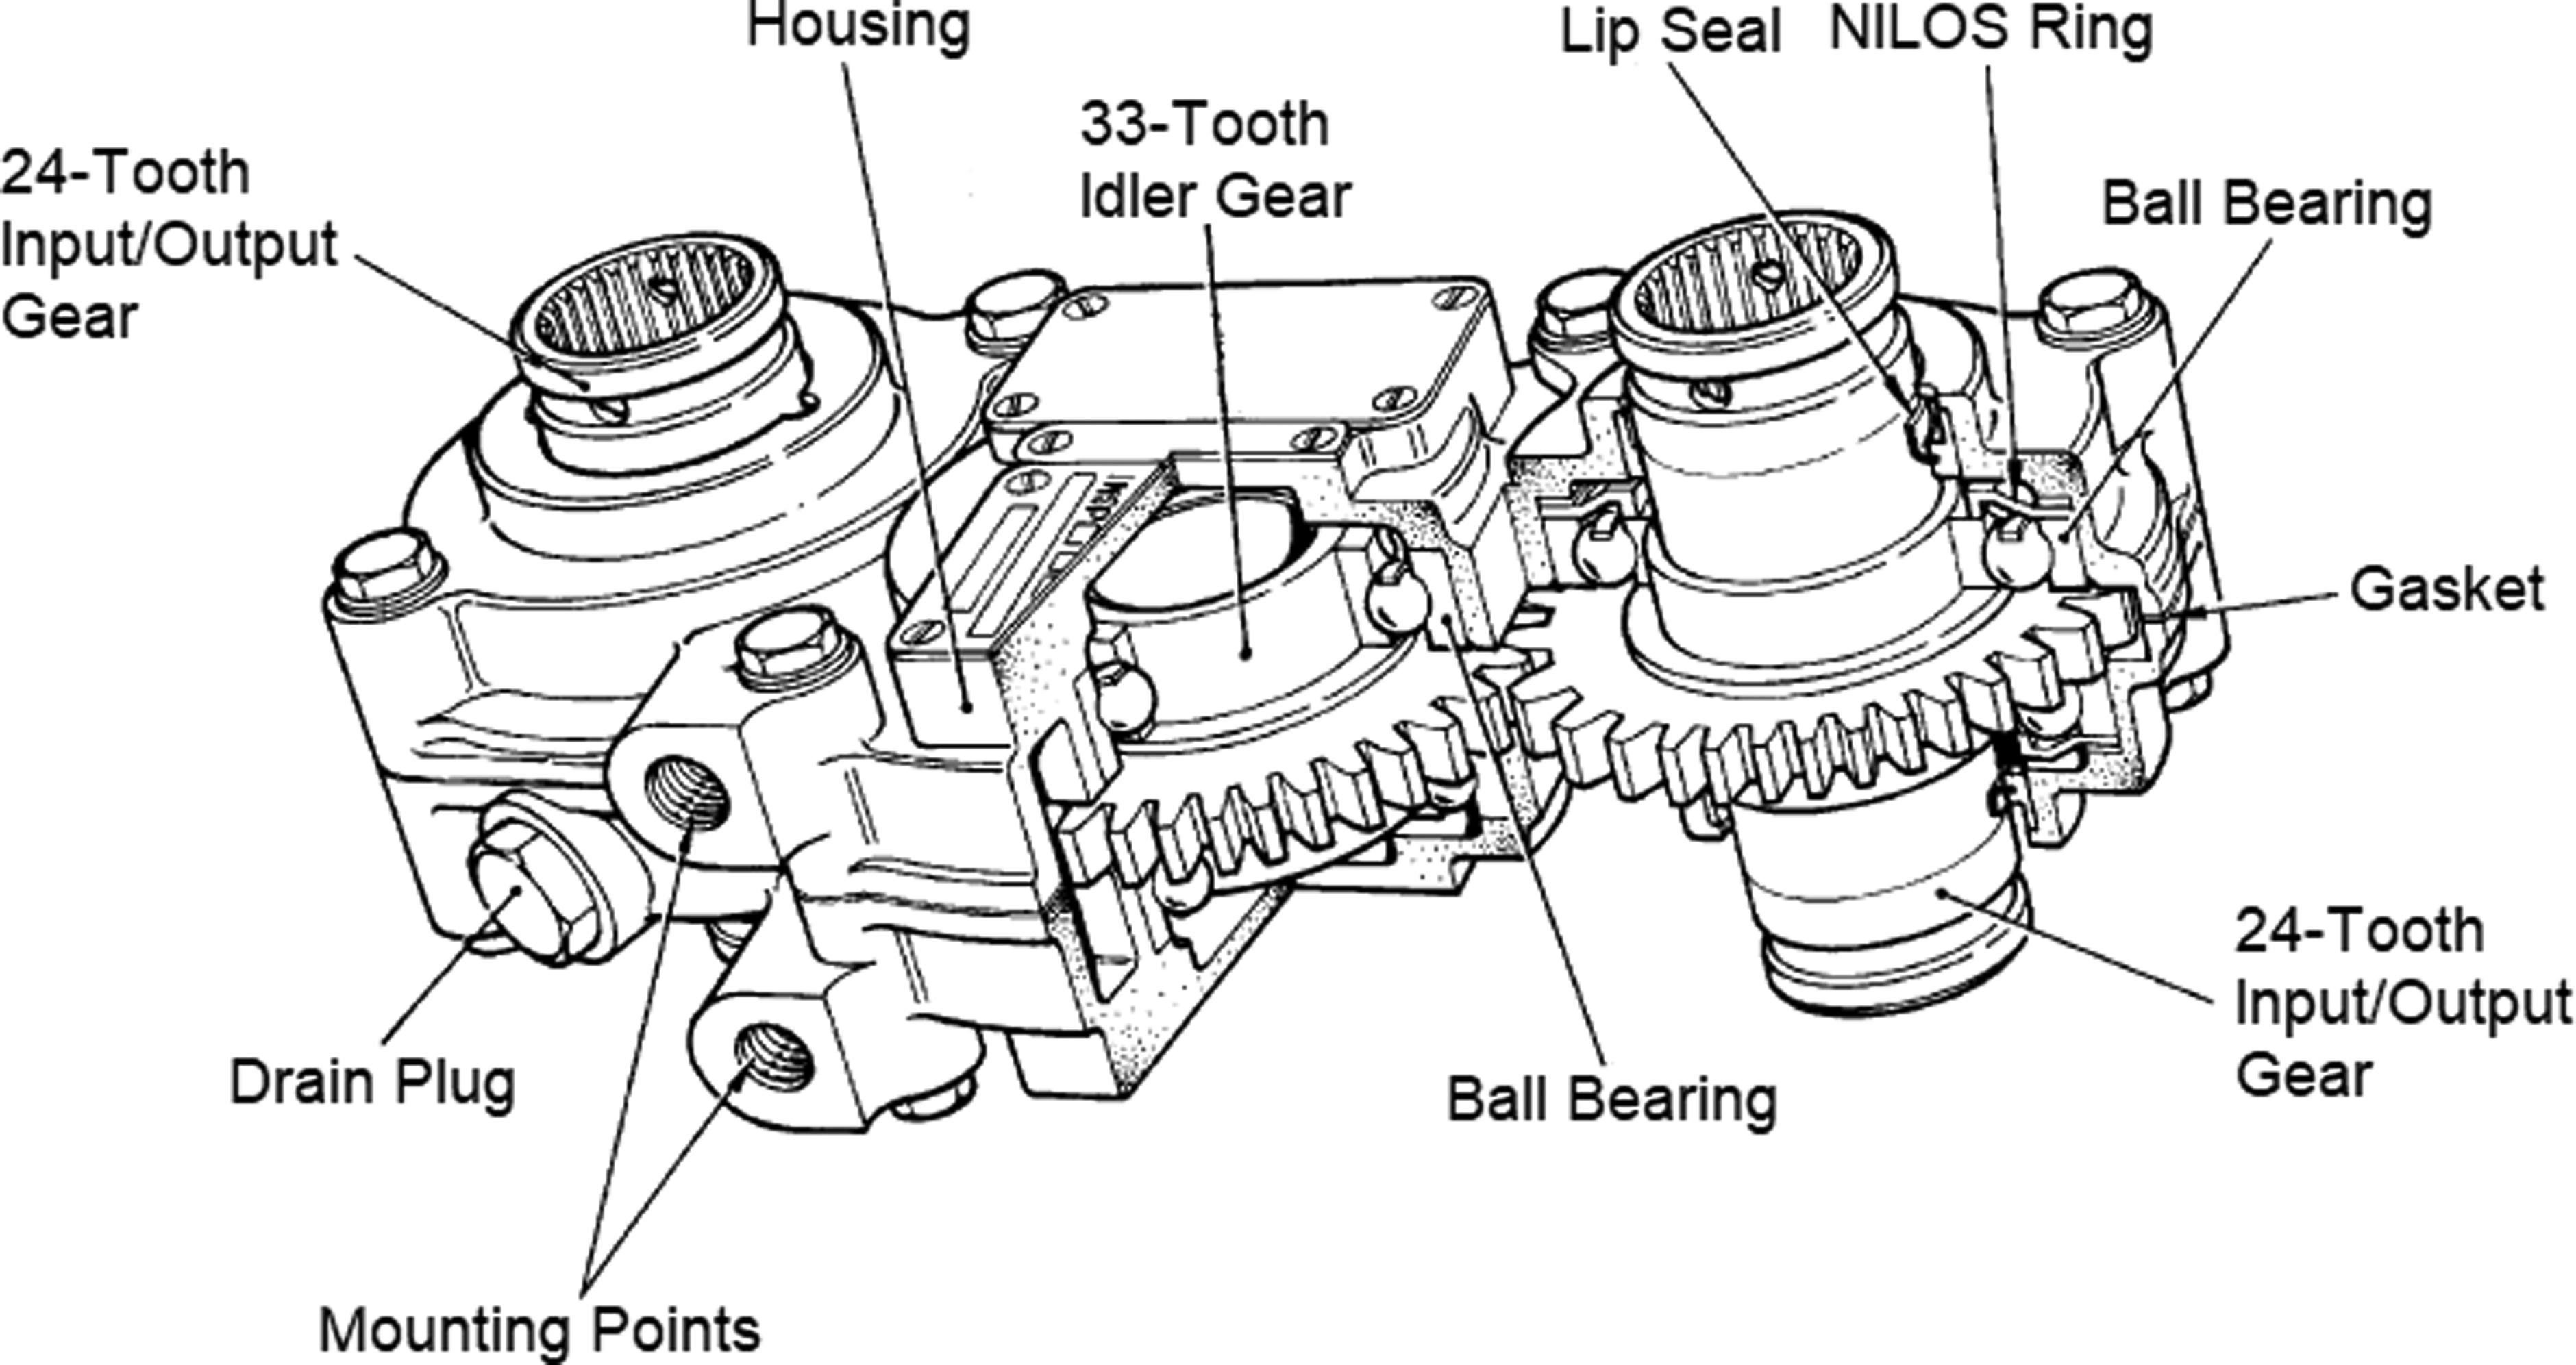
Sectional view of test gearbox.
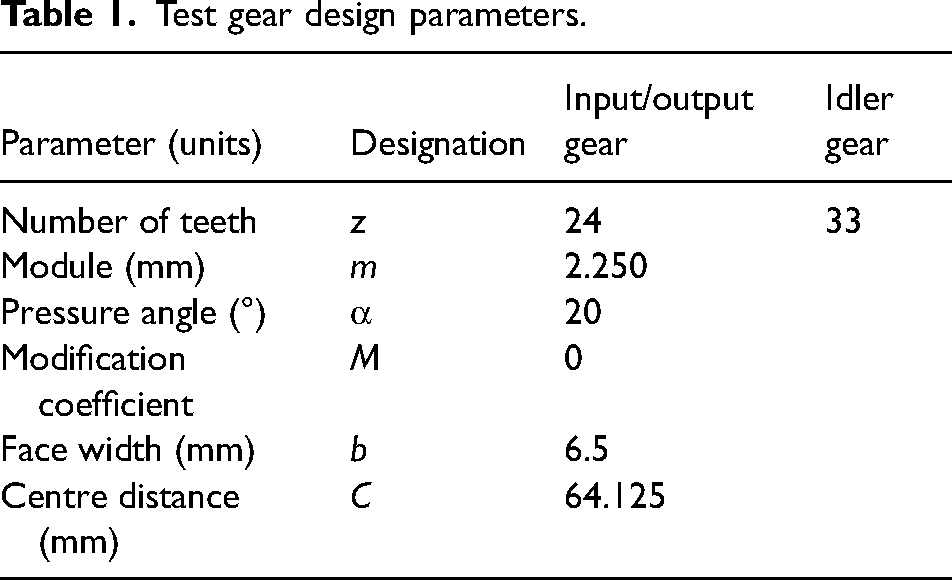
The test gears were manufactured in BS S82 and gas carburised to a minimum surface hardness of 650Hv2.5 and a case depth of 0.5 mm to 510Hv2.5. This is the standard treatment for these gears in their service application. The case hardening treatment was maintained for these experiments in order to ensure a hardened surface for deposition of the coating. This has been shown to improve coating life and load capacity.15,16 The tooth surface roughness was improved by wet superfinishing in a disc finishing machine to 0.1 µm Ra, with the finished tolerances conforming to AGMA 2000-A88 class 12. The gear design parameters are summarised in Table 1.
Test gear design parameters.
The tested coating, Graphit-iC, was applied to the gears by Teer Coatings using closed-field unbalanced magnetron sputtering (CFUBMS). It consists of a thin Cr interlayer to provide adhesion, followed by a transition layer in which the concentration of Cr is gradually reduced while the concentration of C is gradually increased. The final 2.8 µm of the coating consists of Cr-doped (∼5 at.%) amorphous carbon (a-C). Further details of the deposition process of the coating, and its performance in standard pin-on-disc tests have been documented by Yang et al.17,18
Wear testing
Wear test setup and conditions
Wear testing was performed on a test rig designed on the principle of power recirculation (see Figure 2). Power-recirculating test rigs, sometimes referred to as ‘back-to-back’ or ‘four-square’ test rigs, are utilised widely in industry for testing the scuffing, pitting and wear resistance of gears and lubricating oils.
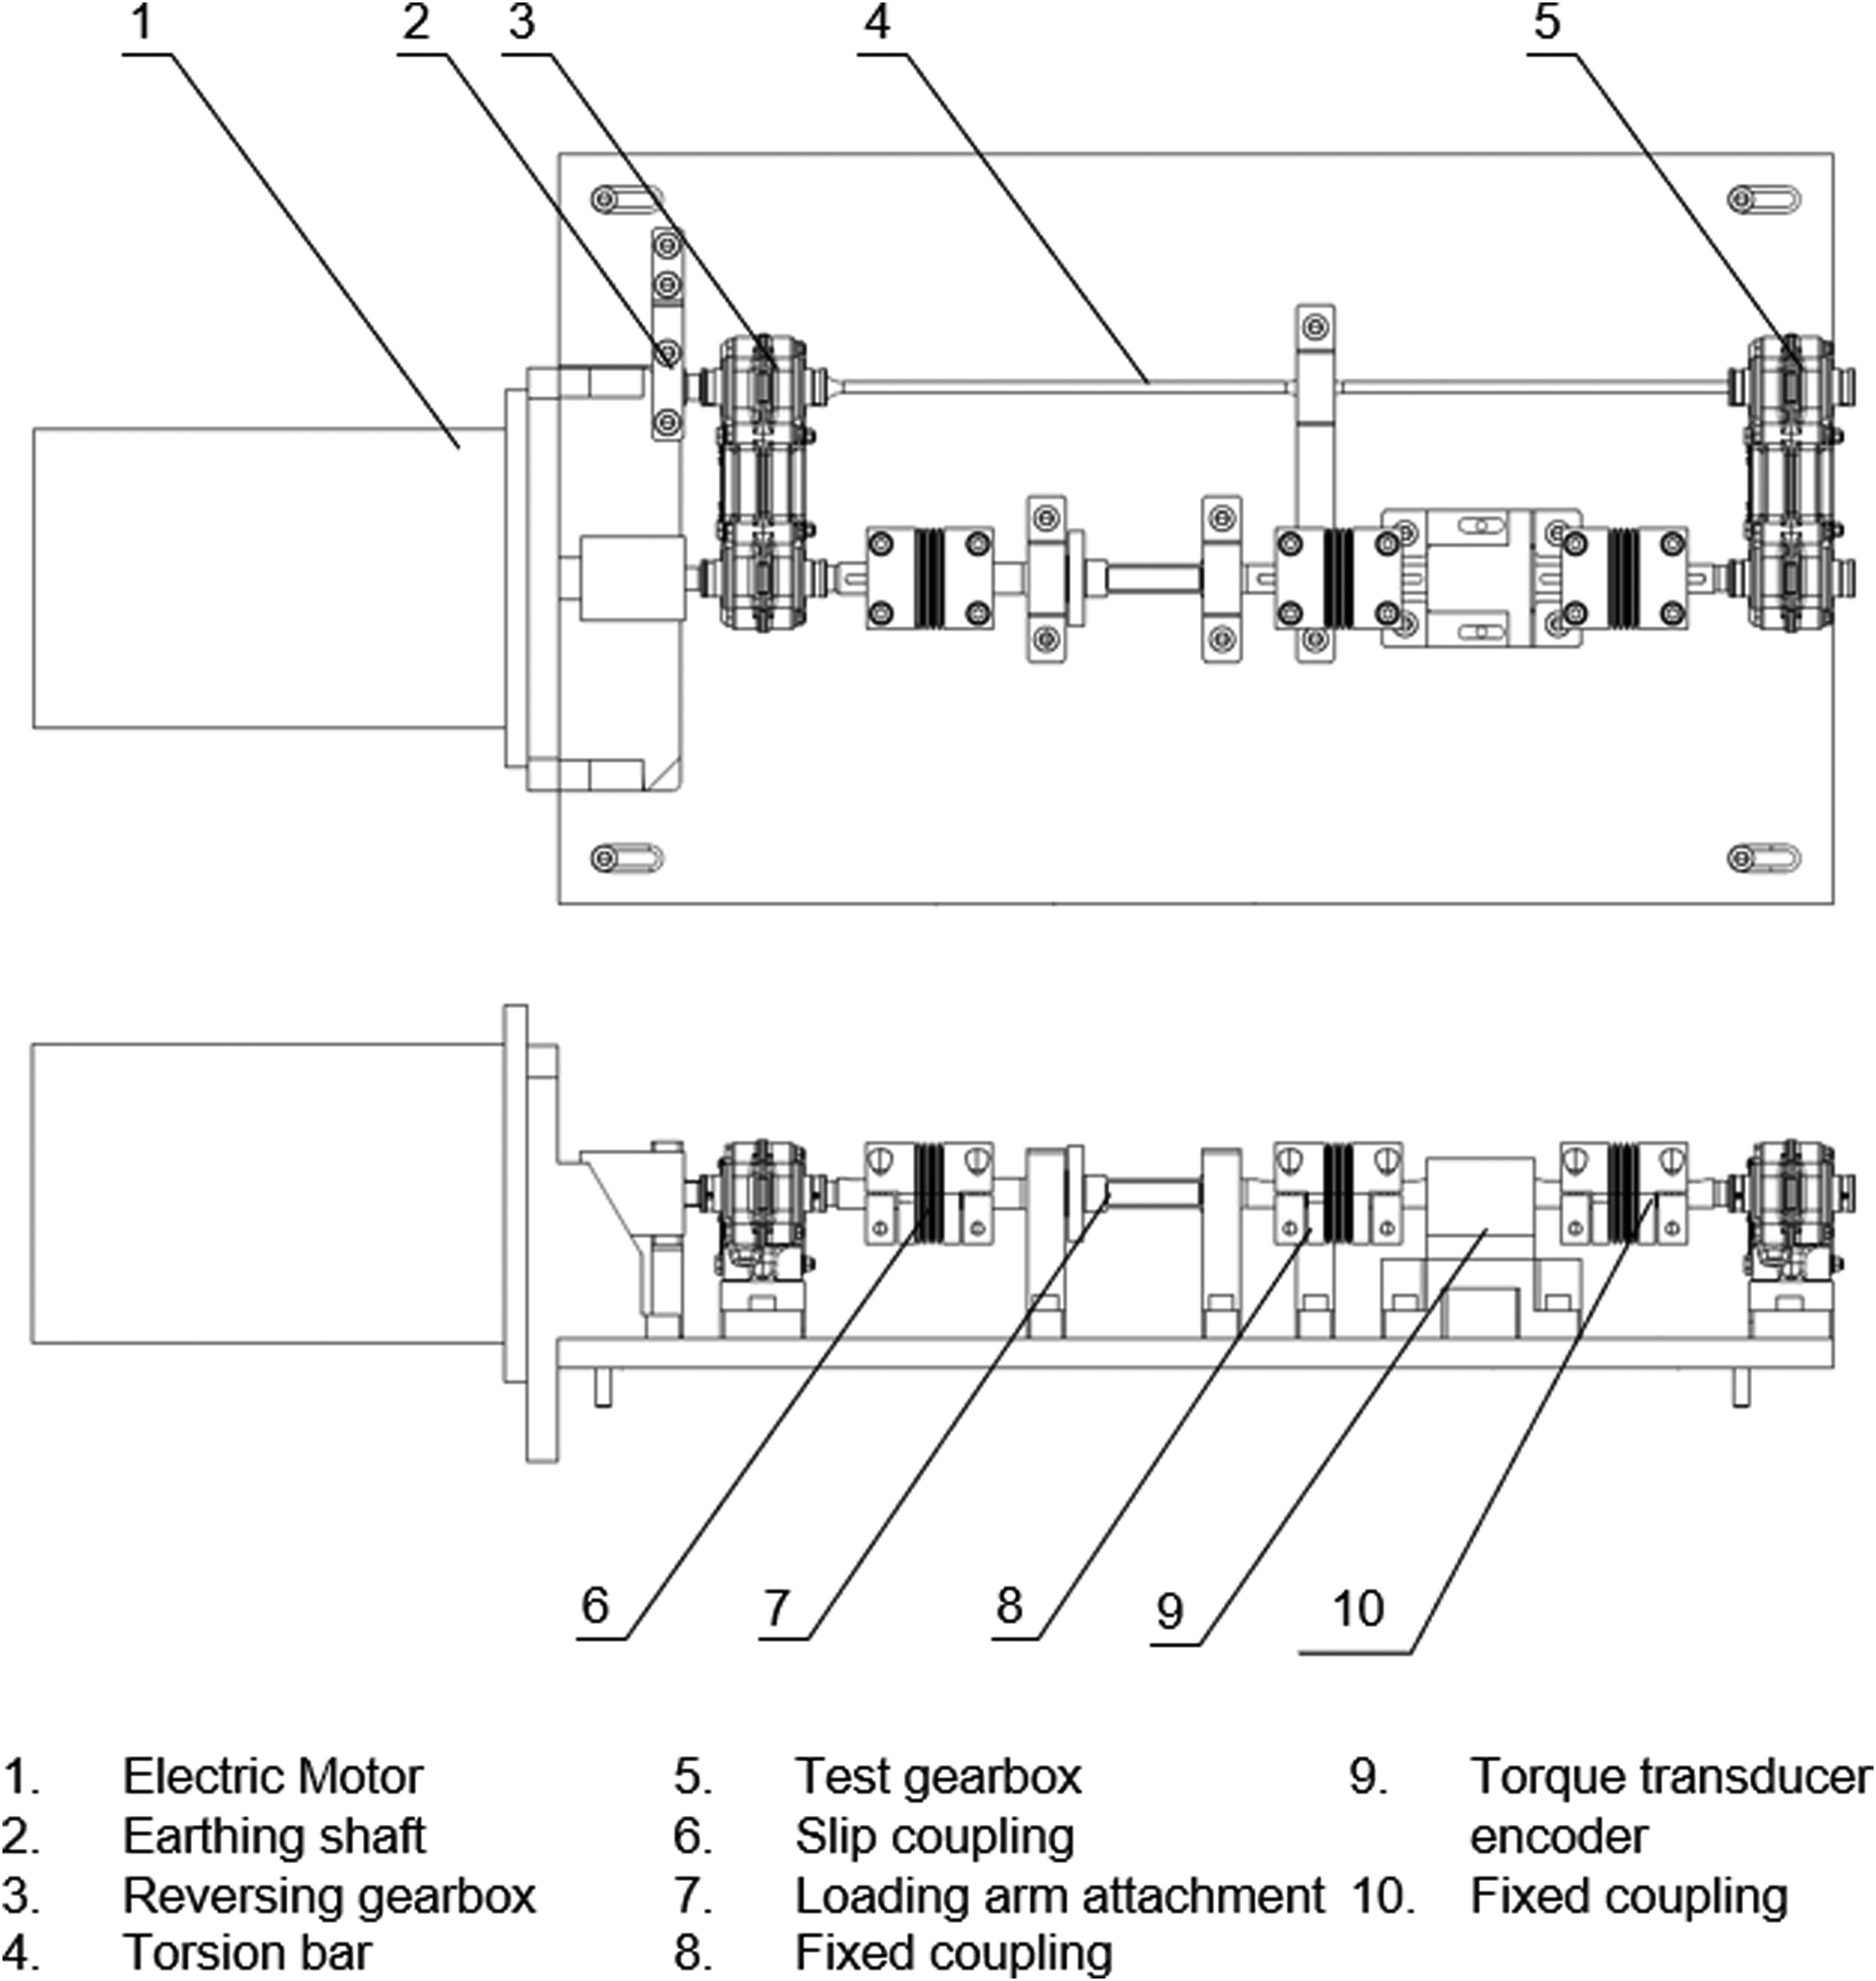
Wear test rig.
Power-recirculating rigs function by mounting two gearboxes in-line, with the inputs and outputs connected by common shafts. A torque load is then trapped between the gearboxes using a slip coupling and torsion bar. One of the common shafts is driven by a motor, which results in one gearbox (the ‘test’ gearbox) operating against an opposing torque, whilst the other (the ‘reversing’ gearbox) operates with an aiding torque. The advantage of this approach is that the motor only drives the losses in the system. Consequently, a relatively small motor can be used to drive a highly loaded gearbox, and no separate load motor or control system is required.
For the test rig used in this study, both the test and reversing gearboxes used the same design shown in Figure 1. The coated gears were installed to the test gearbox without any fluid lubrication. The supporting bearings were sealed to prevent egress of grease. For the reversing gearbox, uncoated gears were installed and the gearbox was lubricated with ISO VG 150 EP gear oil to inhibit wear.
The applied torque and shaft speeds were monitored during testing using a combined torque transducer and encoder. Torque loads were applied to the torsion bar by first earthing the reversing gearbox with a splined shaft and disconnecting the slip coupling, then suspending masses from an attachable moment arm. Once the applied torque load was verified by the torque transducer, the slip coupling was retightened to trap the torque in a loop, before removing the earthing shaft.
The applied test duty was based on the normal operating conditions for the gearbox in its real-world application. Test cycles consisted of bursts of 100 revolutions at a speed of 400 rpm, with a 165 s period between cycles to allow for dissipation of heat. All cycles were applied in the same direction of rotation. In a typical flight control actuation system, gearboxes of the type used in this experiment would operate against constantly varying torque loads. However, in order to better understand the impact of changes in torque load, individual gearsets were tested against constant opposing torques of 10, 20 and 30 Nm. This provided a range of torque conditions within the typical operating parameters of the gearbox. A single test run was performed at each torque load. An approximate equivalent life requirement for a gearbox of this type would be 120,000 test cycles at a mean torque of 20 Nm.
Measurement and inspection of wear
Prior to commencing testing, three equally spaced teeth on each gear were marked with identifying numbers, then measured on a Klingelnberg P26 gear measuring centre. Seven equally spaced profile measurements were taken, with a single lead measurement to allow mapping of the tooth topography. The lead measurement was taken at the start of the profile trace, which was positioned below the start of active profile (SAP) to form a datum.
Testing was paused at set intervals to allow the measurements to be repeated. Following disassembly of the test gearbox the teeth were blasted with filtered air to remove any loose debris. No further cleaning was performed to ensure that any transfer films were not disturbed. Comparisons to the pre-test measurements were then used to quantify and map the wear distribution on each tooth. To monitor the accuracy of the measurements one uncoated sample of each gear type was retained as an artefact, and then rechecked at each inspection of the test gears. 95% of all data points remained within 0.27 µm of the original pre-test measurements.
Each of the monitored teeth was also inspected and photographed under magnification to record visual evidence of coating damage or failure. Testing was discontinued once coating penetration could be visually verified by the presence of significant brown staining from oxidation of the substrate on multiple teeth.
Determination of wear rate
The performance of a material couple in sliding wear is often quantified in the form of a wear rate, defined according to Archard's equation. This states that the volume of material worn from rubbing surfaces is proportional to the applied normal force and the sliding distance. 19 When considering a coating, where the useful life is dependent on the thickness, this can be rearranged to consider the wear depth instead of volume:

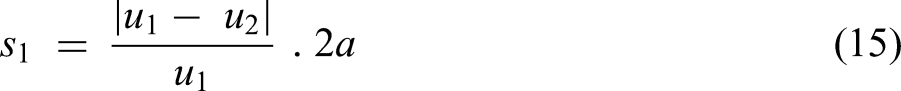
As the curvature, loads, and sliding velocities of the contacting gear teeth vary during the mesh cycle, the sliding distance and contact pressure must be calculated for each position on the tooth surfaces. The following method simplifies the contact between the gear teeth to a pair of loaded rollers of constantly changing radius and velocity and was originally proposed by Flodin and Andersson. 20
During the meshing cycle of the teeth, the contact travels through a straight line of action that is cotangent to the base circles of the involutes. For each position on the line of action, where the pitch point is zero, the radius of curvature on the pinion (1) and wheel (2) can be found by:

At different positions in the mesh cycle, the load is carried by either one or two pairs of teeth. The regions of single- and double-tooth contact are established from the length of the line of action and the base pitch. When a single-tooth pair is in contact the force per unit face width is found by: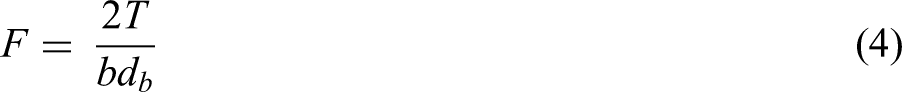


The tooth deflection constant is related to the modulus of elasticity of the material and is the combined stiffness of each tooth in bending. Treating each tooth pair as two springs in series: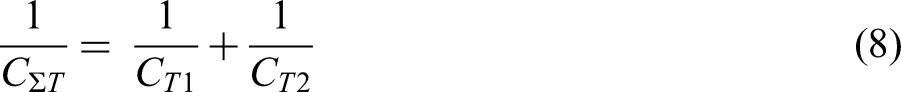
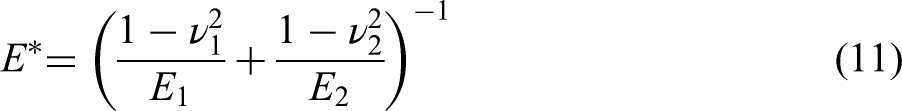
Having determined the radius of curvature and normal forces at each point, the contact conditions may now be calculated by treating the teeth as parallel cylinders in contact using Hertz's formulae. The contact half width is calculated from: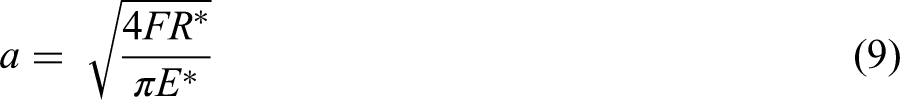

The mean contact pressure is then:


Hence if the contact pressure and wear rate are considered as constant across the contact, the wear depth at a point p on the tooth surface after a single mesh cycle is: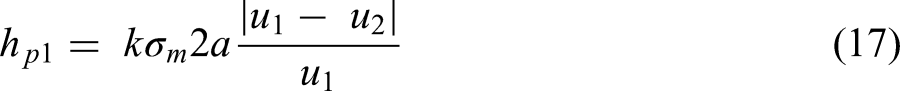
This model can be extended to calculate the cumulative wear over many cycles by breaking up the total duty into discrete periods. This gives the following expression for the wear at a point p after n cycles:
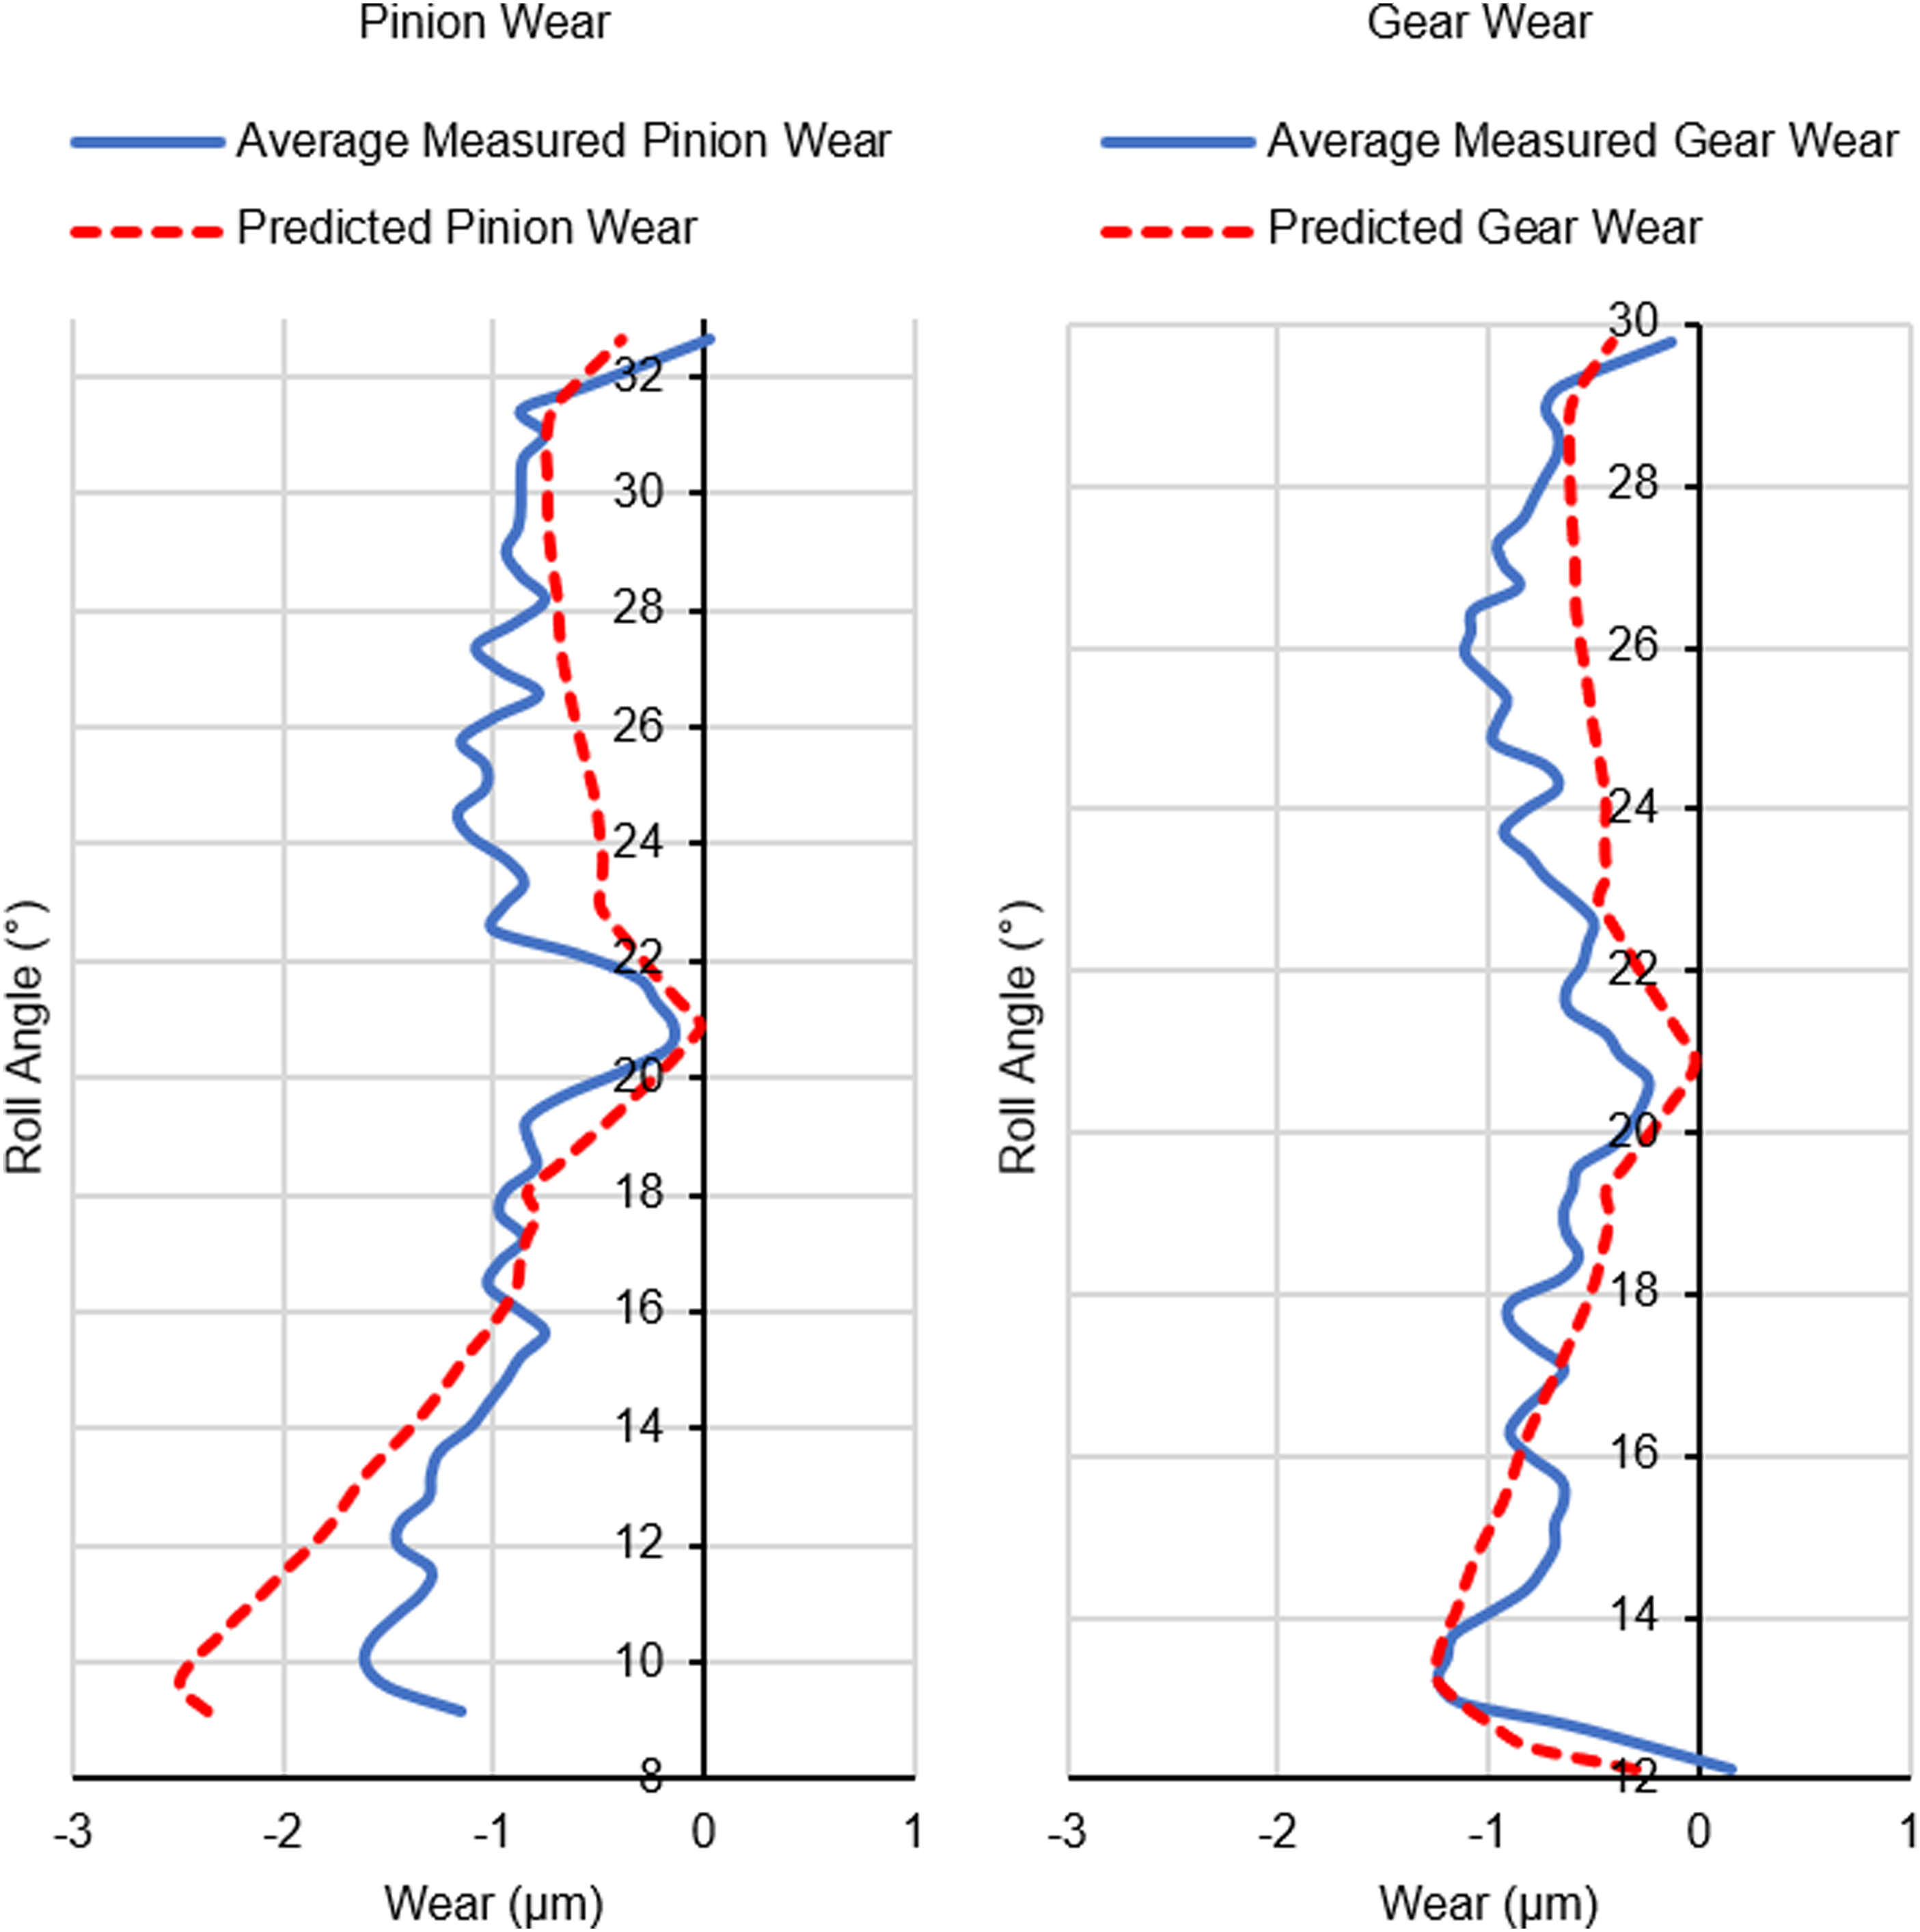
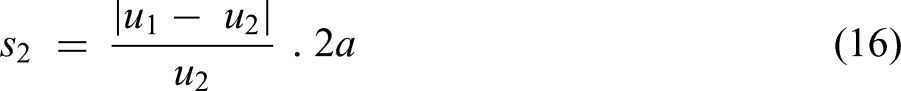
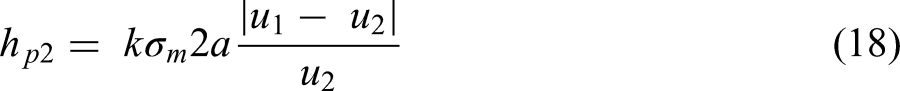
Example of predicted wear distribution fitted to measurements from tested gears.
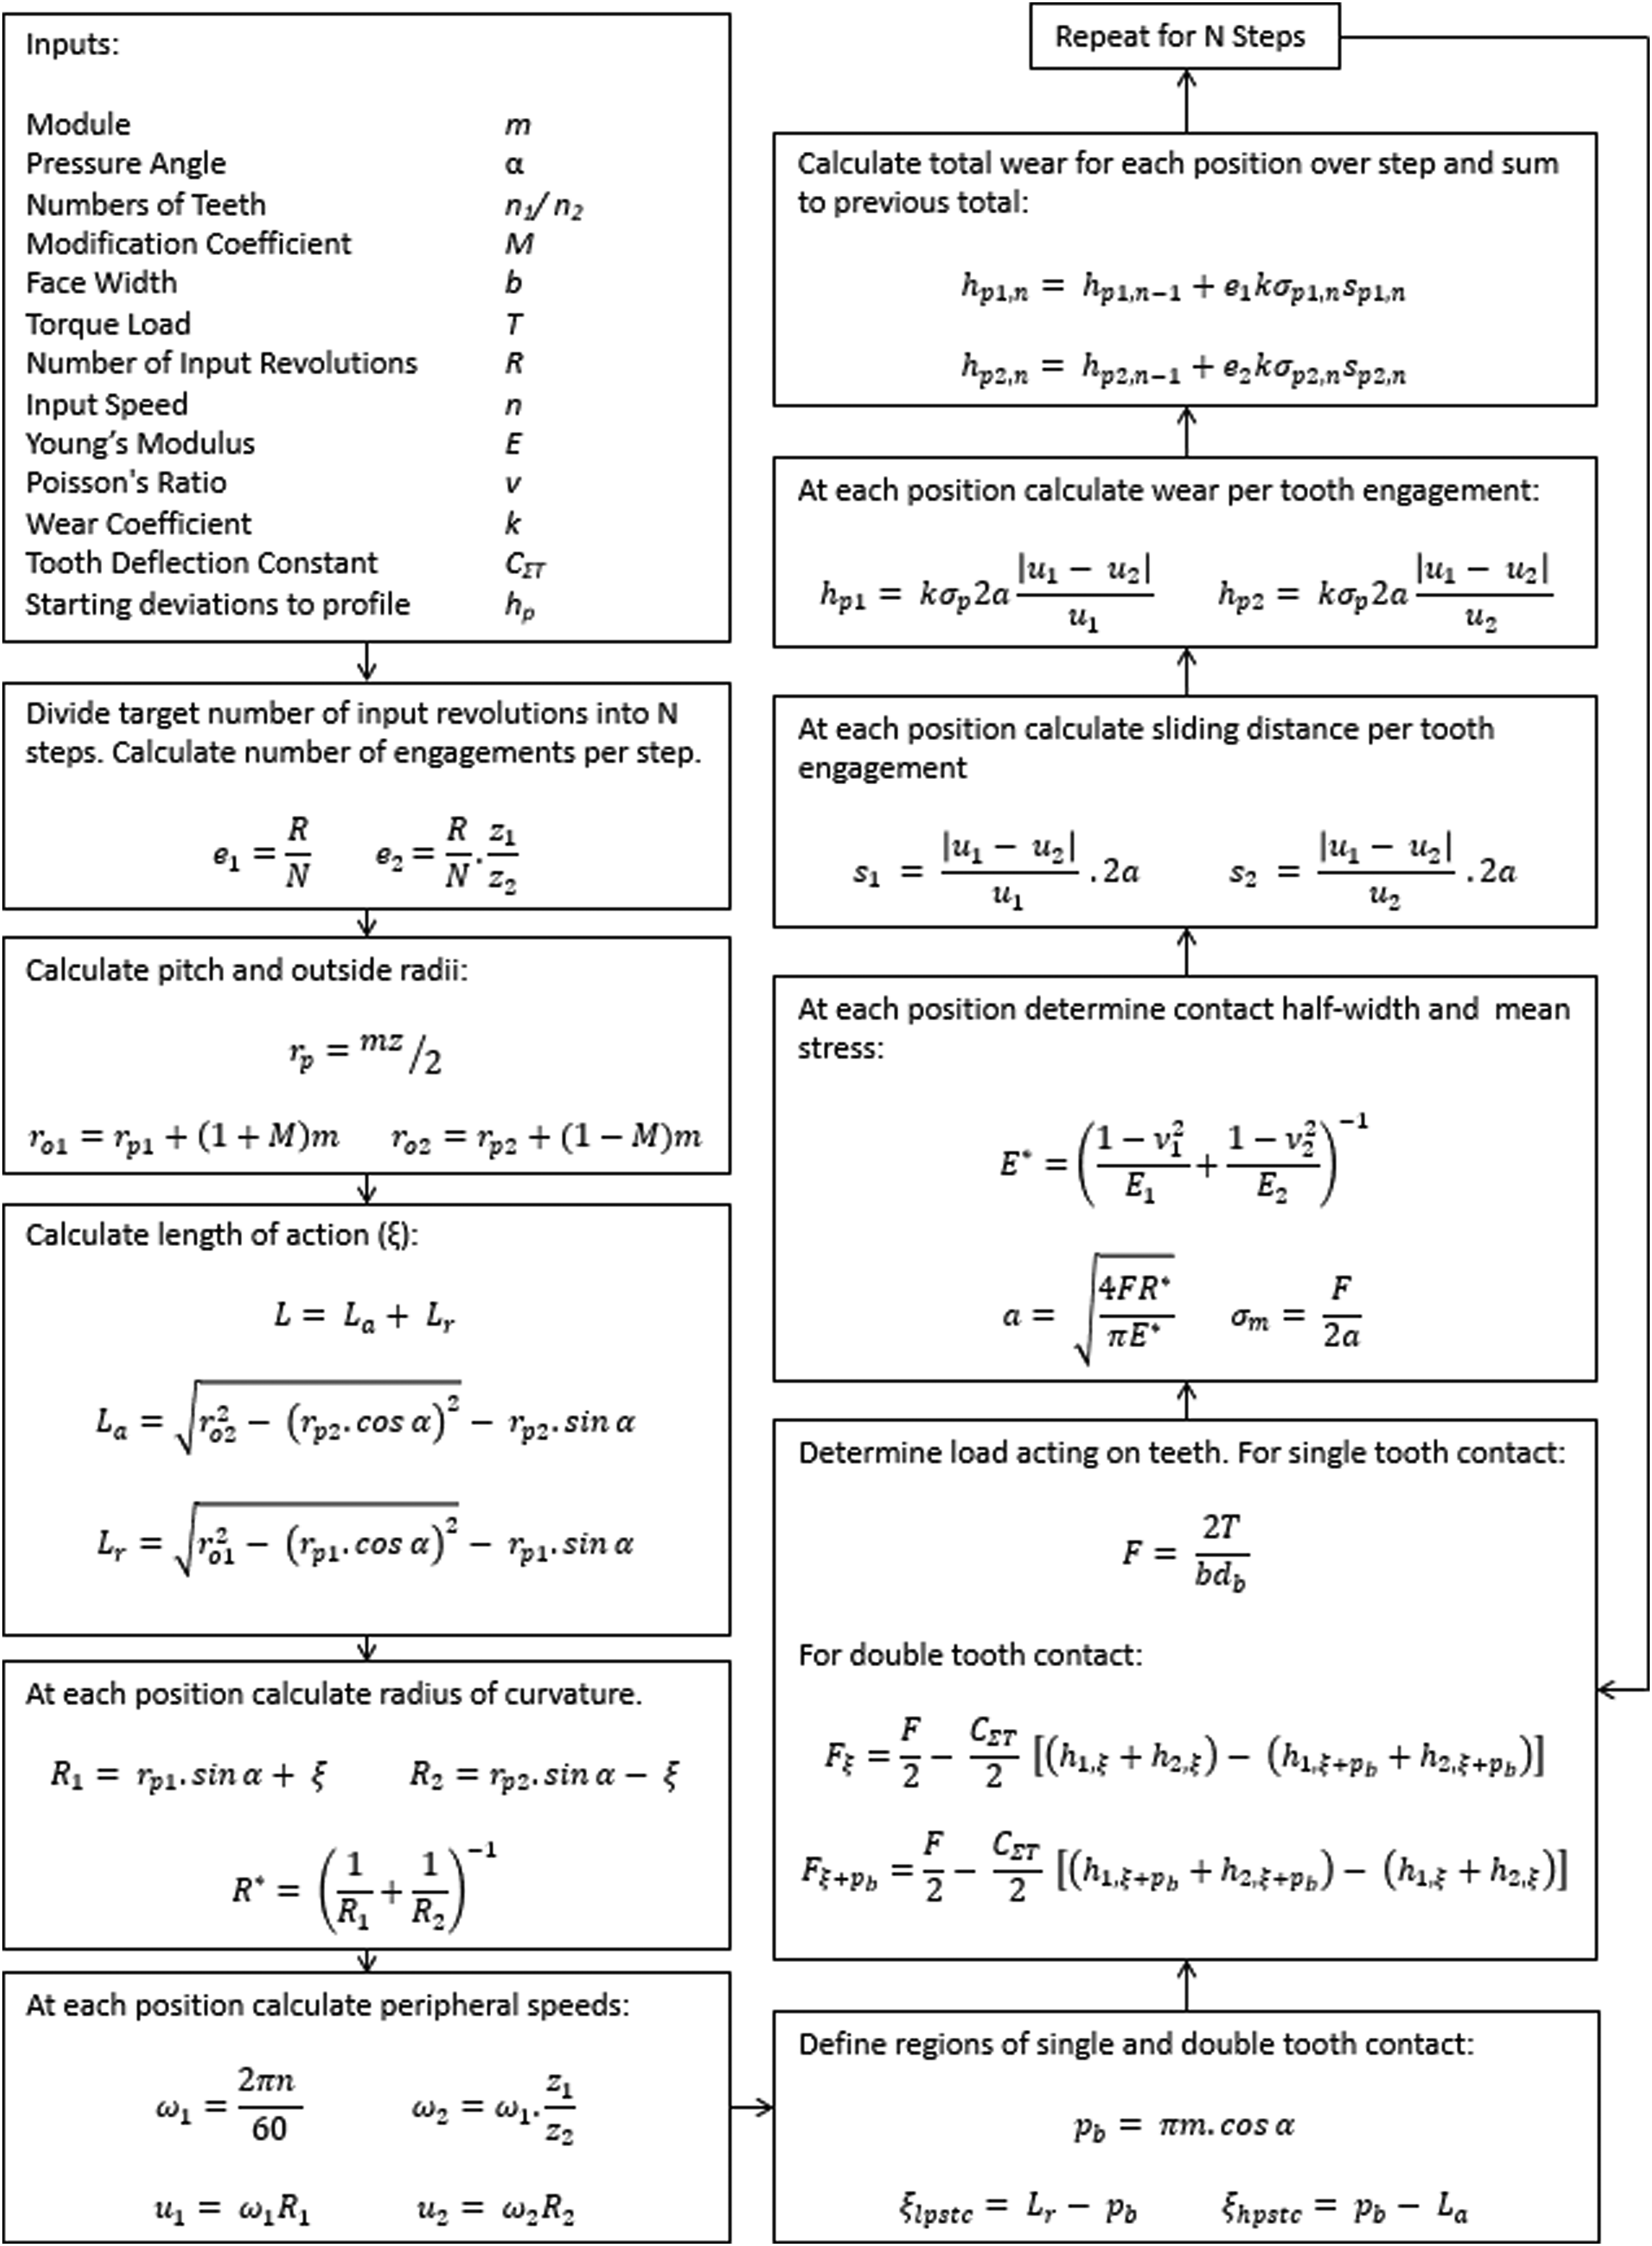
Wear model schematic.
Post-test inspections
On completion of the final set of measurements, the three monitored teeth were sectioned from each gear. After a final visual examination, the teeth were inspected using a Tescan Vega 3 scanning electron microscope (SEM), using both secondary and backscatter electron detectors. Material analysis was performed on areas of interest using an Oxford Instruments INCA energy dispersive x-ray spectroscopy (EDS) system. Further analysis of the worn and as-deposited coating was performed using a Horiba XploRA Raman spectrometer with laser excitation at 532 nm.
Efficiency testing
Efficiency test setup and conditions
Efficiency tests were performed to determine the frictional characteristics of the coated gears, and to provide a comparison of gearbox performance to those lubricated by common aerospace fluid lubricants. Testing was conducted on a power-absorbing test rig. The rig consisted of separate load and drive electric motors with torque transducers positioned to measure the input and output torques. The input torque transducer was a dual range type with separate outputs for 5 and 50 Nm ranges to allow precise measurement of no-load and loaded input torques. This test setup was adopted in place of the power-recirculating wear test rig to allow the losses within the test gearbox to be isolated, and to allow the application of linearly increasing loads to generate efficiency profiles.
Testing was performed at 20°C and at −40°C. Temperature requirements for aerospace actuation equipment in unsealed zones generally specify −40°C as the lower temperature limit at which system performance requirements must be met, though lower temperatures are often specified as survival conditions. Low-temperature tests were performed by surrounding the test gearbox with an insulated enclosure and circulating air with a centrifugal blower. Cooling of the air was performed using liquid N2 in a separate mixing chamber. T-type thermocouples were used to monitor the temperature of the gearbox, with a 2-h cold soak period being implemented once the target temperature was reached to ensure uniform temperature distribution throughout the unit. This test setup is shown schematically in Figure 5. Tests at 20°C were conducted under laboratory conditions with the thermal enclosure and conditioning equipment removed. Between-tests, the gearbox was allowed to naturally cool until the casing thermocouples indicated that any heat had dissipated, with a further 2-h stabilisation time being applied.
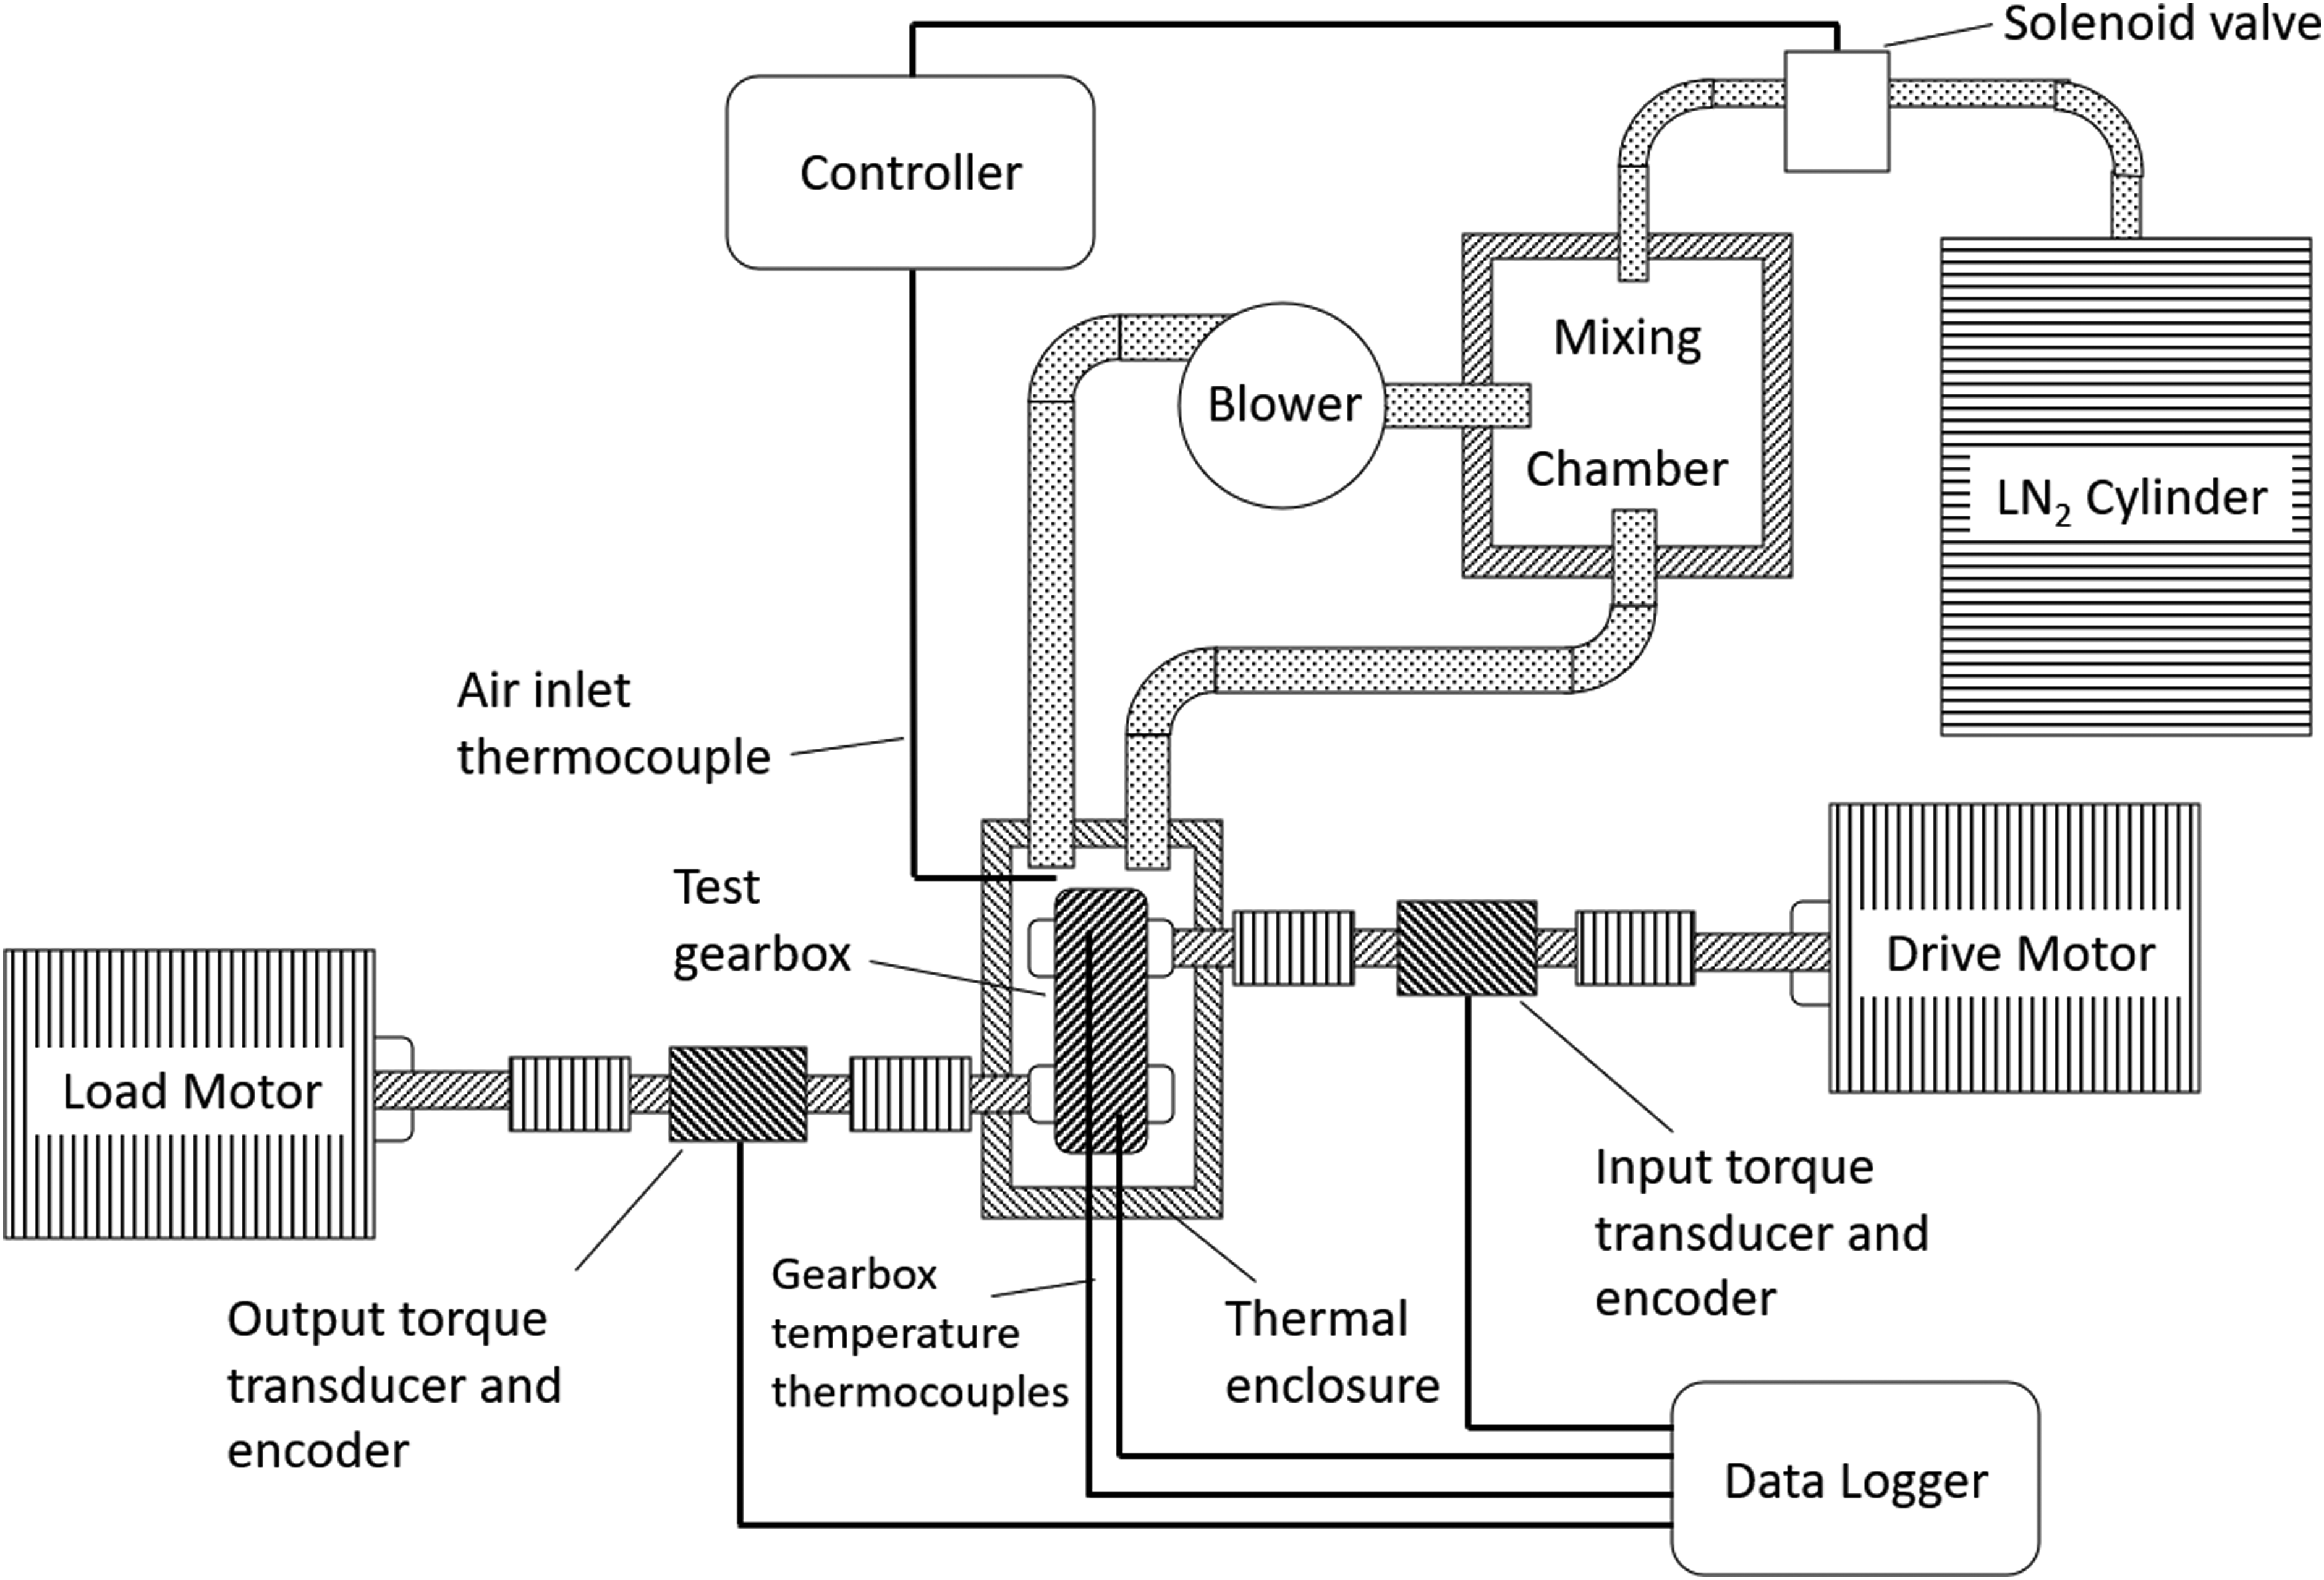
Test setup schematic for efficiency testing at low temperature.
Tests were performed by running the gearbox at 400 rpm against zero load until the input torque had stabilised, then applying a linearly increasing torque load. This test was repeated using uncoated gears, with the gearbox lubricated with common aerospace actuation fluid lubricants for comparison. The selected fluids were MIL-PRF-7808 turbine oil and AMS-3057 semi-fluid grease. The gearbox was filled sufficiently to immerse the lower 25% of the input and output seal lips.
During testing at −40°C the fluid lubricants exhibited a time-dependent decay of the no-load losses prior to stabilising. As the starting conditions are often key to meeting performance requirements in actuation systems, which typically operate only for brief periods at a time, the gearbox was additionally operated against a range of discrete starting torques. During these tests, the efficiency was measured immediately after the speed had stabilised in order to assess the impact of the starting, rather than running, no-load losses when the net efficiency is at its minimum. The starting no-load losses were then found by performing separate unloaded movements.
Calculation of tooth friction
Power losses in gearboxes can be separated into load-dependent and no-load losses. The load-dependent losses are caused by friction between the gear teeth and frictional moments of the bearing rolling elements. The no-load losses are caused by friction from gearbox and bearing seals, and churning losses of the lubricant. See equation (20), taken from Fernandes et al.
23


With all other terms having been determined, the load-dependent losses from the gears Pgl can be calculated from the overall power losses measured during the test. The average coefficient of friction during the meshing action may then be calculated according to Ohlendorf
25
from equation (23).
Results and discussion
Wear test results and discussion
On the vast majority of teeth and at all load cases the first 100–500 test cycles resulted in localised wear around the SAP on the teeth. However, during subsequent cycling this localised root wear deepened very slowly and remained bright and reflective. The overall contact area was clearly visible as a darker and more reflective region when compared with the as-deposited coating. A line of unworn, unreflective coating was visible at the pitch circle.
With further operation, most samples began to display the anticipated wear pattern. Wear at the pitch circle was negligible, whilst in the dedendum the wear was deeper with increasing distance from the pitch circle, eventually blending with the root wear, which had broadened both across the face width and up the profile. On the addendum, the wear tended to be highest approximately midway between pitch circle and the tips.
In most cases when testing at 10 and 20 Nm, the first evidence of coating failure was observed on the mid-addendum. This was initially evident as bright, reflective lines that were oriented across the face of the tooth. With further cycling these regions increased in size and developed a brown colouration, indicating complete removal of the coating and oxidation of the underlying substrate. At 30 Nm, coating failure occurred on the tooth addendum of one gear, and on the contacting point on the dedendum of the mating tooth. However, there were also instances on some teeth of coating failure and oxidation at the SAP and tips. Figure 6 shows the progression of wear on a typical tooth from testing at 20 Nm.
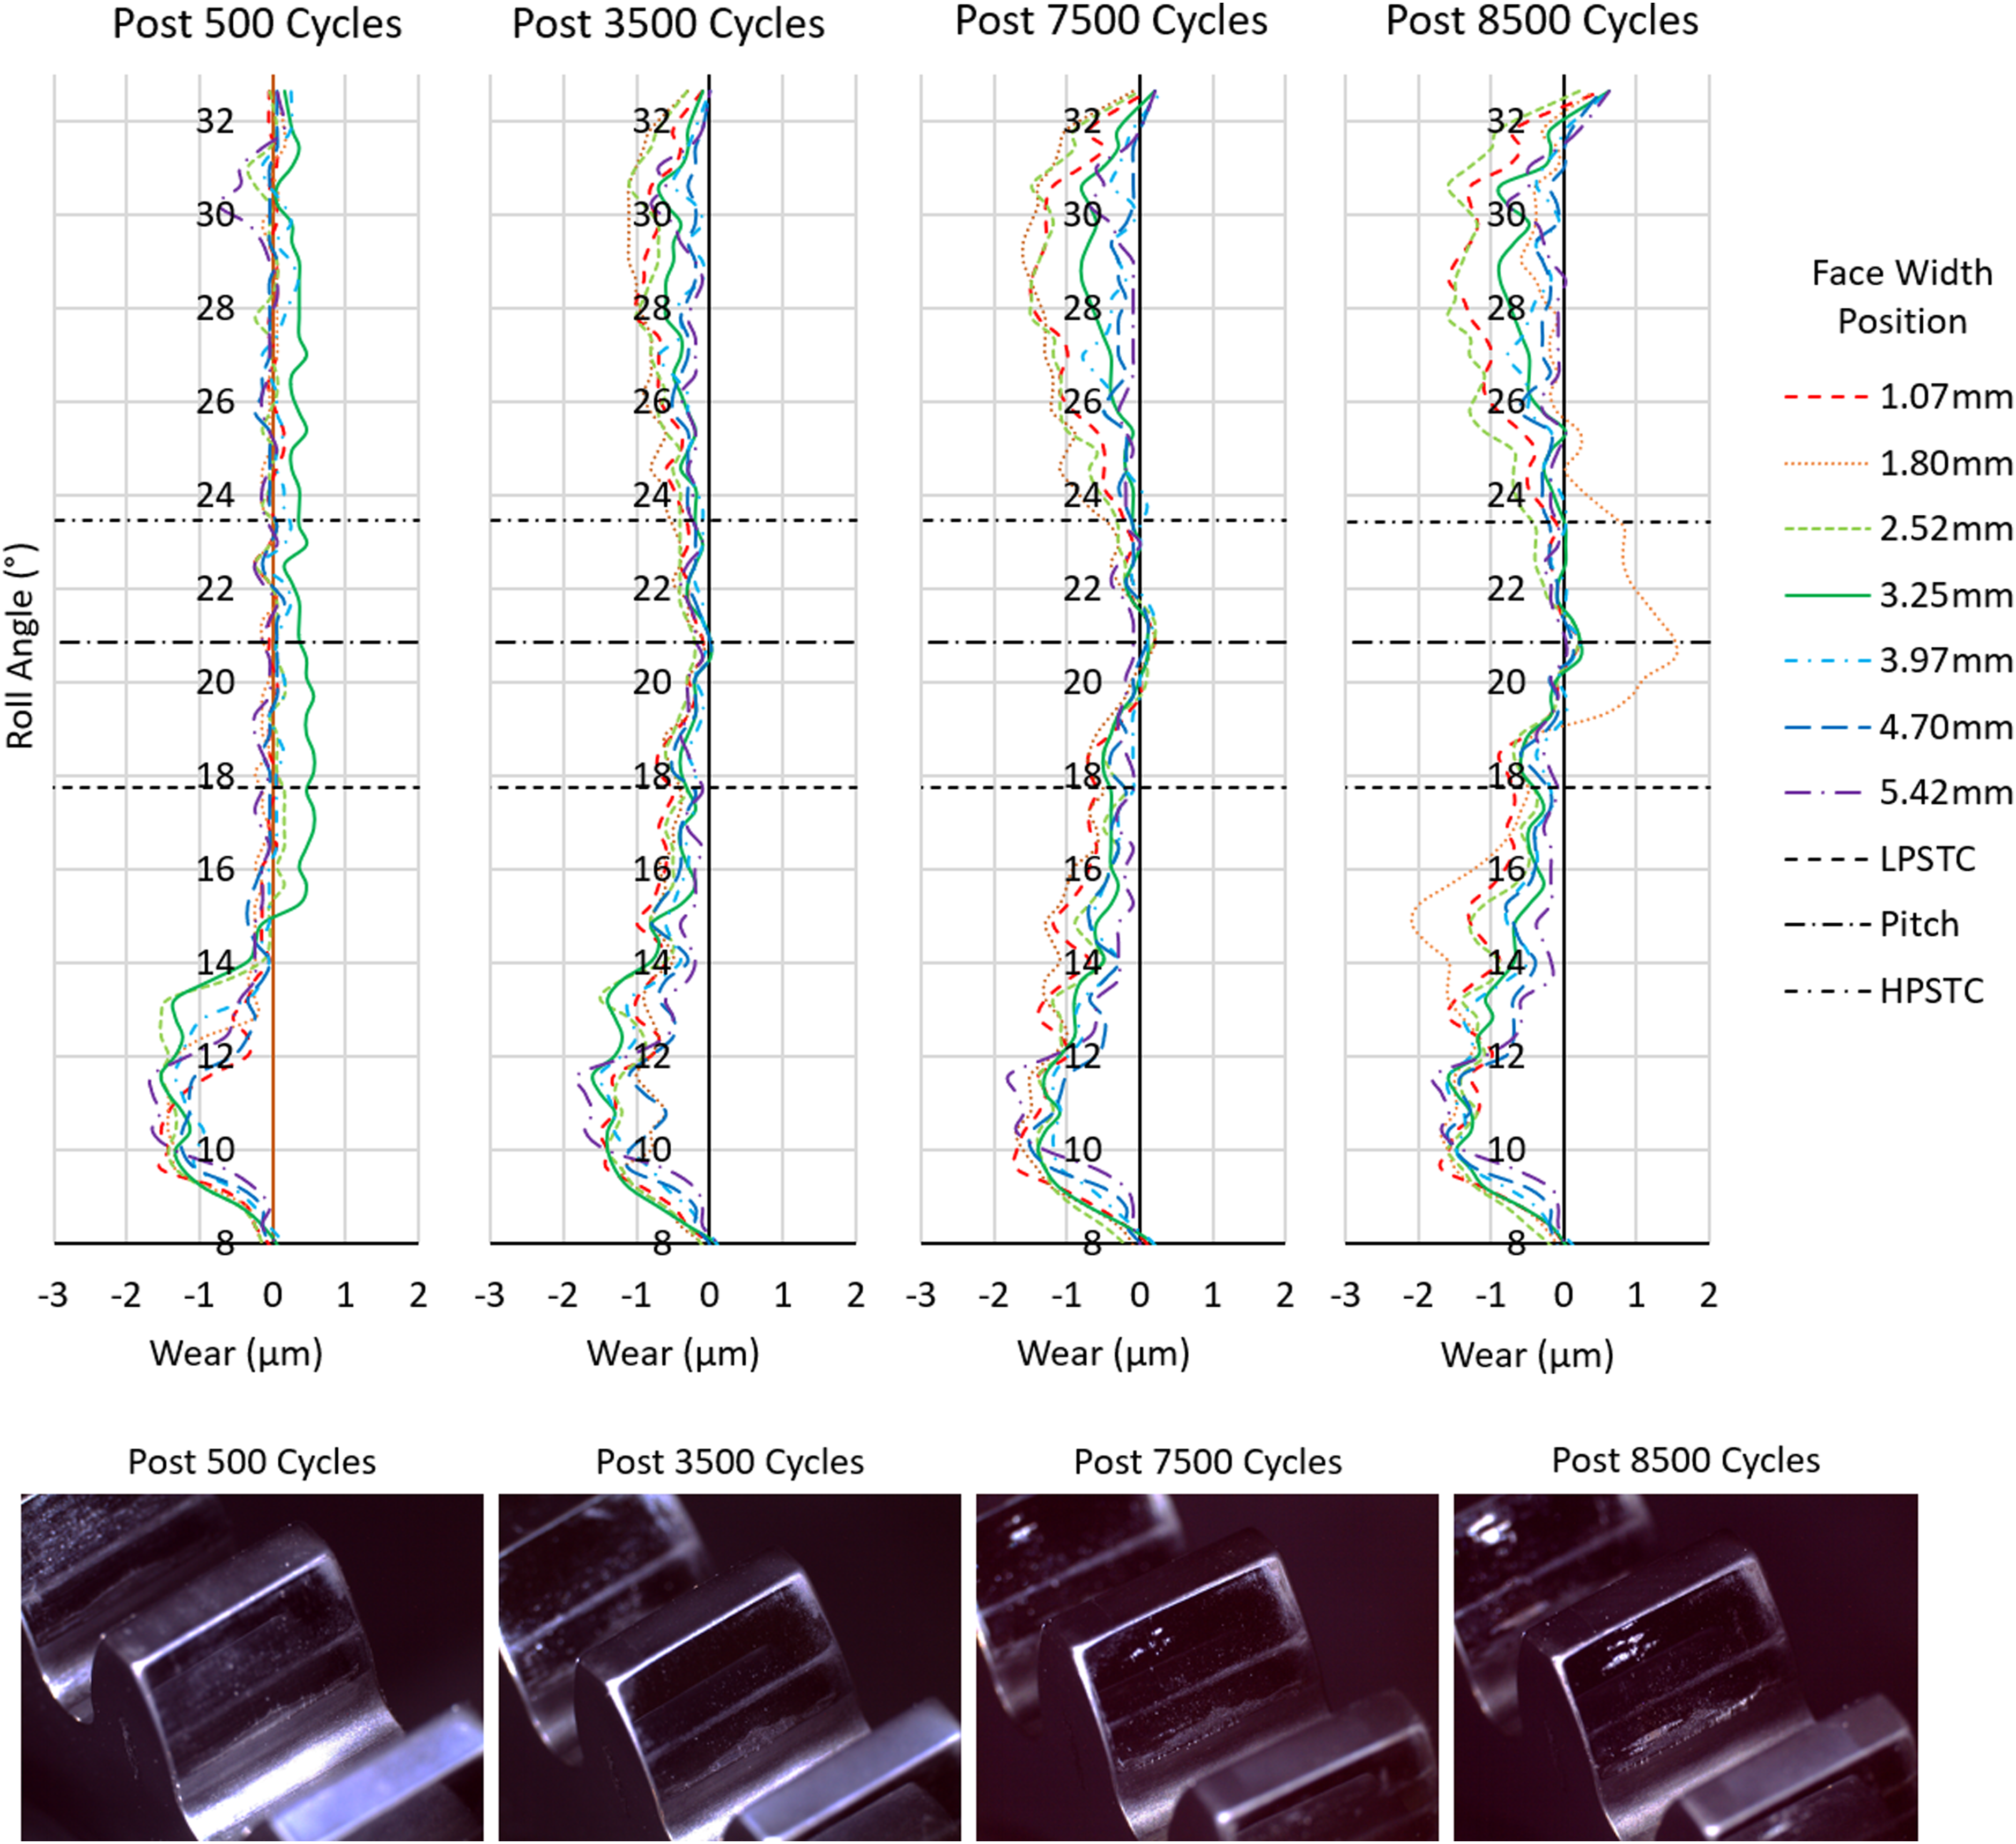
Example wear maps and images of monitored tooth during testing at 20 Nm.
As anticipated, increasing the applied torque load resulted in more rapid failure of the coating. The initial root wear, in terms of area and depth, was more severe at higher loads, but the calculated average wear rate for the post-test measured profiles showed reasonable consistency across the load range. The highest wear rates (4.25E-11 mm3/N.mm) occurred during cycling at 10 Nm, whilst the lowest wear rates (2.34E-11 mm3/N.mm) occurred during cycling at 20 Nm. However, there was a significant overlap in the range of wear rates measured at different loads. Figure 7 shows the range of wear rates for each load at the input and output meshes of the gearbox on the monitored gear teeth. As three tooth pairs were monitored for the input and output meshes, the wear rate for each tooth pair is shown as a single data point, giving three data points for each combination of load and mesh. It should be noted that as coating penetration occurred during testing, the reported wear rate is for the combined coating and substrate. Figure 8 displays the maximum wear depth against test cycles, using the average of the maximum wear depth measured on each of the 12 monitored teeth in the gearbox during the test run. The sudden increase in wear evident after 5500 cycles at 30 Nm is due to direct meshing between regions of the mating teeth where all coating had been worn away on both surfaces. When assessing the correlation in wear distribution between the measured components and the model output, it was noted that the magnitude of addendum wear was often greater than predicted in comparison to the dedendum (refer to Figure 3).
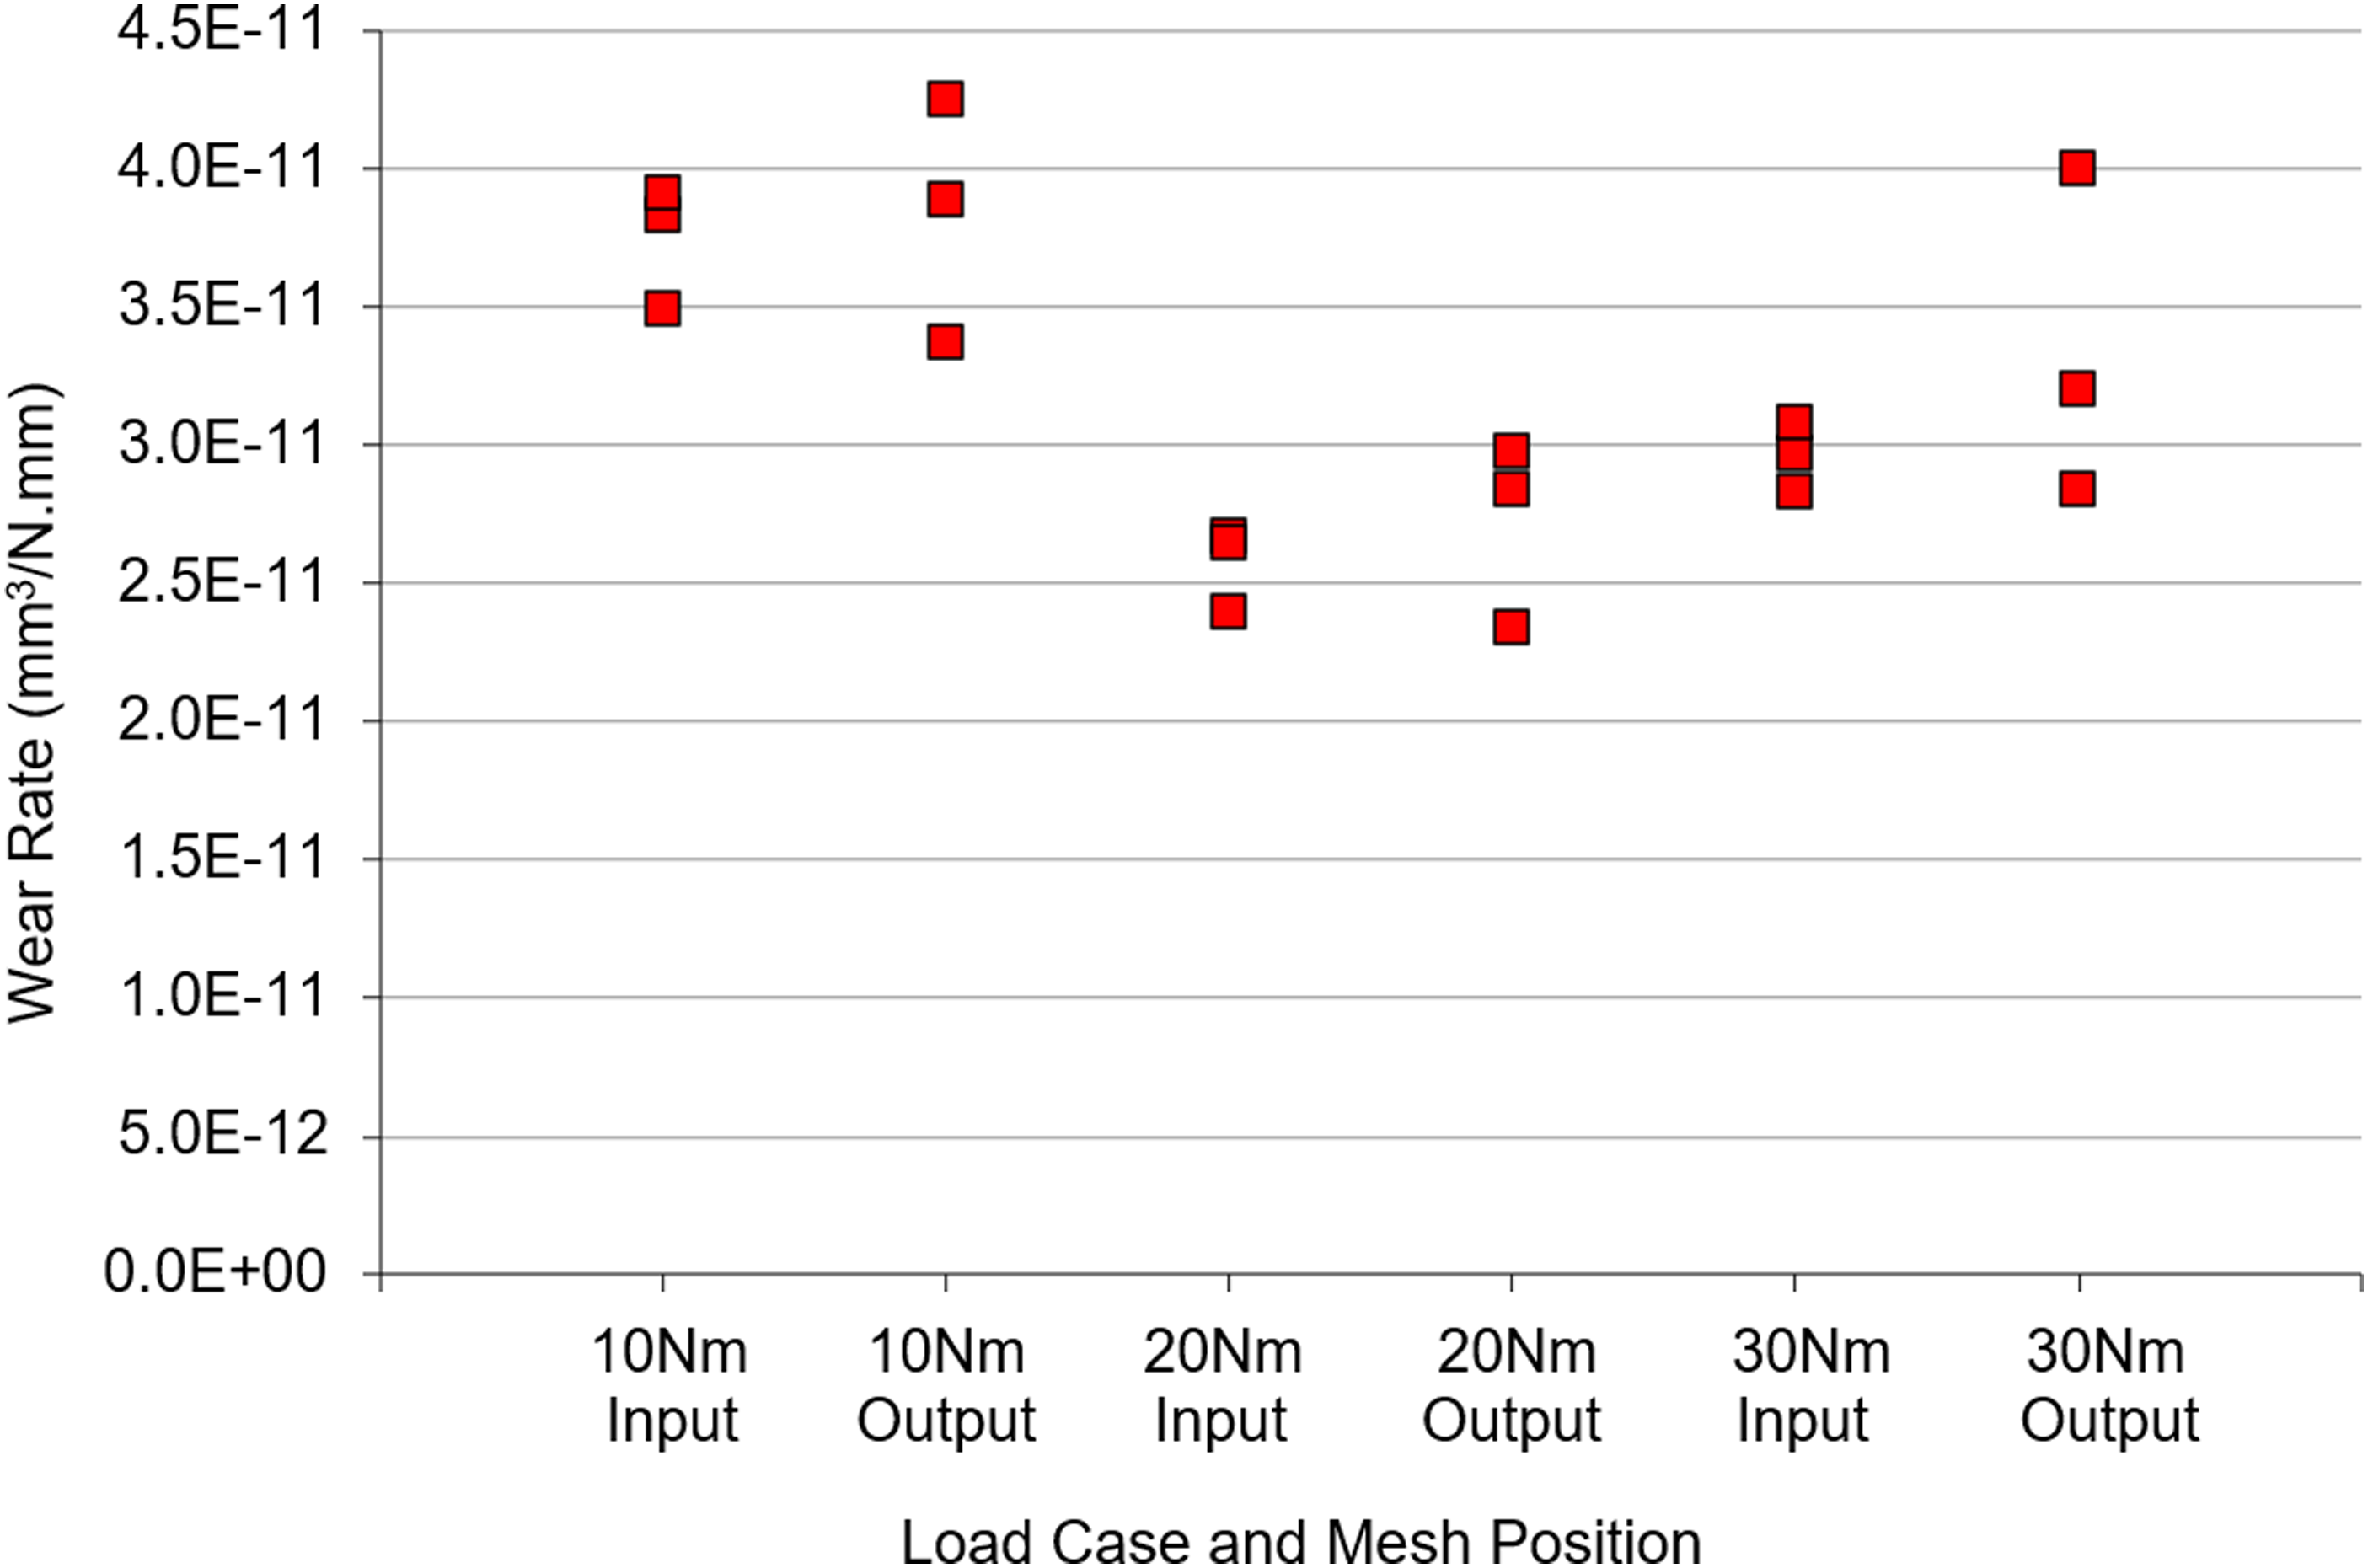
Calculated post-test wear rates for tooth pairs by torque load and mesh position.
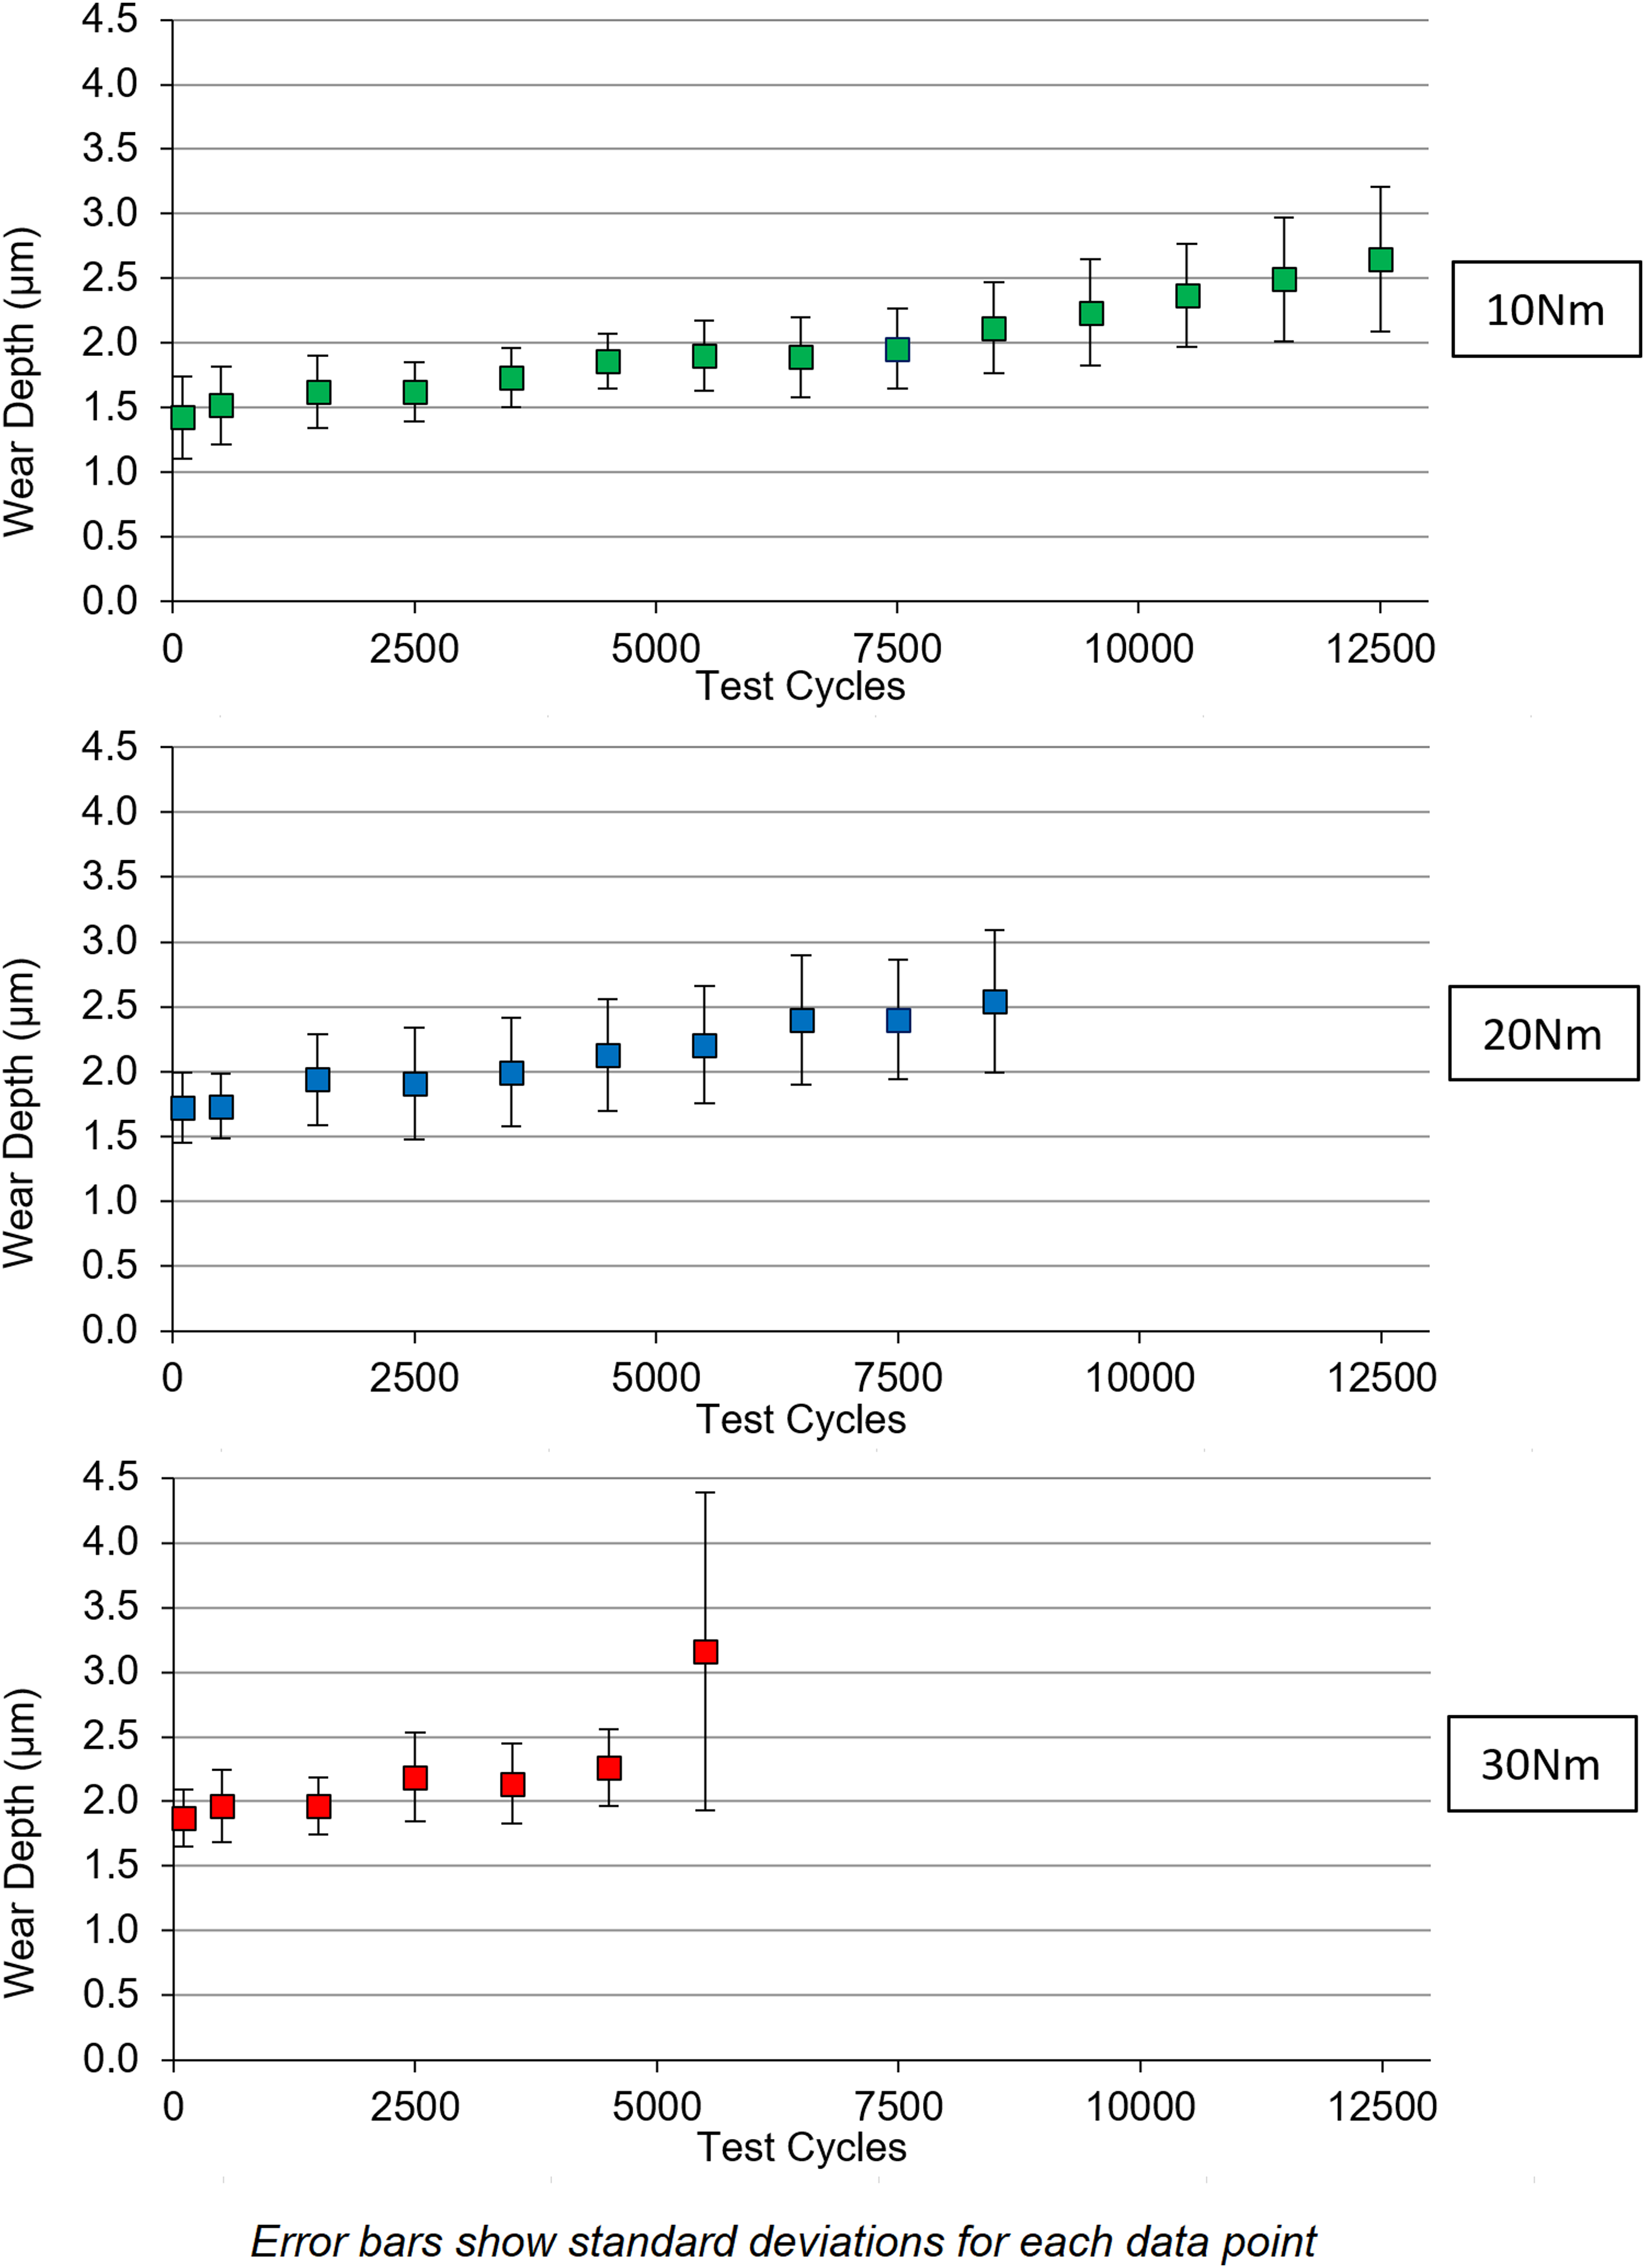
Maximum wear depth vs. test cycles.
During the post-test SEM inspection, backscatter imaging was used to further visualise the distribution of wear to the tooth surfaces. Due to the greater atomic number of the underlying substrate and the subsurface emission of backscattered electrons, the images display more heavily worn areas of the tooth with a brighter shade. The worn areas around the SAP were sharply contrasted with the adjacent coated areas, indicating that the process of initial damage to the coating is one of delamination rather than sliding wear. Areas of coating failure on the addendum were almost indistinguishable from the surrounding coating, which also appeared to be heavily worn. This is more consistent with a process of gradual material removal by sliding wear. The images also highlighted bands of wear variation extending across the faces of the teeth, with a large band of low wear evident around the pitch circle. Figure 9 provides a comparison of optical and backscatter imagery for a tooth at the end of testing.
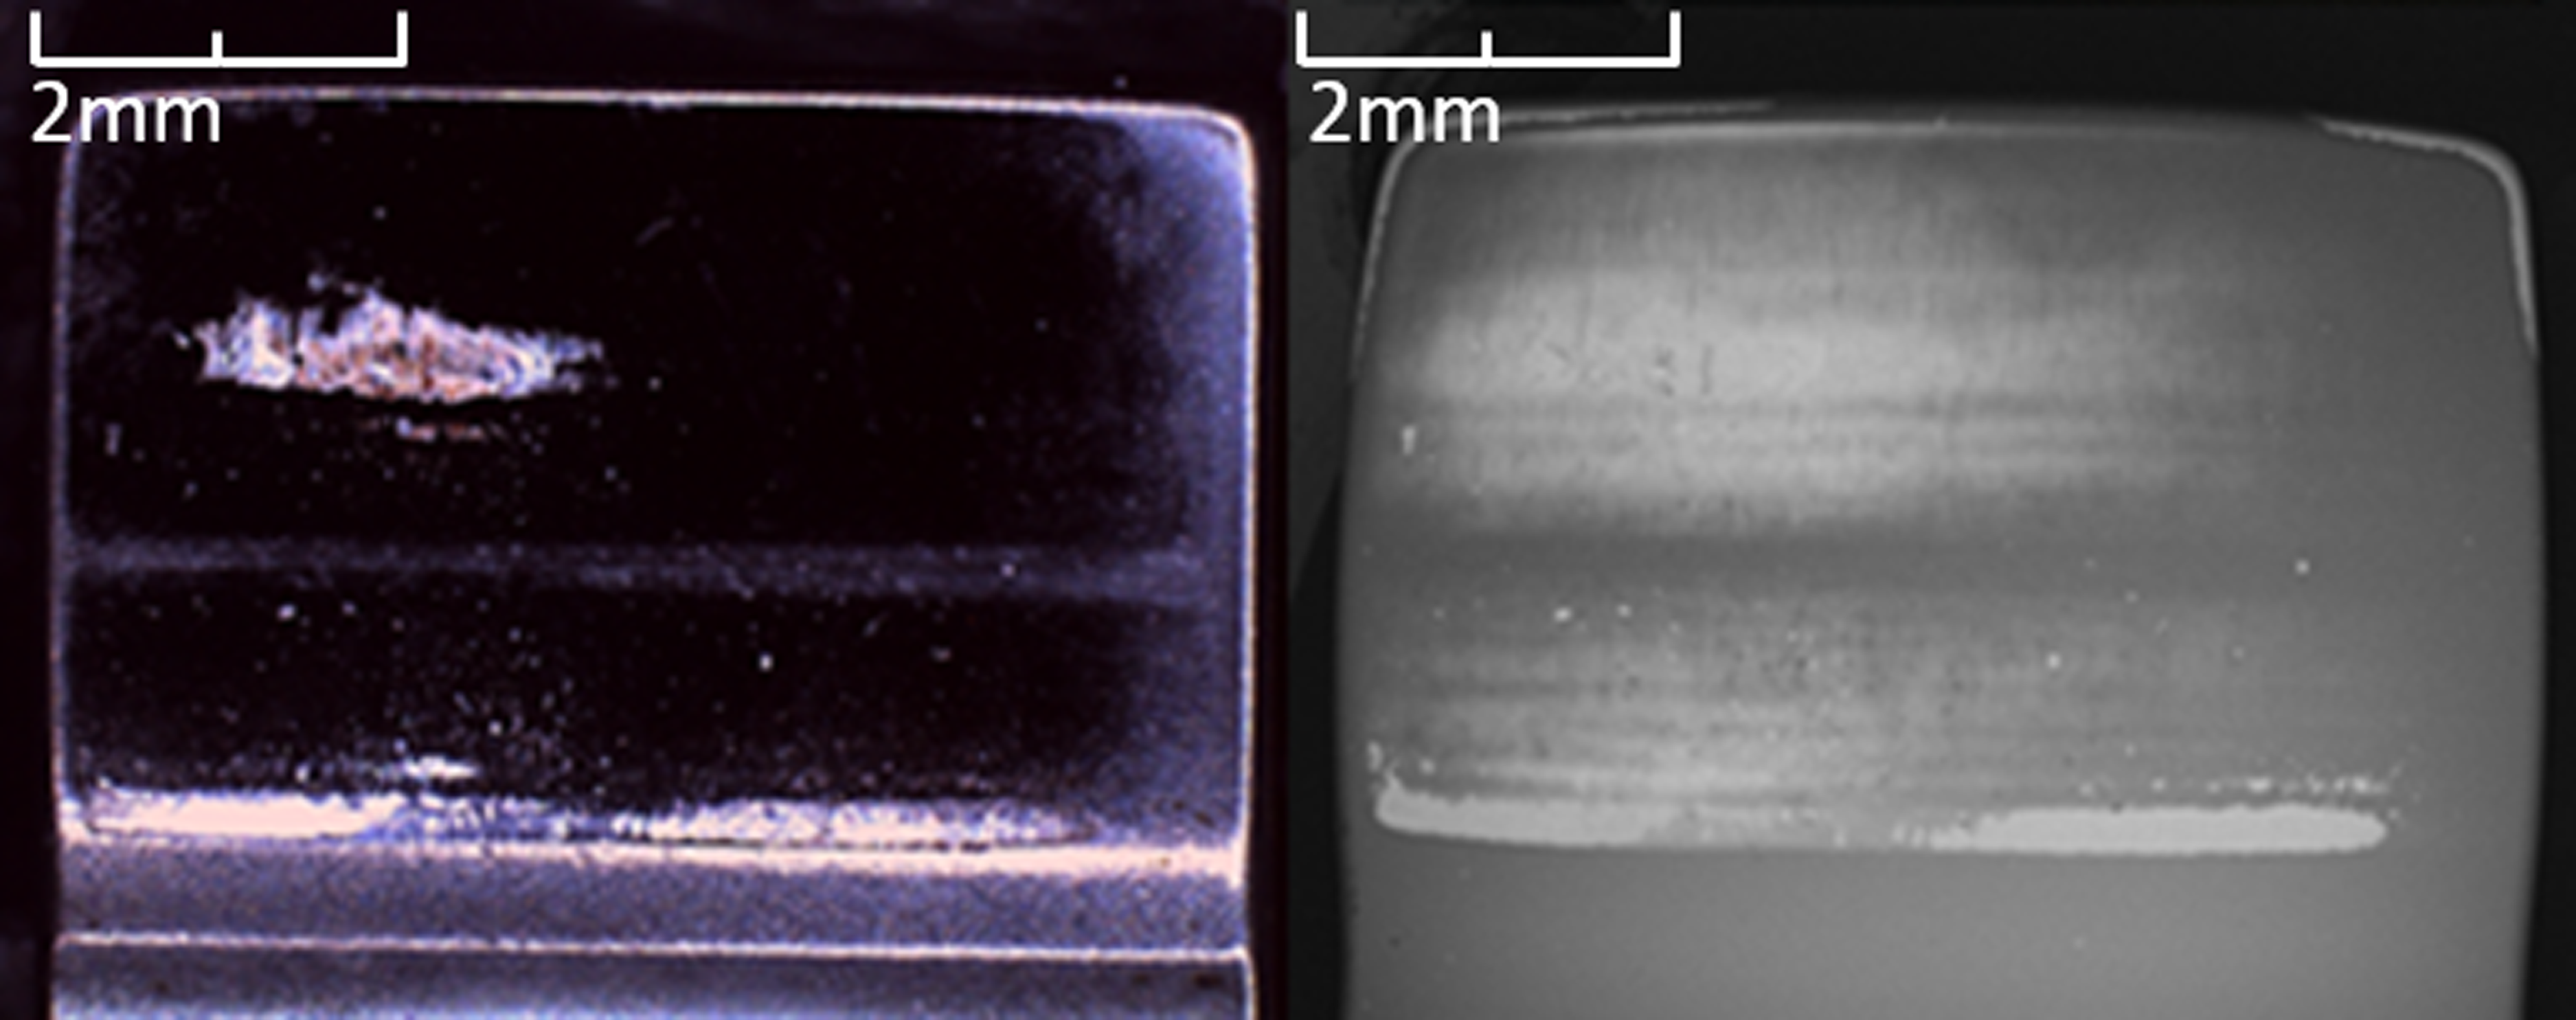
Post-test microscopic and SEM backscatter imagery of Graphit-iC coated tooth.
Areas of interest were studied further using secondary electron imagery. Figure 10 shows the regions of coating damage at the SAP and mid-addendum of the tooth shown in Figure 9. At the SAP, the lower edge of the worn area was marked with an abrupt boundary between coating and exposed substrate, indicating that the coating in this region had suffered from delamination. The upper edge of the area was more irregular in shape, and the edges of the coating were not visible. The edges from the initial delamination appeared to have been blended by the subsequent sliding wear. The region immediately above the exposed substrate was pockmarked with round delaminated areas, mostly 10–20 µm in diameter. This may have been due to debris impacts from the initial failure. The exposed substrate was marked with scratches oriented in the direction of sliding.
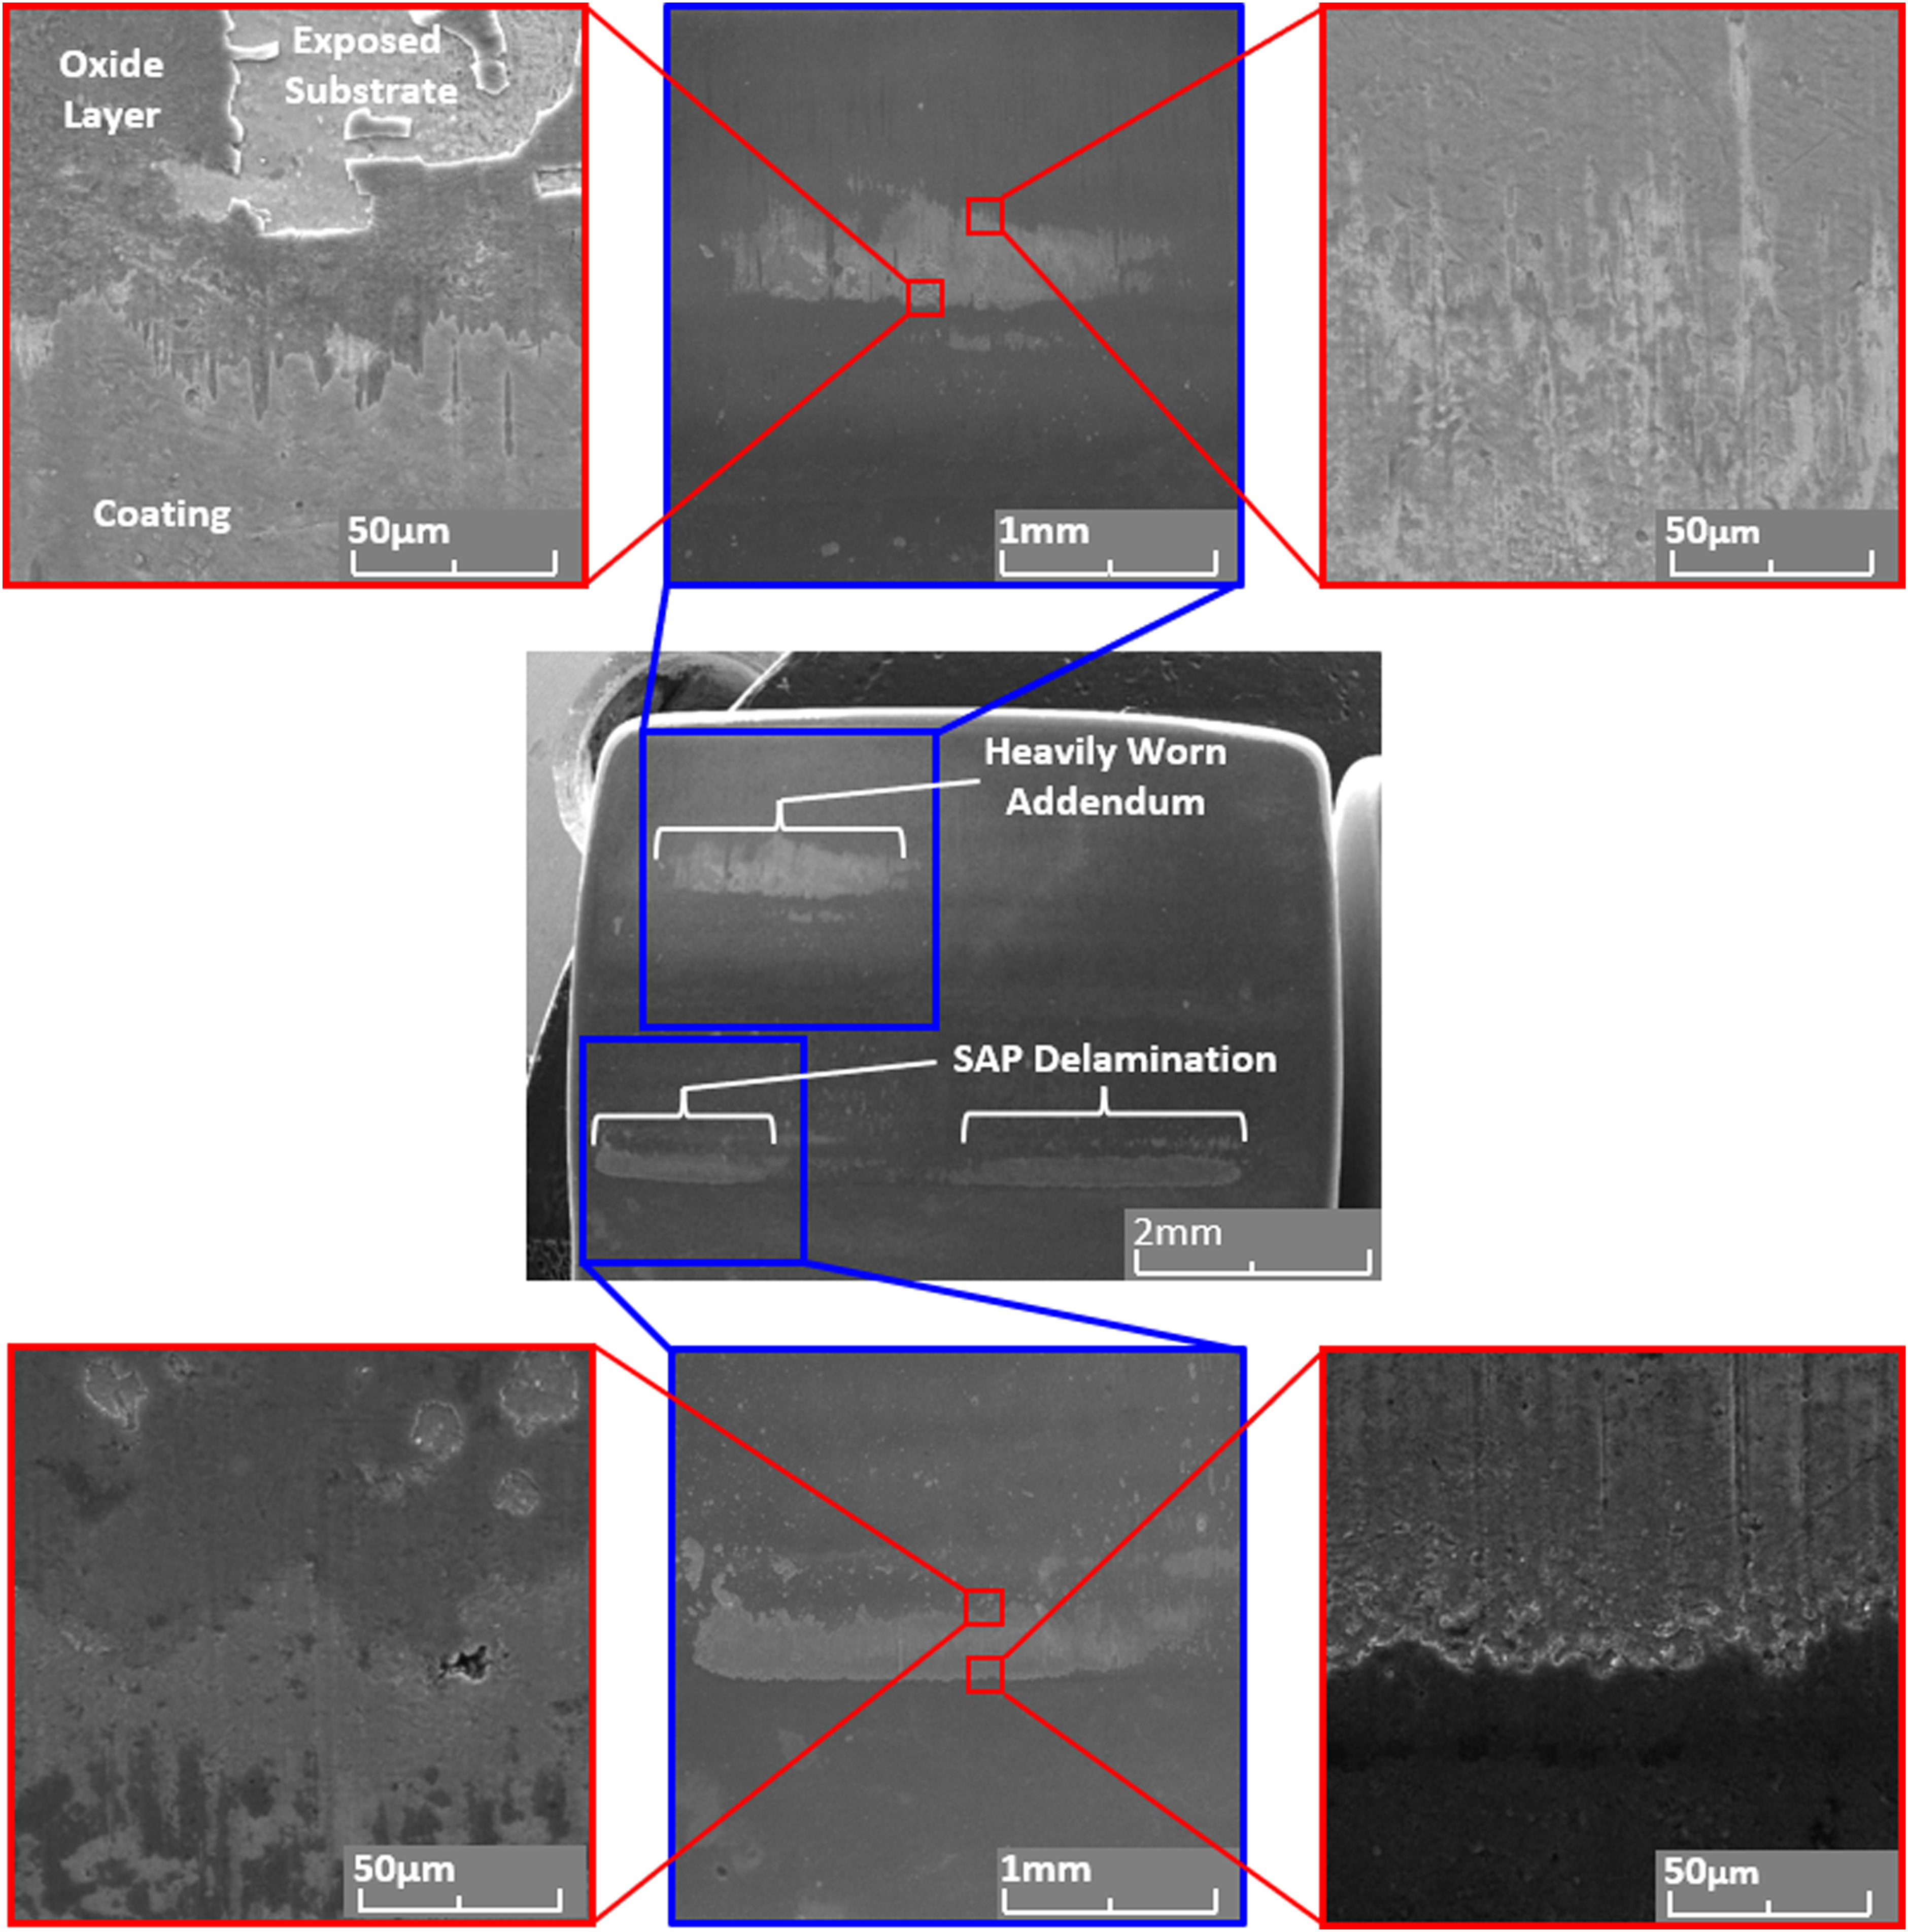
SEM secondary electron imagery of wear to addendum and SAP.
On the region of mid-addendum coating failure, both the upper and lower edges were jagged and irregular in appearance, with the peaks and troughs oriented in the direction of sliding. The brown-stained areas of the exposed substrate were covered in a thick oxide layer, which was cracked and spalling away in places. The edges of the coating were not visible. Some small patches of intact coating remained within the zone of failure and were also oriented in the direction of sliding.
EDS analysis for the as-deposited coating and underlying substrate detected 54% by weight C, 22% Cr, 20% Fe, with 1–2% O, Ar and Ni. Partially worn areas showed a reduction in the detected C content, and a corresponding increase in the detected Cr and Fe due to the wear of the coating bringing more of the Cr interlayer and steel substrate within the penetration depth of the electron beam. In heavily worn areas on the addendum where the coating was no longer visible, the EDS continued to detect 6–11% C. The presence of O varied significantly between 32% in regions with thick oxide layers, to as little as 2% in regions where the oxide layer had spalled away to expose the substrate. In and around the regions with thick oxide layers very little C or Cr content was present: 6–9% and 1–6%, respectively. In the delaminated regions on the SAP, although the C content was also greatly reduced, all areas continued to exhibit >17% Cr. This may provide an explanation for the absence of brown staining in these regions: sufficient Cr was present to protect the surface from gross oxidation. It may also indicate that the apparent delamination had not occurred between the interlayer and substrate, but between the interlayer and transition layer instead. Refer back to Figure 10 for illustrations of these areas of interest.
Post-test Raman spectra from the as-deposited and partially worn coating are displayed in Figure 11. Disordered carbons have sp3 and sp2 sites. In our study, the sp3 sites cannot be determined in a simple way because the Raman excitation using visible laser source (532 nm) does not have sufficient energy to vibrate the sp3 sites. Thus, our study could analyse the sp2 sites only. Raman spectra of disordered C are dominated by two bands. 27 The G (graphite) band involves the in-plane stretching of pairs of C sp2 atoms. This is attributed to both stretching of aromatic rings and vibrations of C-C chains. The broad peak area of the D (disorder) band is attributed to the breathing mode of the six-fold aromatic C-rings and other vibration modes of the C-C chains (in-phase and out-of-phase carbon chain vibrations). 28 In both cases of our study (as-deposited and worn material), the Raman spectra cannot be deconvoluted in a simple way using two main D and G peaks. A more accurate fit was obtained when other peaks in the D region were introduced. The spectra have been deconvoluted into multiple peak fits using Gaussian curves. 29
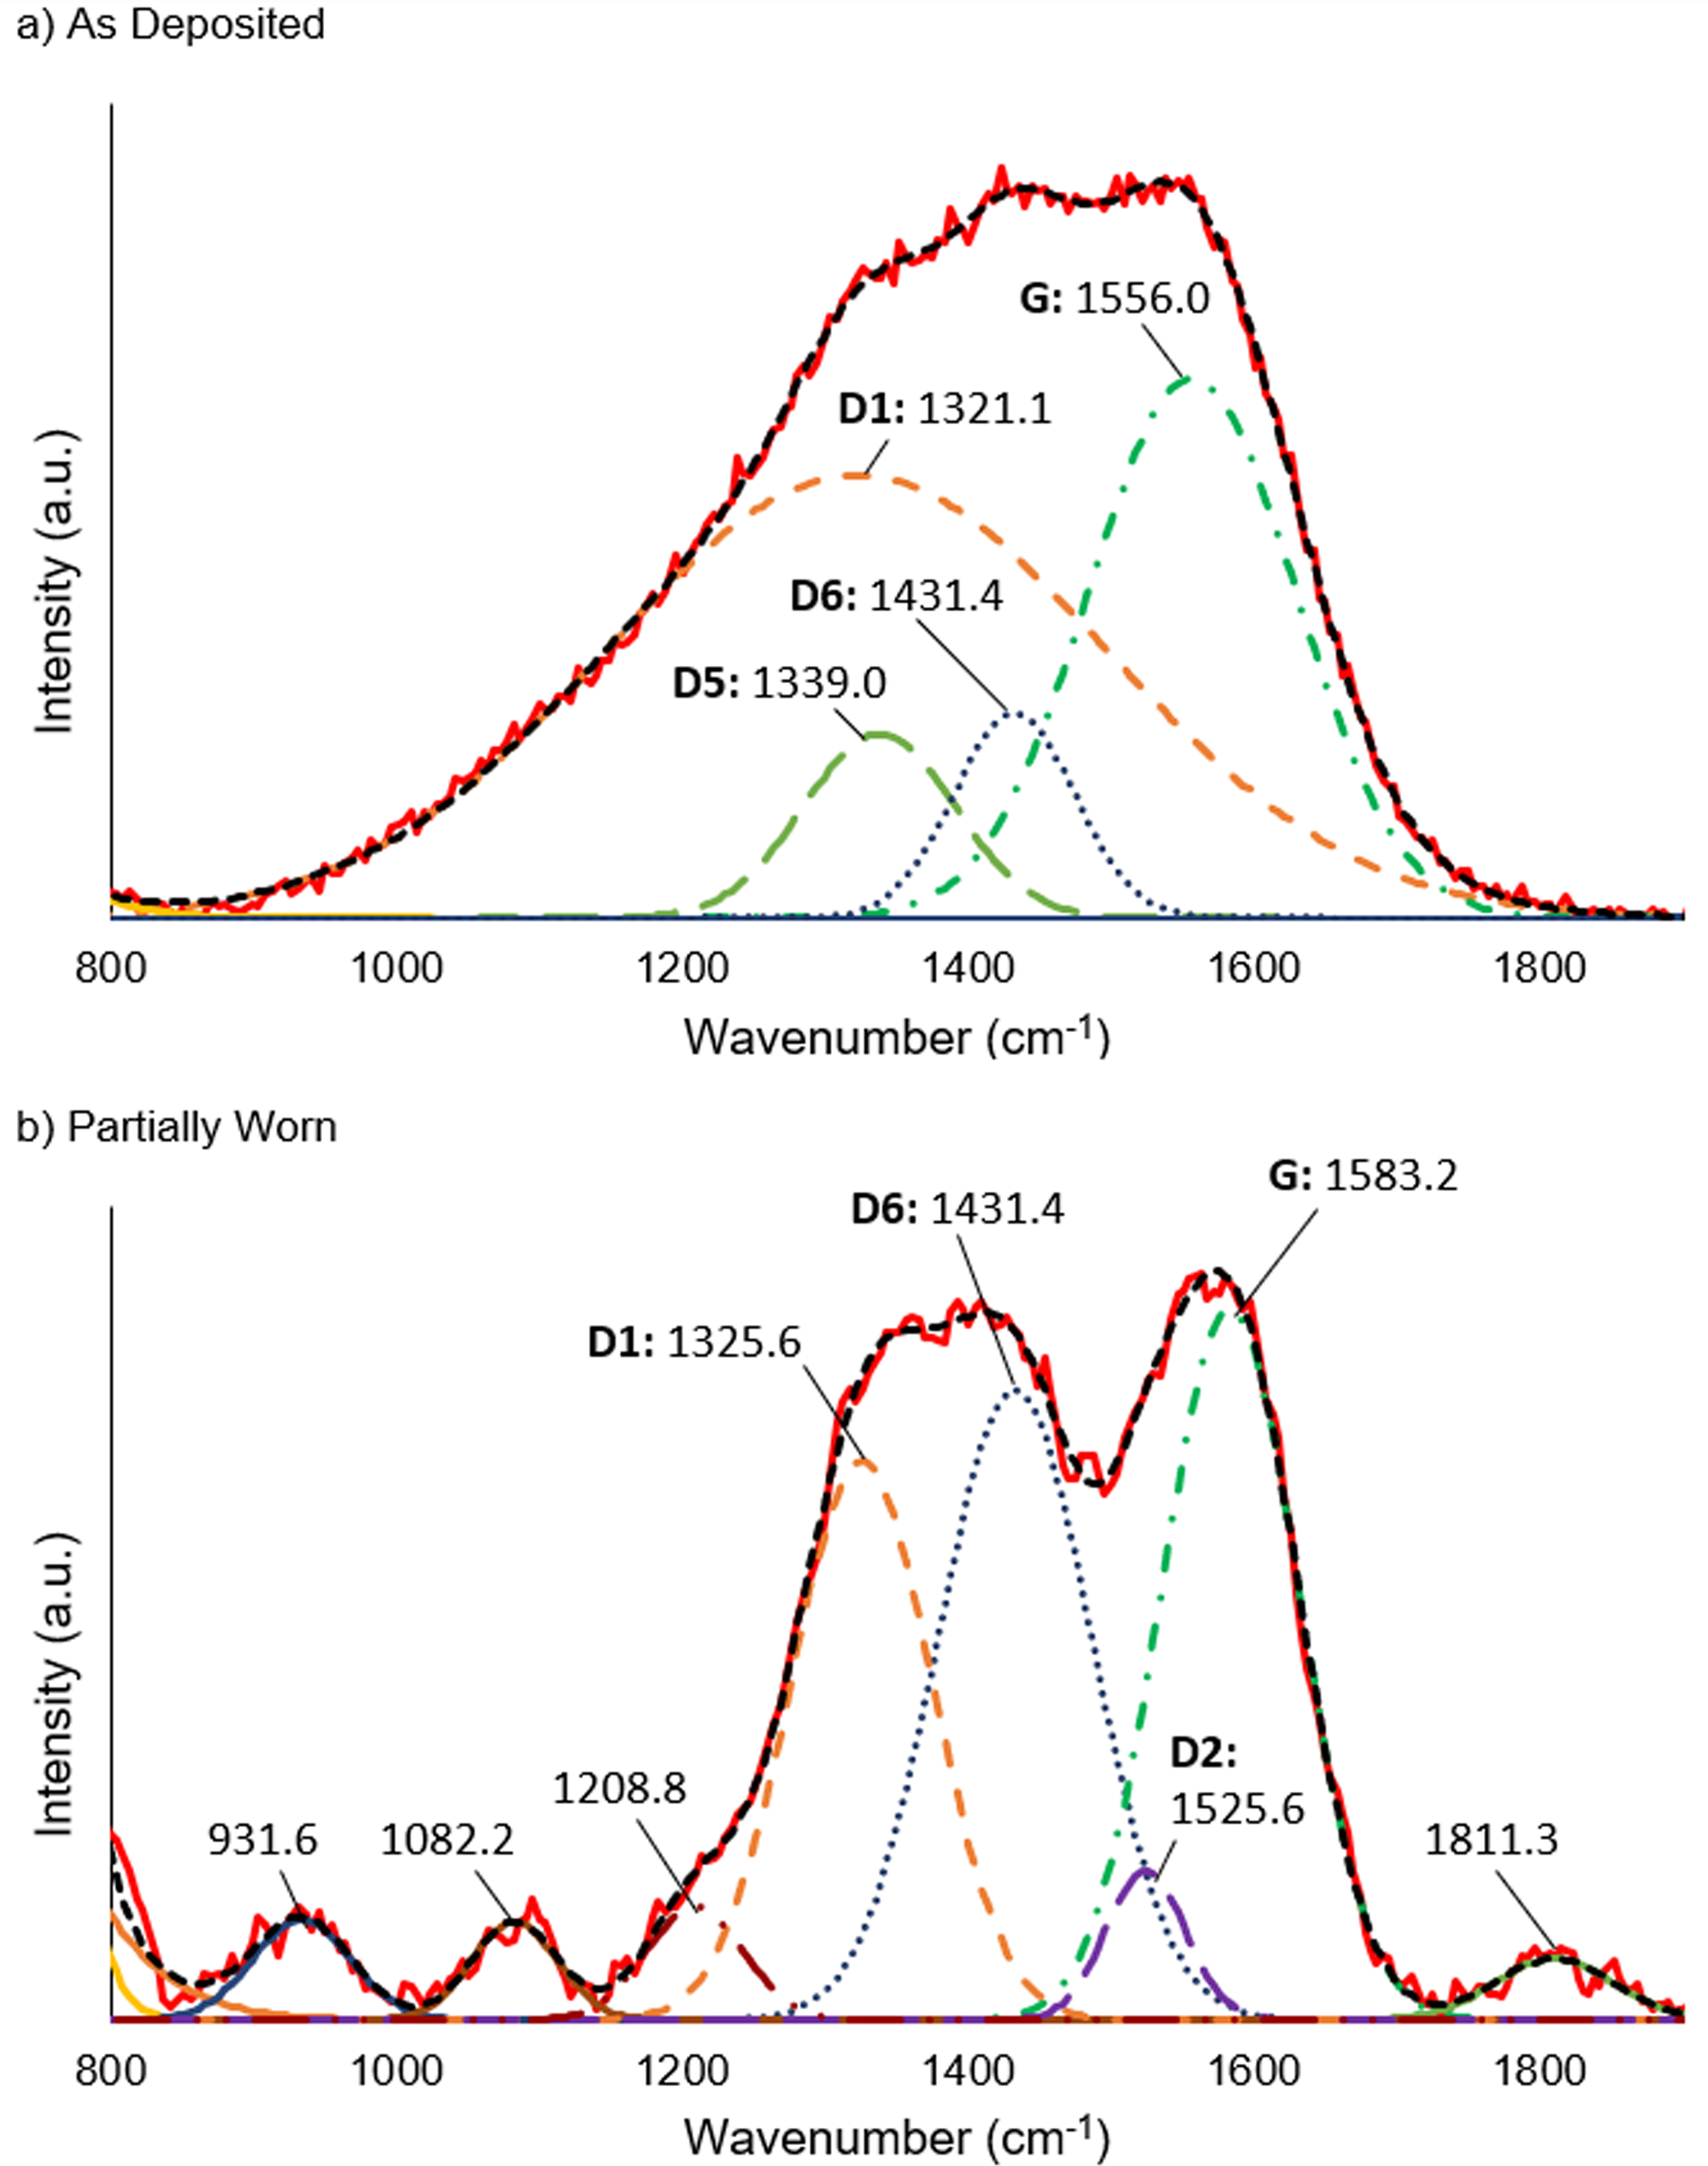
Raman spectra (532 nm excitation) as-deposited and Worn Graphit-iC coating.
The Raman spectra of as-deposited coating material showed no clearly pronounced peaks. A broad multi-peak area in the range of 900–1800 cm−1 was deconvoluted into two main D1 and G peaks. Two additional peaks, typically referred to as disorder region peaks (D5 and D6), were found. 28 The G peak position was at 1556.0 cm−1, whereas the D1 position was 1321.1 cm−1. The ID/IG ratio (considering the peak intensities) was approximately 0.82. This data clearly shows that the disordered carbon coating material corresponds to a mixture of nanocrystalline graphite and amorphous carbon (Stage 2 in the 3-stage model 27 ). The structure is highly disordered with distorted carbon rings and other orders. The prevailing bonding structure consists of sp2 sites, with the maximum sp3 content limited to 20% or lower. These structural properties are typical for sputtered carbon materials.
The Raman spectra taken from the wear scar contained more pronounced D and G bands. However, again in this deconvolution multiple D band peaks were required. The D2 peak hidden in the area of the G peak was also visible. Compared to the as-deposited coating material, the main spectra changes could be summarised as follows:
A significant upward shift of the G peak from 1556.0 to 1583.2 cm−1. A narrower D1 peak. More pronounced additional Dx peaks, particularly D6.
All of these phenomena are connected to the effects of structure ordering.27,28 The D1 and G peak positions, as well as the ID/IG ratio of about 0.78, correspond to a more graphitic structure with predominant sp2 sites. From the Raman spectra analysis, it could be concluded that due to the friction and wear processes, the amorphous carbon structure became more ordered under loading. Thus, there was a third-body low-friction material formed in the tribo-contacting area. Moreover, the EDS analysis proved high content of oxygen in the worn areas, and consequently, the Raman spectra consisted of some specific oxides (iron oxides, chromium oxides, etc.) bonding structures covering a wide variety of wavenumbers. This can be partially seen in Figure 11(b).
Efficiency test results and discussion
During running efficiency testing at room temperature, the no-load losses for both the coated and fluid-lubricated gearboxes were broadly similar, but the load-dependent losses on the coated gears were higher. Under these conditions, the fluid lubrication offered lower tooth friction, whilst the viscosity of the fluids was not sufficient to generate significant drag. Consequently, the coated gears exhibited a slightly lower net efficiency across the load range than the fluid-lubricated gears.
At −40°C, the no-load losses became far more significant and were the dominant source of power loss. Whilst the load-dependent losses of the coated gears were again higher than those of the fluid-lubricated gears, due to the lower no-load losses on the coated gears the net efficiency was higher. The efficiency benefit became smaller with increasing load, and by 40 Nm, the net efficiencies for all three lubrication regimes were roughly equal. Due to the effects of kinematic starvation and inlet shear heating, the increased base oil viscosity within the bearings resulted in a reduction of the M’rr and Msl terms, to the point that the load-dependent losses in the bearings were calculated to be negligible during the tests at −40°C. During the starting efficiency tests, the benefit of the Graphit-iC coated gears was even more pronounced. The no-load losses formed a more significant proportion of the overall losses for the fluid-lubricated gears; hence a net efficiency benefit was maintained over the entire range of output loads tested. The net efficiencies are plotted against output load in Figure 12. Figure 13 provides a breakdown of the different sources of power loss at discrete torque loads for each lubricant.
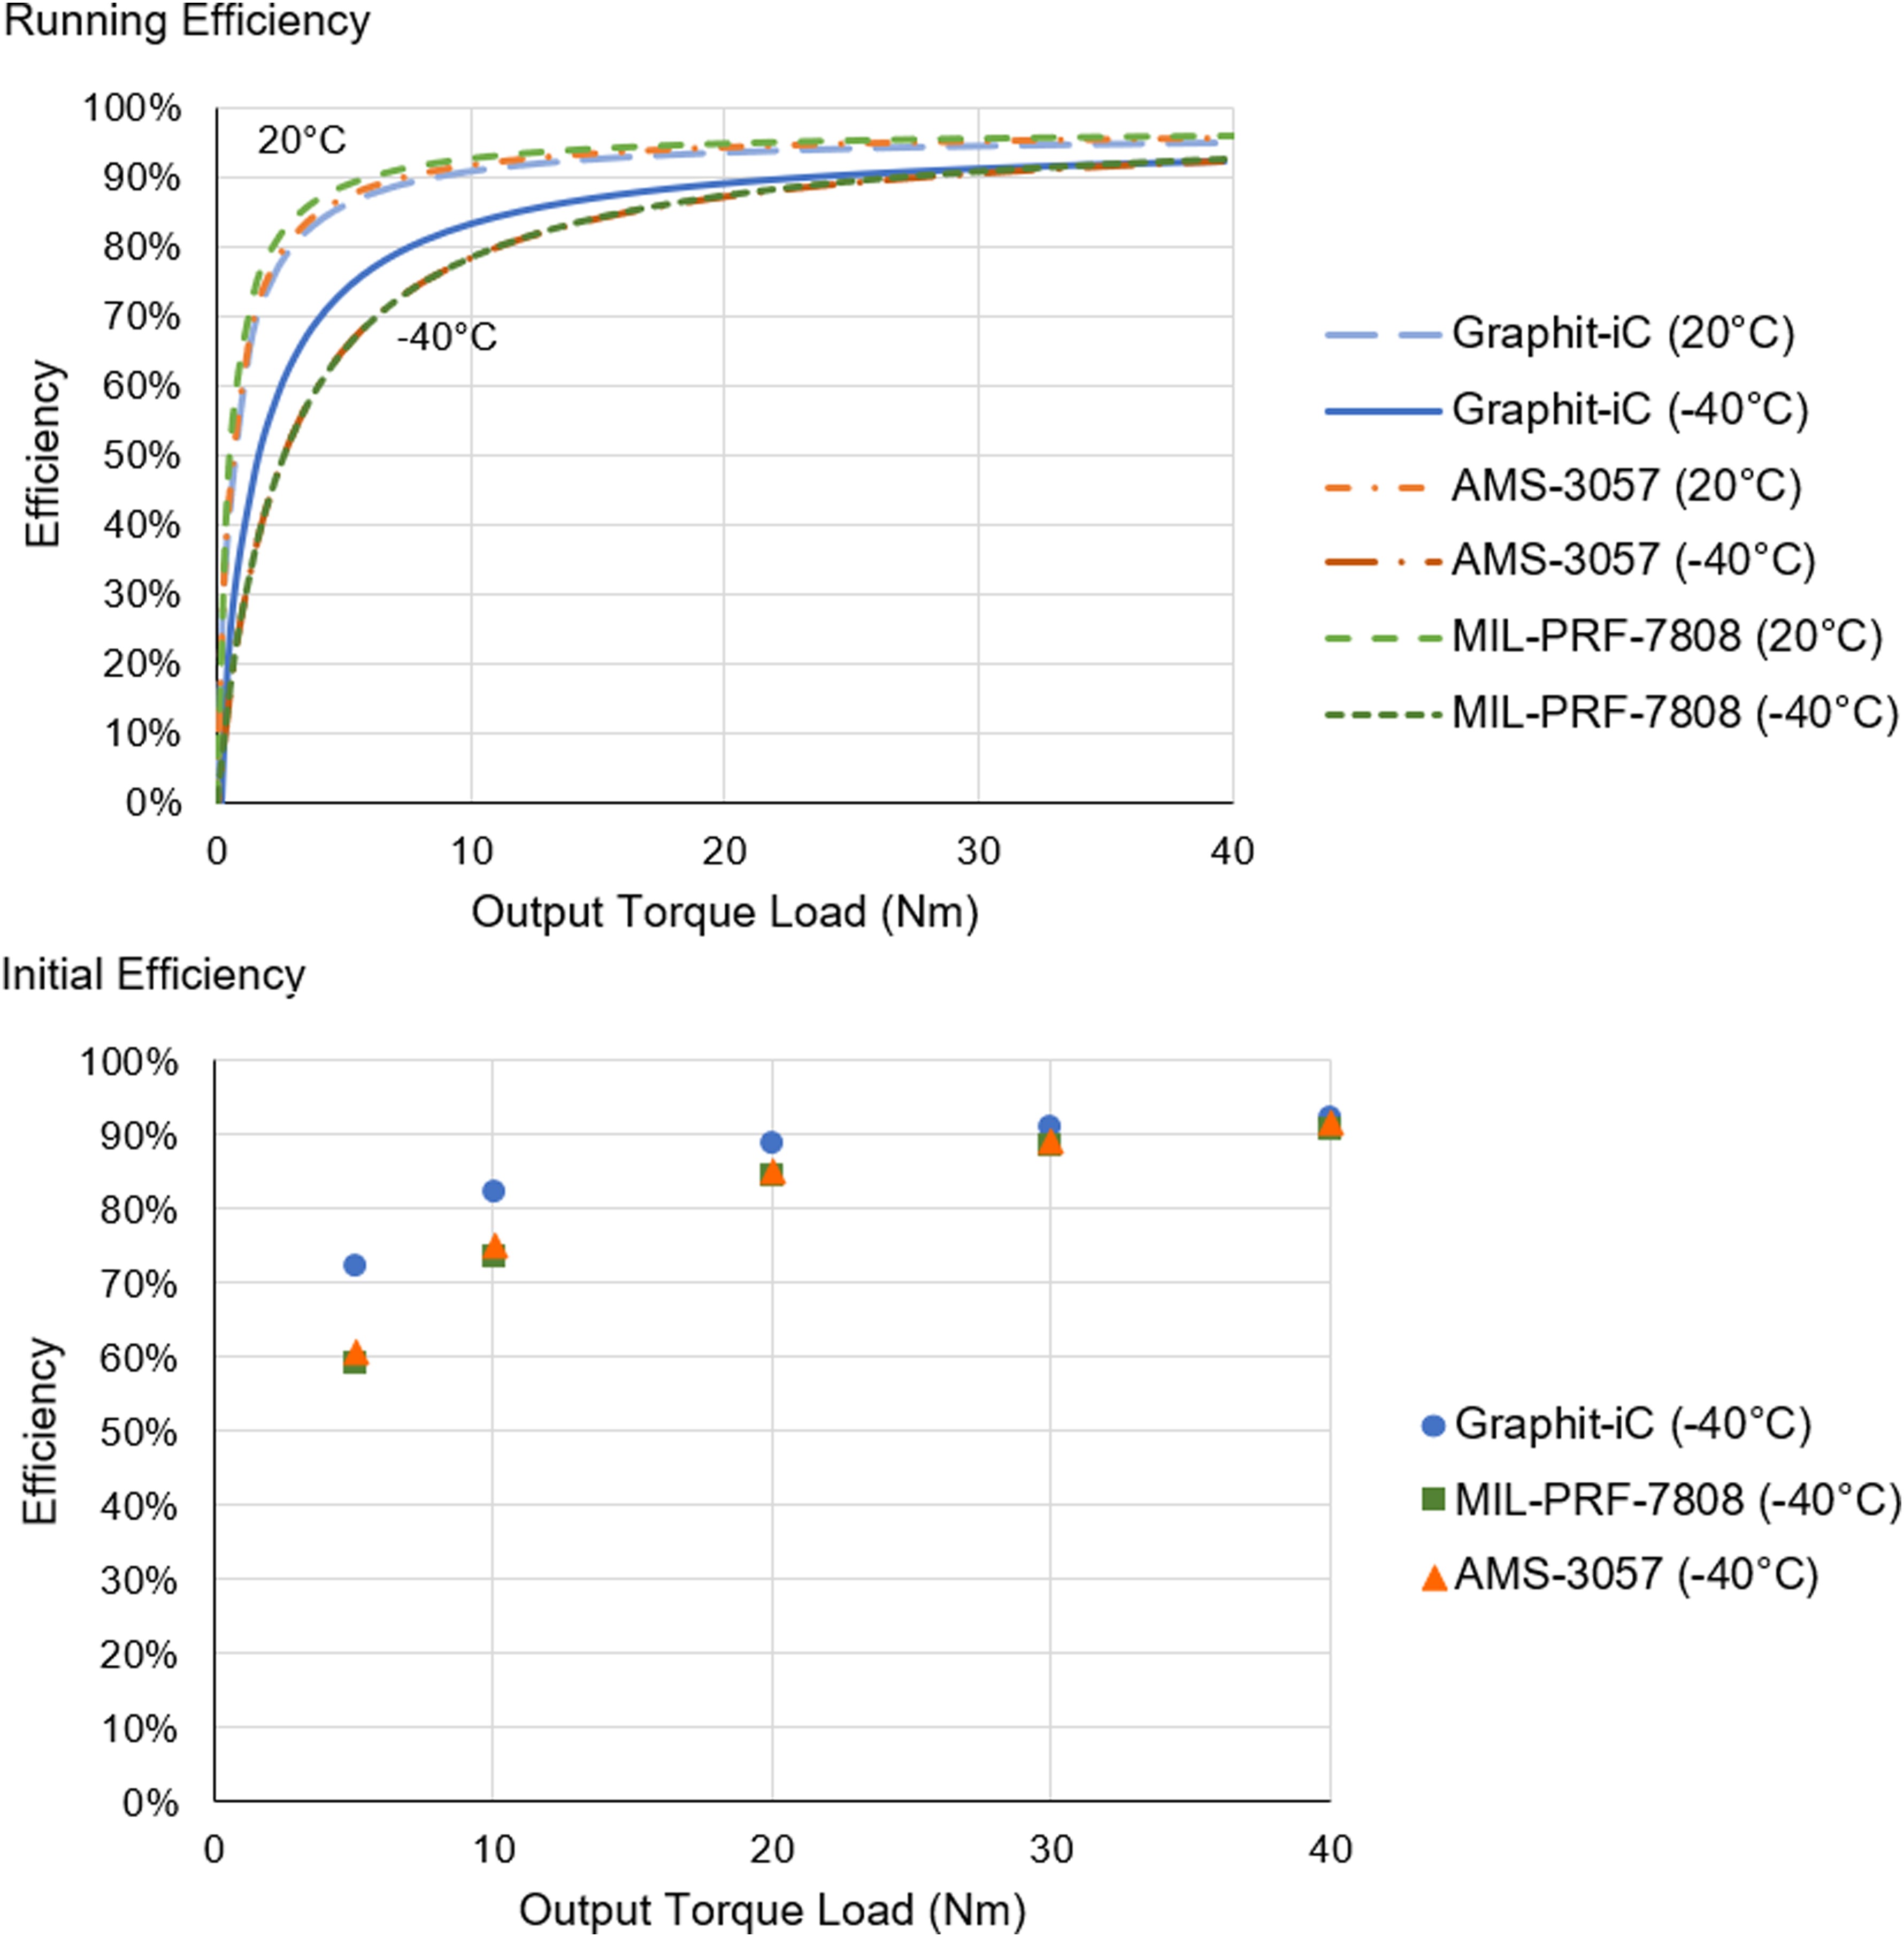
Efficiency curves for dry-coated and conventionally lubricated gears.
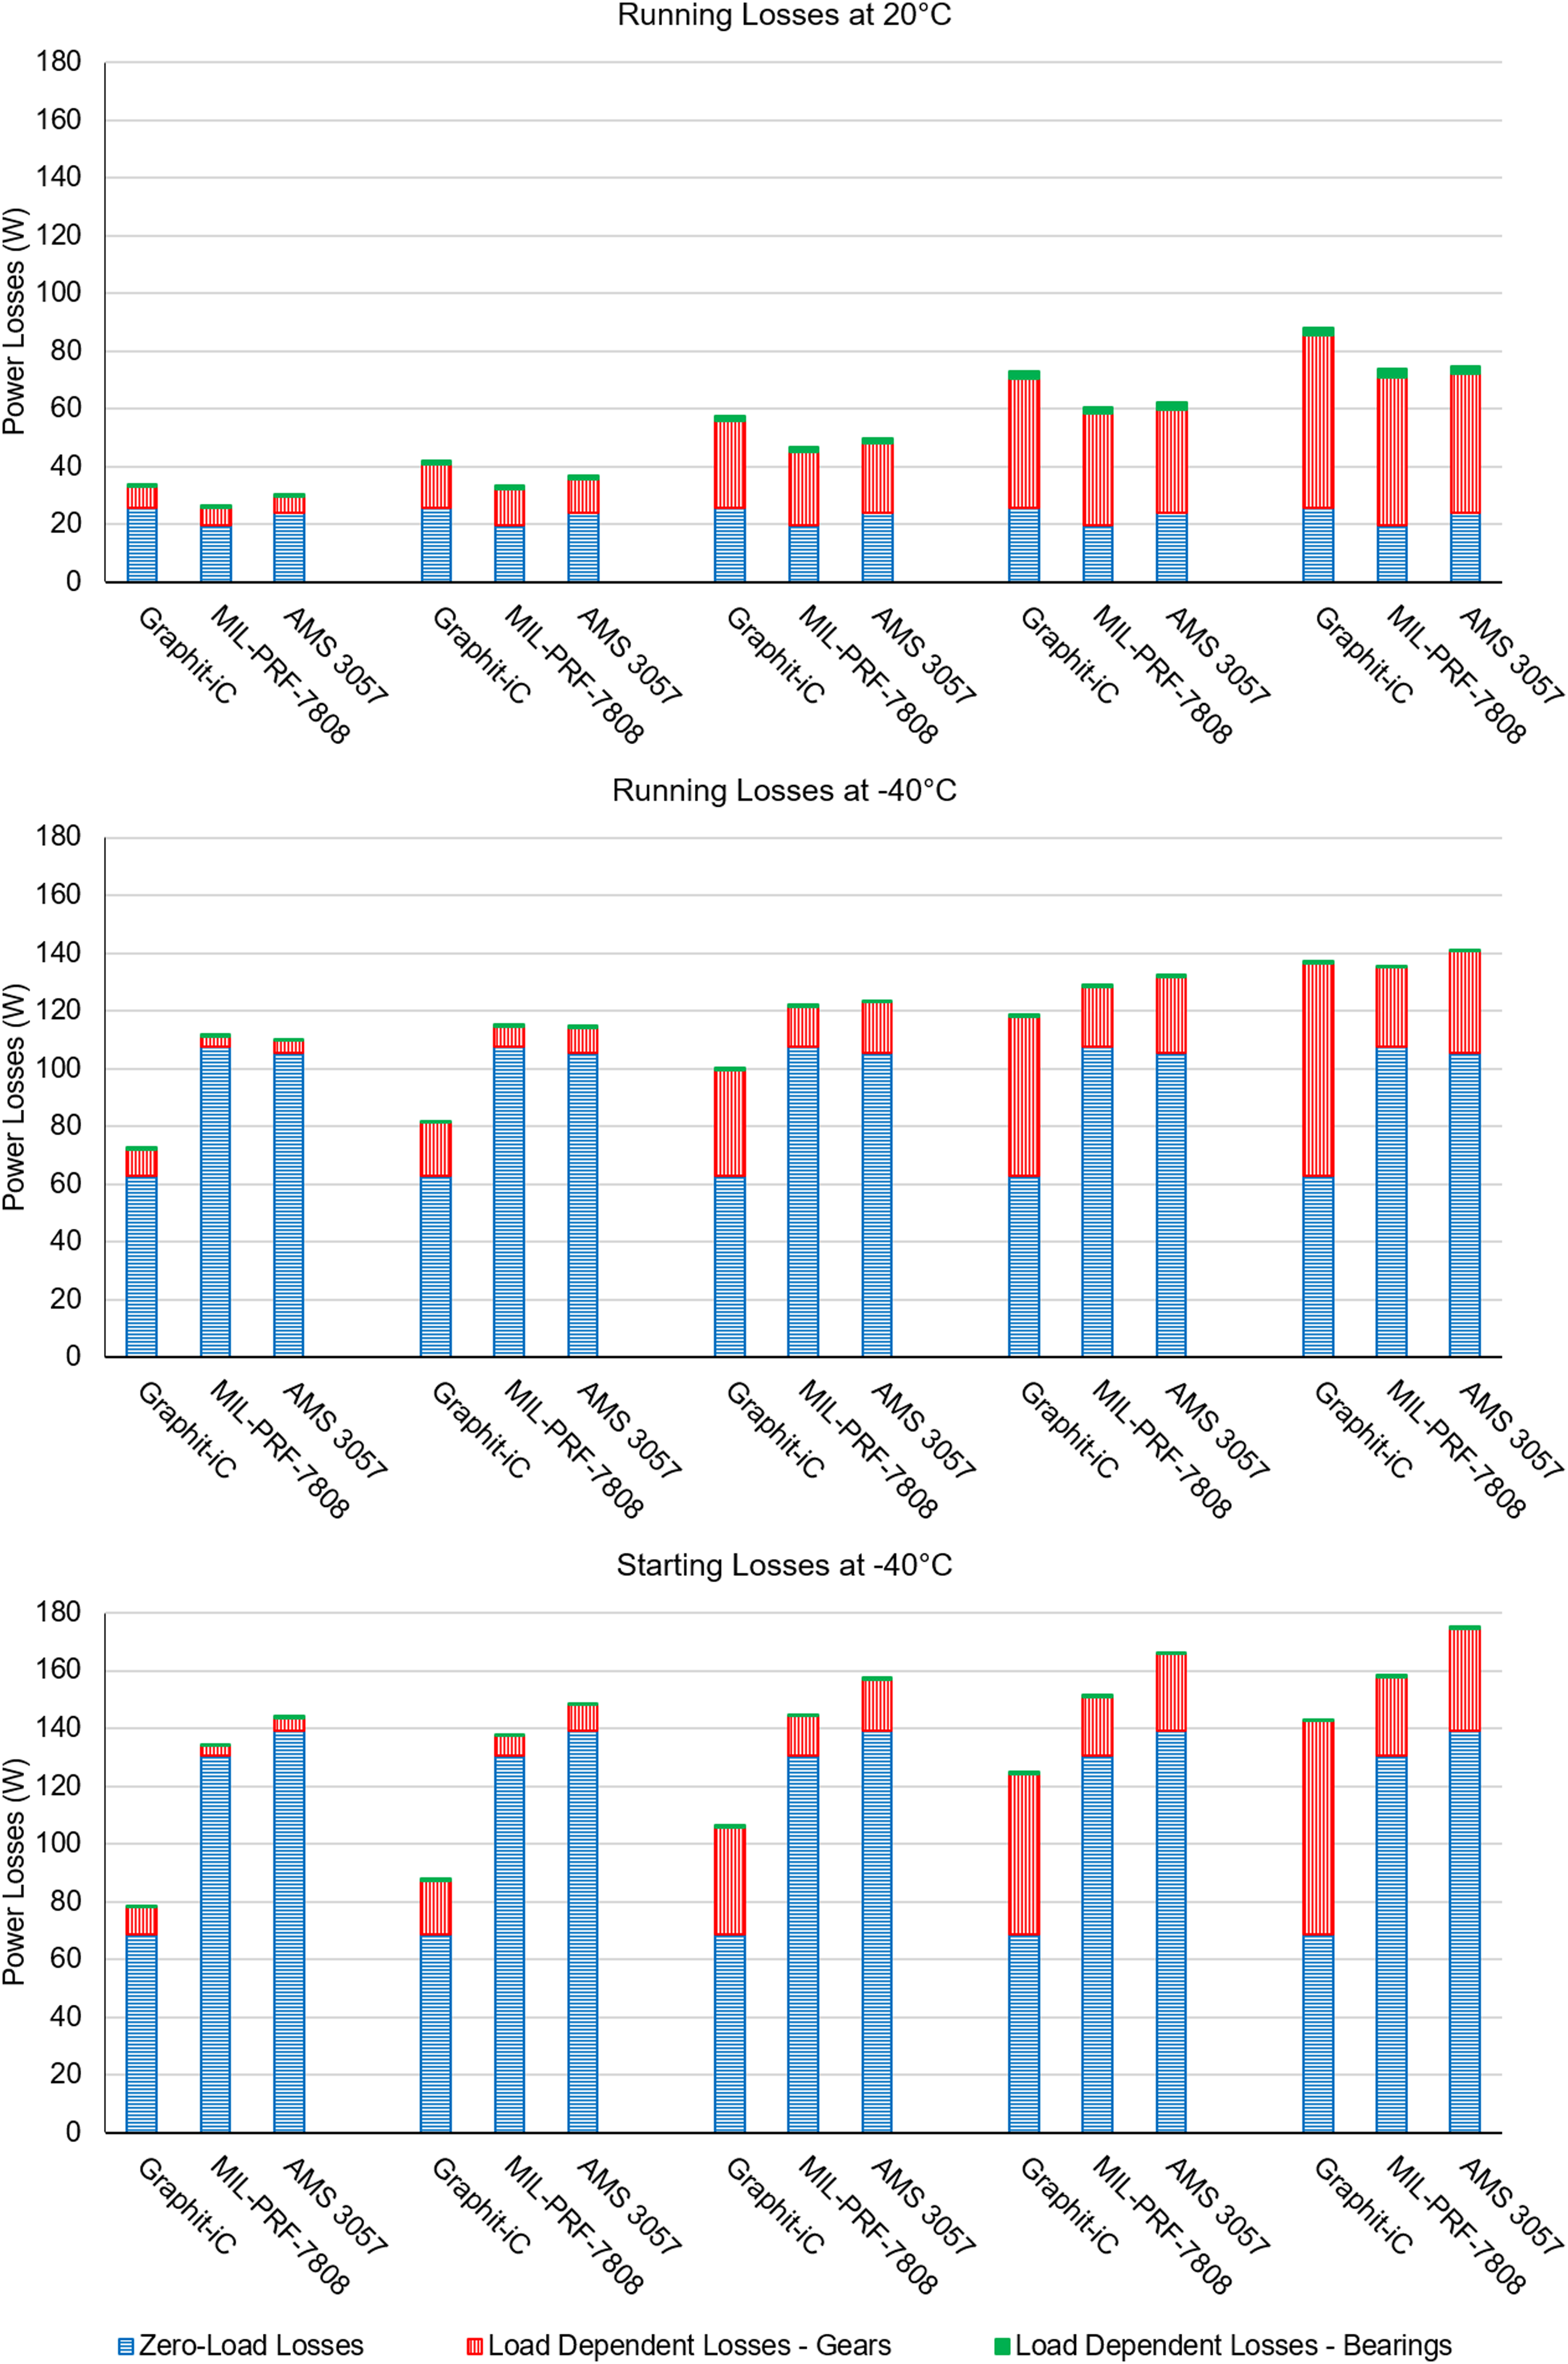
Power loss contributions.
Both fluid lubricants exhibited lower coefficients of tooth friction at low temperature, with the lowest values being achieved for MIL-PRF-7808 at −40°C. This behaviour is consistent with greater film thicknesses due to increased lubricant viscosity, and a transition from a boundary or mixed lubrication regime towards a hydrodynamic regime. For the Graphit-iC lubricated gears, this relationship was inverted, with the coefficient of friction increasing at −40°C by up to 16.4%. Similar behaviour has been observed in other studies 30 and has been attributed to the inhibition of the transfer film formation and graphitisation processes. Graphitisation can occur due to high flash temperatures generated by friction in the sliding contact, or under conditions of high contact or shear stress. 31 The low bulk temperature of the gears in this instance may have prevented the necessary flash temperatures from being achieved and limited the formation of the low shear strength transfer films necessary for optimum friction. Additionally adsorbed water from ice layers formed during the cold soak period may be drawn into the contact by capillary action resulting in additional viscous drag. The coefficients of friction at 20°C and −40°C for 20 Nm torque load are shown in Figure 14. The output torque to load-dependent loss relationship was highly linear in all cases.
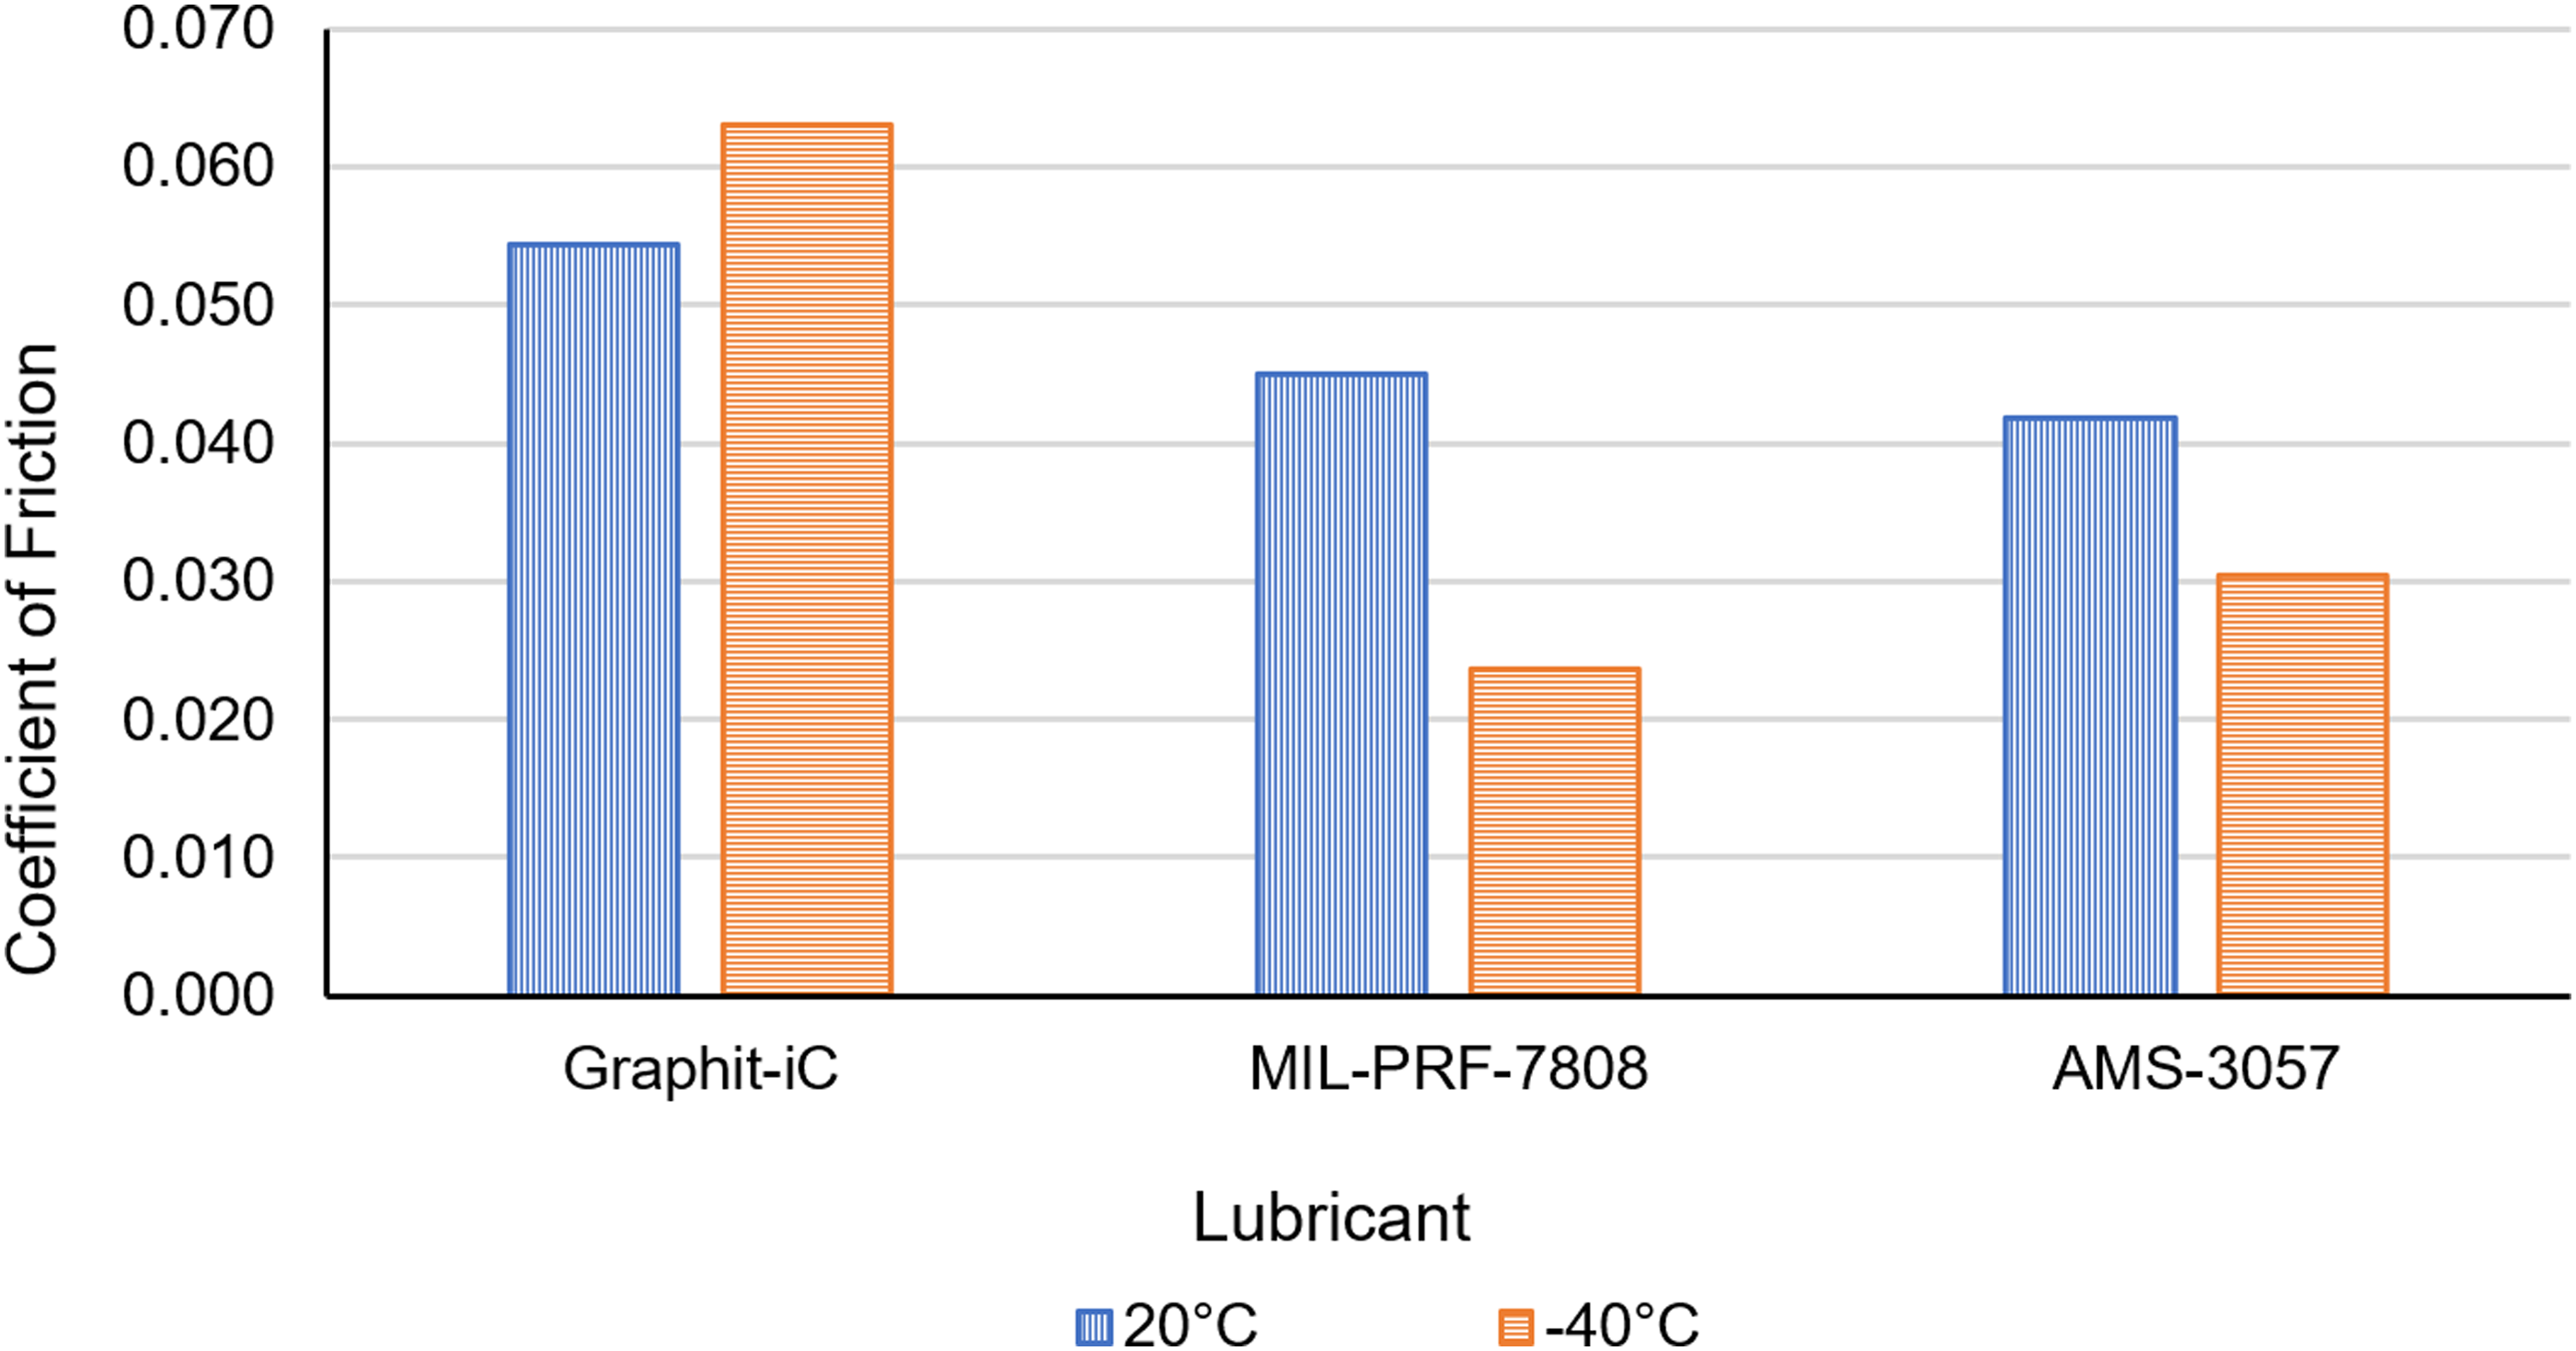
Tooth average coefficients of friction (20 Nm).
Future work
As the most common cause of failure was found to be sliding wear on the mid-addendum, and the extent of this wear is not predicted by the rolling cylinder model, efforts should be made to better understand the contact conditions at this point in the mesh cycle. Dynamically induced variations in tooth loads, and the variations in surface curvature and contact stress across the contact width should be considered, as these are known simplifications of the current model.
In terms of the coating itself, an obvious improvement would be to simply increase the thickness to extend its life. However, increasing the thickness of the coating would also lead to an increase in intrinsic stresses, which may exacerbate the issues with delamination. Therefore, an increase in coating thickness should also be accompanied by measures to improve coating adhesion, whether through changes to the coating interlayer, or improvements to the pre-deposition cleaning procedures. The early delamination of the coating at the SAP could potentially be addressed by the introduction of micro geometric tooth profile modifications, specifically tip relief, to ease the loads at the point of tooth engagement and disengagement. The residual stress state of the applied coating could also be studied to further understand this behaviour and the observation of the small, delaminated pits.
As the efficiency testing showed an increase in tooth friction when tested at low temperature, the implications of low-temperature operation with regard to wear rates also requires further study. Long-term wear testing at low temperature requires a significant increase in test setup complexity and monitoring requirements. However, in order to confirm suitability for aerospace applications any temperature sensitivity with respect to the useful life of the coating needs to be quantified.
Similarly, this study covers operation at a single gearbox speed. Efficiency and wear testing should be expanded to cover a range of speeds to determine any effects on friction or wear performance.
Conclusions
Whilst the tested gears could potentially have continued to operate satisfactorily for a further period following partial coating failure, the useful life of the coating is far less than required for this gearbox in its real-world application. The coating does, however, show potential for military applications where flight cycle requirements are lower, and with improvements, it is possible that the required life could be met. These improvements could consist of increases in coating thickness or adhesion, or optimisation of the gear design to reduce contact stress or sliding.
The primary cause of failure for the coating and operating conditions tested in this study are delamination at the SAP and sliding wear on the addendum for both driven and driving gears.
The results show the value of conducting periodic dimensional inspections during wear testing to understand the evolution of wear distribution to the tooth surfaces. The rolling/sliding cylinder model is a useful tool for calculating the average wear rate of coated gears but requires refinement due to the tendency to underestimate the extent of wear on the addendum.
Adopting a dry lubricated approach may offer a significant benefit to overall efficiency, particularly for gearboxes that are required to operate at low temperatures for brief periods, and where the system starting efficiencies are significant design drivers. The extent of this benefit may be quantified and understood through loaded efficiency testing and isolation of the sources of power loss by calculation.
Footnotes
Acknowledgements
The authors would like to thank Teer Coatings for performing the coating deposition and Collins Aerospace for funding the manufacture of the test rigs and samples.
Declaration of conflicting interests
The authors declared no potential conflicts of interest with respect to the research, authorship, and/or publication of this article.
Funding
The authors disclosed receipt of the following financial support for the research, authorship, and/or publication of this article: This work was supported by the Ministerstvo Školství, Mládeže a Tělovýchovy (grant number CZ.02.1.01/0.0/0.016 026/0008396).