
Abstract
A ferrofluid pocket bearings is a type of hydrostatic bearing that uses a ferrofluid seal to encapsulate a pocket of air to carry a load. Their properties, combining a high stiffness with low (viscous) friction and absence of stick-slip, make them interesting for applications that require fast and high precision positioning. Knowledge on the exact performance of these types of bearings is up to now not available. This article presents a method to model the load carrying capacity and normal stiffness characteristics of this type of bearings. Required for this is the geometry of the bearing, the shape of the magnetic field and the magnetization strength of the fluid. This method is experimentally validated and is shown to be correct for describing the load and stiffness characteristics of any fixed shape of ferrofluid pocket bearing.
Introduction
As man began to explore space, it became relevant to develop efficient techniques to use and store rocket engine propellants under zero gravity conditions. For this reason, the NASA Research Center developed in the 1960s a kerosene-based magnetic fluid that could be collected at a desired location by the use of a magnetic field. 1 This magnetic fluid consisted of a stable colloidal suspension of tiny magnetic particles (∼10 nm) providing the fluid with paramagnetic properties. 2 Rosensweig continued the research into these so-called ferrofluids and showed in the early 1970s that these fluids might also be interesting for the usage in seals and bearings.3,4 Pressure builds up in the fluid because the magnetic particles are attracted by a magnetic field. This pressure can be used to develop a force to carry a load or to seal a volume. Compared to other bearing concepts, the ferrofluid bearings are an easy way to create a low friction movement that is free of stick-slip.5–9 The bearing is furthermore inherently stable due to the use of permanent magnets. The magnetic field of these magnets can additionally be used for Lorentz actuation.10–16 The overall specifications presented in literature show that the bearing is particularly interesting for low load applications that require fast and high precision positioning. Examples of possible applications are microscopy, wafer/chip inspection and pick and place machines. The low vapour pressure ferrofluids are suitable for vacuum conditions and even application in a zero gravity environment is possible since the ferrofluid is kept in place by the magnetic field.
Two types of planar ferrofluid bearings can be distinguished. The first type is a ferrofluid pressure bearing that uses solely the magnetic pressure to carry a load.17–19 The second category is a ferrofluid pocket bearing that enhances the load carrying capacity of an air pocket (or any other non-magnetic fluid), which is encapsulated and pressurized by a surrounding ferrofluid seal.3,20,21 A simple example of this bearing concept is given in Figure 1. The planar ferrofluid bearing can be seen as a sort of hydrostatic bearing meaning that it does not need a relative movement between bearing faces to create a pressure field. Though the working principles are fundamentally different from the hydrostatic bearings of literature22–25 that uses the magnetorheological effect and a pressure source to create a pressure field.
Ferrofluid is applied to a disc-shaped magnet with axial magnetization and placed on a ferromagnetic surface. The ferrofluid collects at the circumference of the magnet where the magnetic field strength is highest (Figure 2). A bearing is built by placing a surface on top of this configuration such that a pocket of air is encapsulated (Figure 3). The ring of ferrofluid functions as a seal that captures the air inside. The magnetic field of this magnet is shown in Figure 2.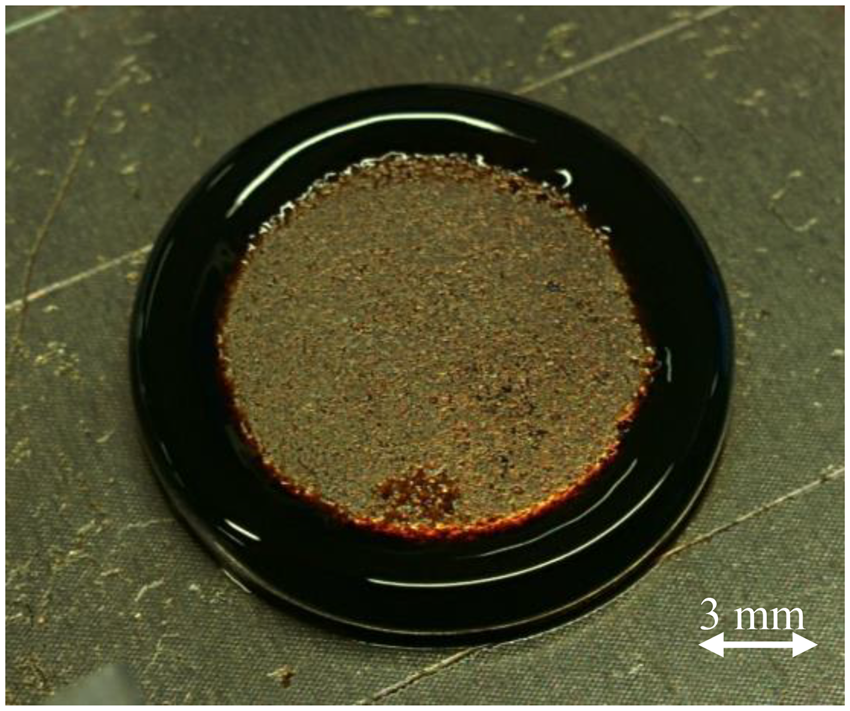
The tribological performance of the planar ferrofluid bearing is, despite its potential, barely discussed in literature. This is completely opposite to the performance of the hydrodynamic journal bearing lubricated with ferrofluid that has received significant attention recently.26–33
A problem experienced in these types of bearings is that there are no mathematical models available yet that describe the load and stiffness characteristics; the designer interested in using these bearing has limited information available on how to dimension the bearing to achieve certain specifications. All literature describing these bearings lacks the link between the measured performance and a theoretical model. 20
Another problem seen in these bearings is the poor repeatability in fly height.13,14 The fly height is reduced during translation because of the trail formation that results in a smaller amount of fluid to be available for levitation. In the case of a pocket bearing, this might even cause air to escape from the encapsulated pocket of air resulting in a permanent change in fly height. In Café 12 and Lampaert et al., 15 the absence of a mathematical model to describe this effect accurately is mitigated in the presented positioning system by adding a control loop that controls the fly height of the bearing. This decision introduces extra actuators, sensors and therefore complexity in the system, which might take away the benefit of being low cost and simple. More knowledge on how the load and stiffness of this type of bearing is created might give more insight in how the trail formation affects the fly height of the bearing.
In this article, a method is presented to predict the load and stiffness characteristics of a ferrofluid pocket bearing. A model is derived using this method that is then validated with an experimental setup. The resulting knowledge can be used to understand how a ferrofluid bearing should be designed to meet the desired load and stiffness specifications.
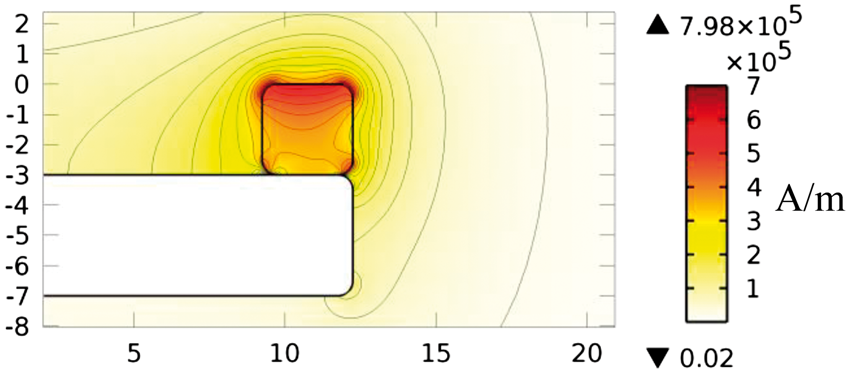
The magnetic field is highest at the corners of the magnet as shown here in a cross section of the configuration presented in Figure 1. The calculation is done with a remanent flux density of the magnet of 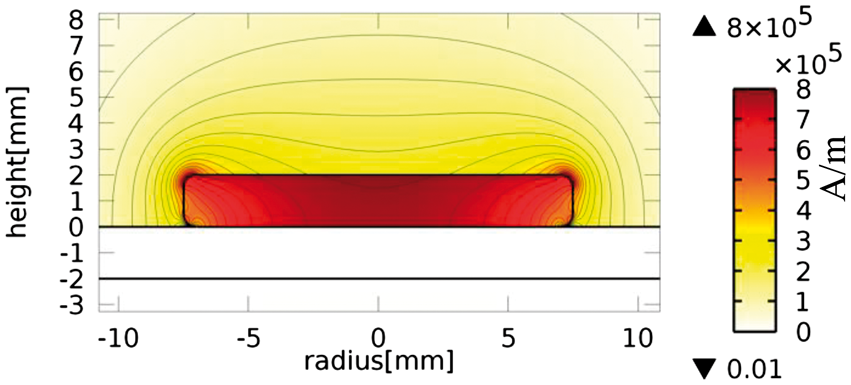
Methods
In this section, the derivation of the mathematical model of the ferrofluid pocket bearing is explained and validated. The validation is divided into three parts. The maximum load carrying capacity, the load carrying capacity as a function of the fly height and the bearing stiffness are validated.
Mathematical model
In the following section, the method to calculate the load and stiffness specifications of a ferrofluid pocket bearing is derived. It provides the theoretical basis on how the different parameters contribute to the final specifications. This method is not limited to the examples given in Figures 3 and 4 but is valid for all possible shapes of magnets and magnetic fields. The derivation starts from the Navier–Stokes equations for incompressible, Newtonian magnetic fluids.
34
In this formula, the assumption of Newtonian fluids is reasonable for fluids that do not show any particle chain formation (i.e. fluids with a small dipolar interaction parameter
35
).
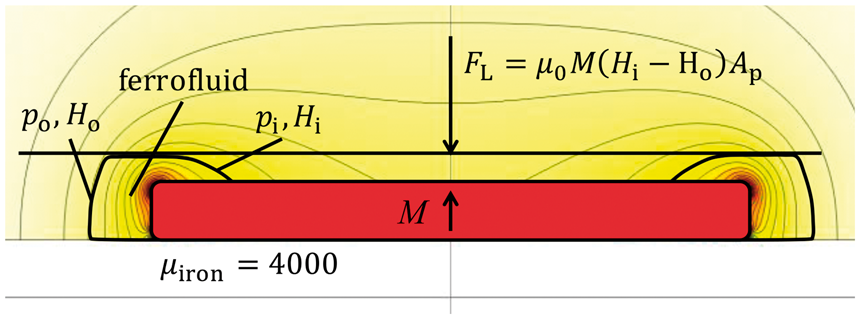
The figure presents a cross section of a disc-shaped magnet to define the parameters used in this article. The inner fluid interface defines Hi and the outer fluid interface defines Ho. A graphical representation of the force development in a pocket bearing. A magnet with ferrofluid is placed on an iron plate with a nonmagnetic plate (black line) on top of the configuration. The contour plot on the background presents the magnetic field intensity. Ferrofluid is added and attracted to the corners due to highest field intensity there. The pressure difference across the ferrofluid seal is proportional to the difference in magnetic field intensity across the seal 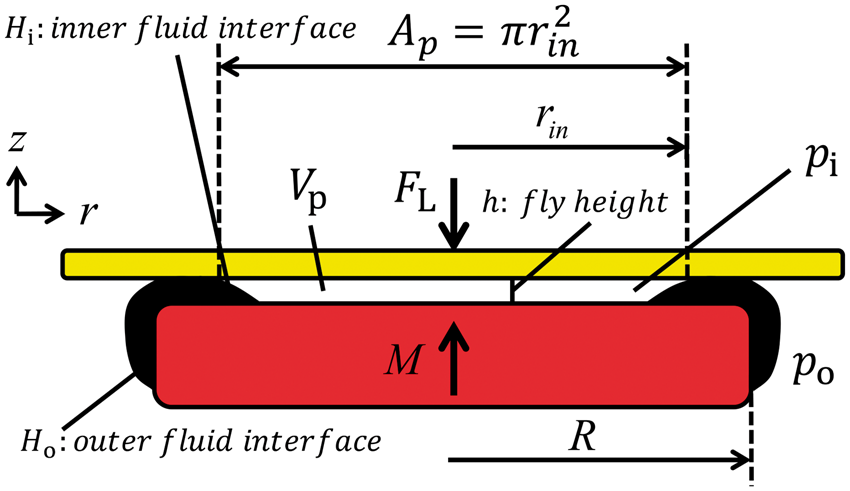

In this relation, the density is represented by ρ, the viscosity is represented by η and the magnetic permeability of vacuum is represented by

In general, the magnetization strength M of the ferrofluid is a function of the magnetic field, but can be assumed to be constant and equal to the saturation magnetization of the fluid when the fluid is subjected to a magnetic field larger than that saturation magnetization. Furthermore, when the magnetic field is much larger than the saturation magnetization of the fluid, it can be assumed that the magnetic field is unaffected by the presence of the ferrofluid. The low relative permeability of the fluid ensures furthermore that considering the magnetic behaviour, the fluid does not behave much differently than air. Typical magnetic fluids have a relative permeability
For a ferrofluid pocket bearing primarily the pressure difference across the seal

The magnetic field at the inner fluid interface is equal to Hi and the magnetic field at the outer fluid interface is equal to

The normal stiffness of the bearing

Relation (equation (5)) implies that an increase in force, and the related increase of pressure, causes the ferrofluid interfaces to move outwards causing an increased counteracting pressure across the seal and an increased surface area for the force. The increase in surface area can be assumed to be negligible for a typical bearing design. Applying this assumption and combining relation (equation (5)) with (equation (3)) yields:

The change of magnetic field difference

The relation Graphical representation of the pneumatic leverage showing that a small displacement of h results in a large displacement in 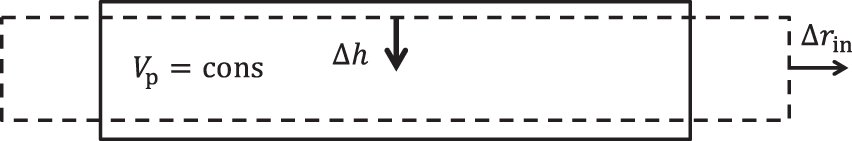
The pneumatic leverage can, in the case of a cylindrical shaped incompressible pocket, be described with relation (equation (8)). Figure 6 shows the magnitude of the pneumatic leverage for different initial fly heights and fixed bearing radii. The figure shows that the pneumatic leverage can in general be assumed to be constant for small compression ratios.
The figure presents the modelled pneumatic leverage for different initial gap heights and a fixed radius of rin = 10.5 mm. The compression is a measure for how much the height is decreased for achieving the pneumatic leverage. A positive compression means a decrease in fly height.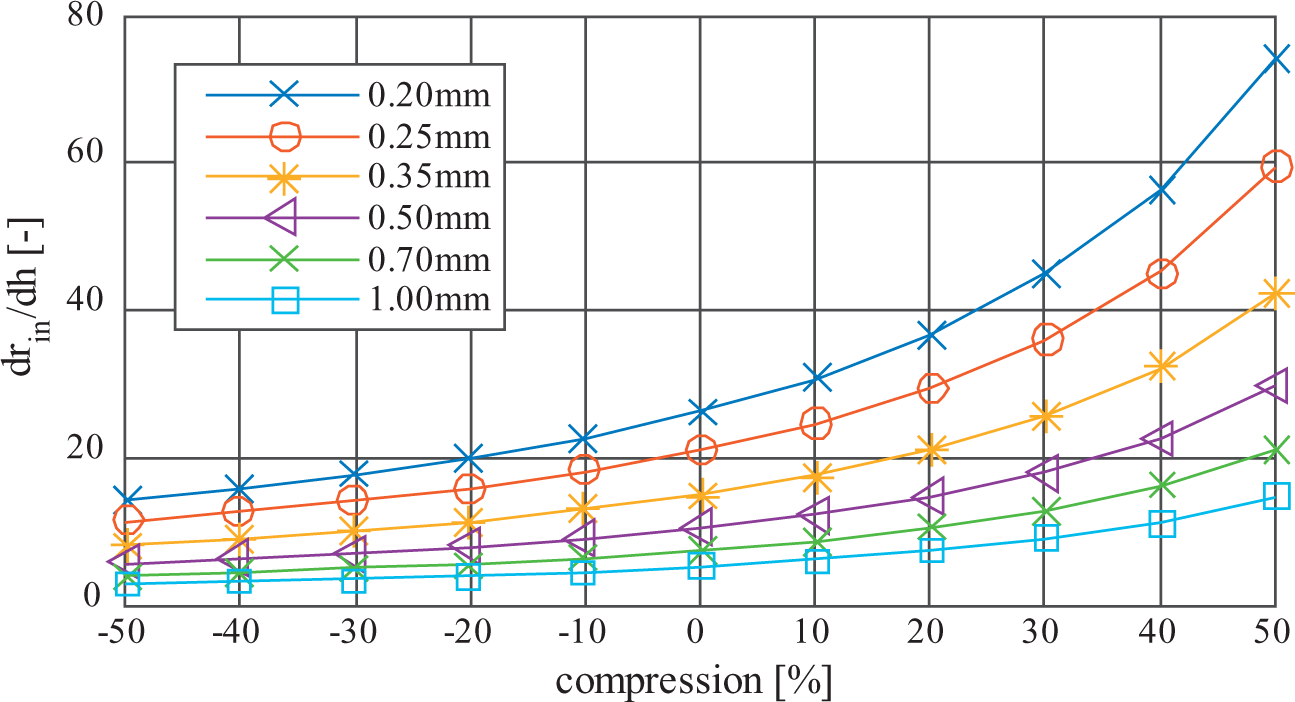

In the case of a ring-shaped pocket bearing, the air stiffness can be modelled as the stiffness of a pneumatic cylinder. That is given with the following relation at which

The stiffness of the encapsulated pocket of air can be seen as a stiffness that is in series with the stiffness of the ferrofluid seal. The total stiffness of the system can then be described to be

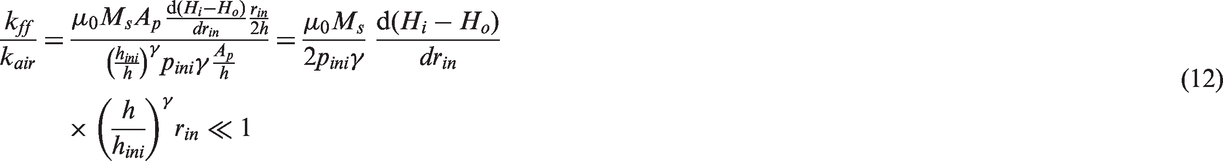
The effect of the air stiffness can be assumed to be negligible when it is much larger than the seal stiffness.

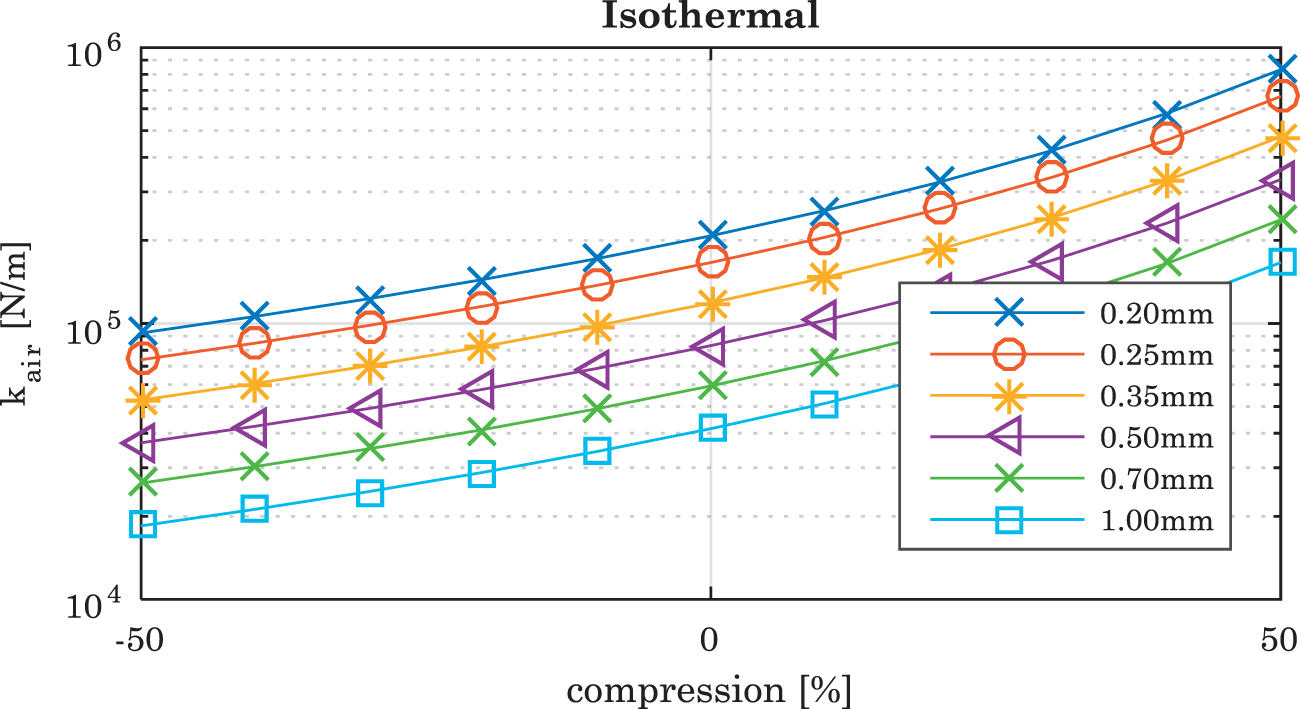
Figures 7 and 8 give some examples of the stiffness values for some different bearing sizes. From the graph, it can be seen that the stiffness increases for smaller gap heights. The figures also illustrate that the stiffness of the bearing is dependent on whether there is an adiabatic or isothermal situation. In general, the stiffness at low frequencies will behave isothermally and stiffness at high frequencies will behave adiabatically.
The modelled adiabatic stiffness of an air filled cylinder with different initial gap heights and a fixed radius of rin = 10.5 mm. The graph shows that the air pocket is stiffer for decreasing fly height. At zero compression, the pressure condition is The modelled isothermal stiffness of an air filled cylinder with different initial gap heights and a fixed radius of rin = 10.5 mm. The graph shows that the air pocket is stiffer for decreasing fly height. At zero compression, the pressure condition is 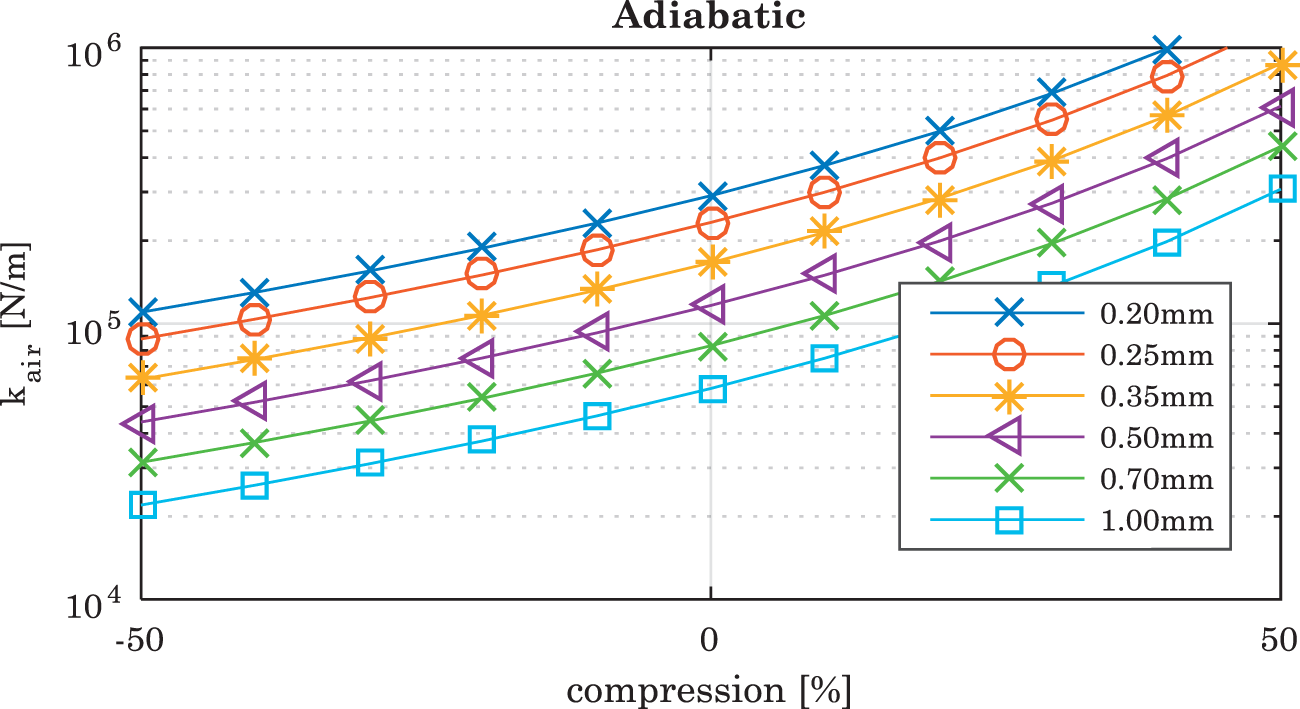
Experimental setup for validation
Experiments are performed to investigate whether the derived mathematical models describe the load and stiffness characteristics of this bearing correctly. The validation is realised by comparing the performances predicted by the theory with the results of experiments. The required input parameters are the geometrical dimensions of the setup and the shape and strength of the magnetic field.
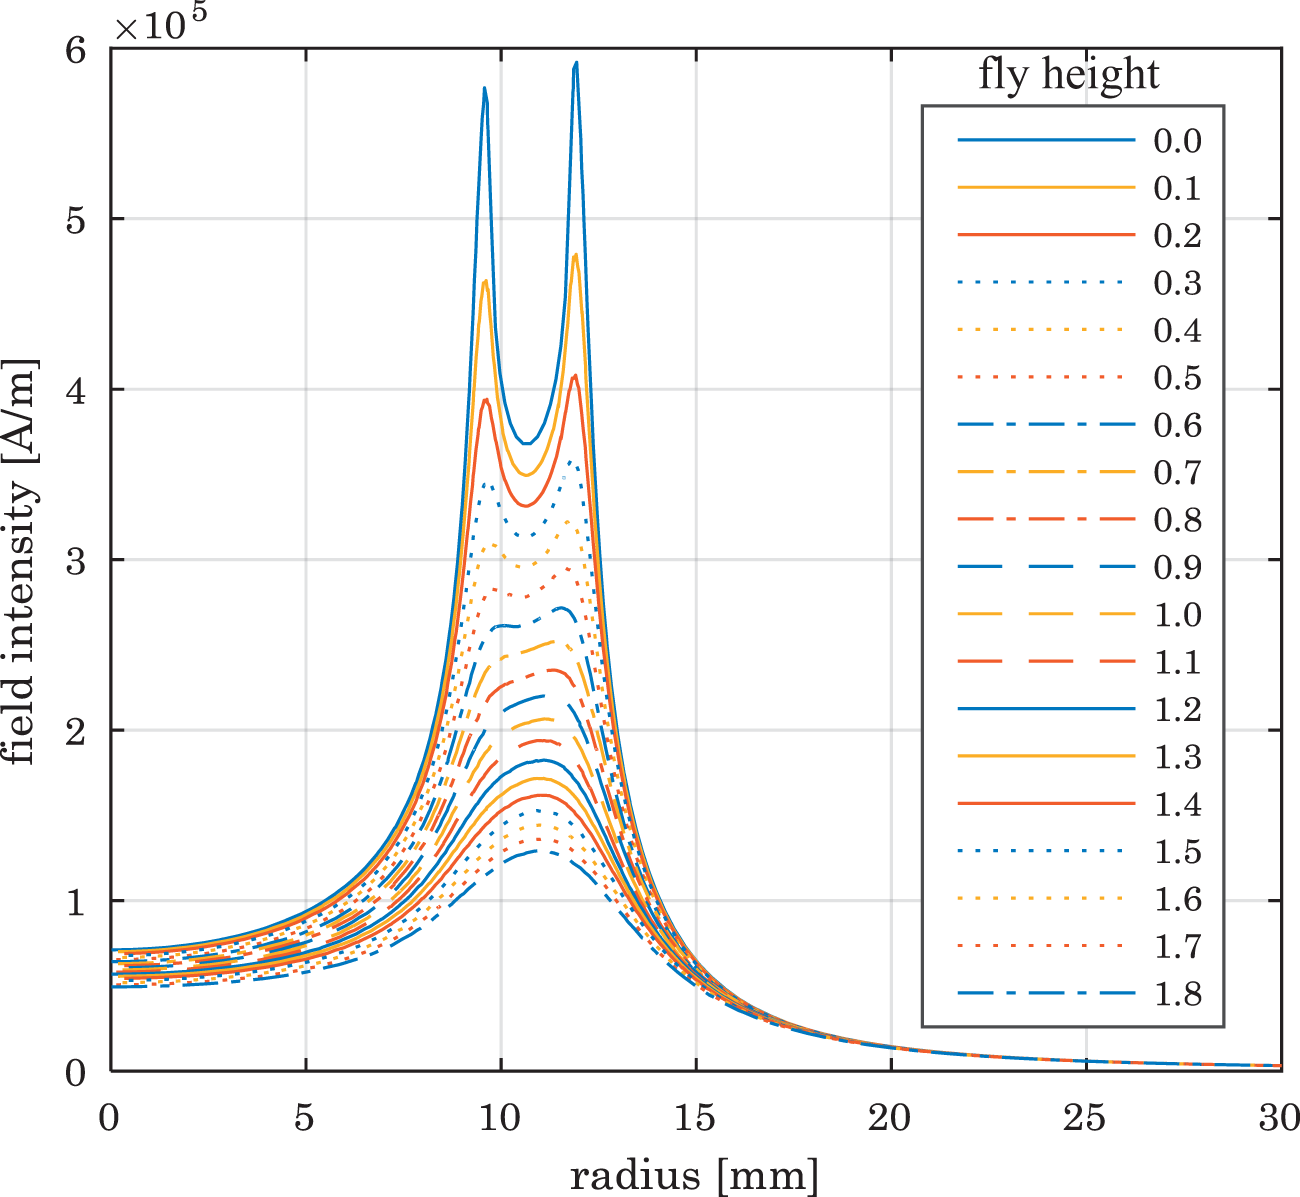
The measurement data are obtained by pressing the bearing onto a surface using a tensile test bench that is able to measure the force over the displacement (Figure 9). The setup has a relative force accuracy of The ring magnet is placed on a steel adapter and magnetic fluid is added to the configuration. The core of the magnet is filled with an aluminium disc to reduce the volume of the air pocket and so create higher stiffness. A tensile testing machine is used to measure the force-displacement curves by pressing this configuration onto a surface. The stiffness of the setup is about ksetup = 3 × 10⁶ N/m. This figure presents the modelled magnetic field and the isolines of the bearing configuration used in the pocket bearing experiment. The ring magnet is placed on top of a steel body with a relative permeability of The modelled magnetic field intensity at different fly heights (in mm) as function of the radius for a ring-shaped magnet with the dimensions of (24.5 mm × 18.5 mm × 3 mm) and a remanent flux density of Br = 1.17 T. The outer peak of the magnetic field is defining the relevant magnetic field for the load capacity since this has the highest magnitude. The relevant magnetic field intensities at the inner and outer fluid interfaces can be read from this figure.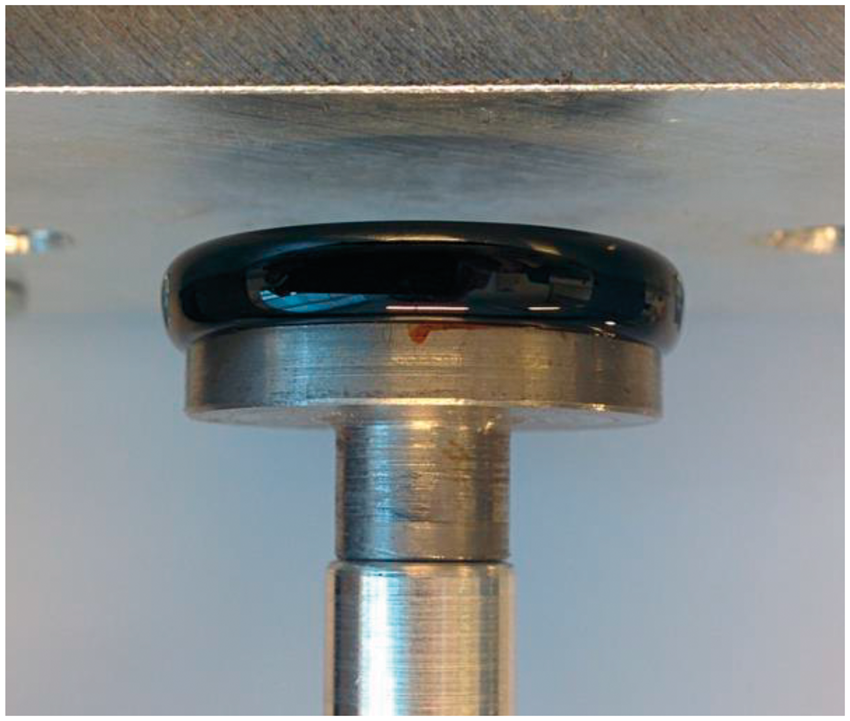
The process for validating the maximum load capacity of this bearing (equation (4)) is divided into four steps. The first step is to apply a specified amount of ferrofluid on the magnet after which the fluid will flow according to the magnetic field and form a uniform ring. The second step is to move the bearing to a point where it is just touching the opposing surface. A pocket of air is now encapsulated by a seal of ferrofluid. The magnetic field intensity at the inner fluid interface is the same as the magnetic field intensity at the outer fluid interface
The third step is to compress the bearing resulting air to leak out of the seal, since there is no ability to develop a counteracting pressure over the seal. The bearing is now at a lower fly height where the magnetic field intensity at the inner fluid interface now differs from the magnetic field intensity at the outer fluid interface
The fourth step is to decrease the fly height even more. This causes air to escape and causes the magnetic field intensity at the inner fluid interface to increase even further. Now an even larger difference in pressure across the seal has developed and results in an even higher load capacity.
Decreasing the fly height of the bearing in this way increases the magnetic field intensity at the inner fluid interface while the magnetic field intensity at the outer interface stays more or less the same. The inner fluid interface is located at a peak of field intensity (Figure 11) along the whole curve of maximum load capacity of this bearing.
The maximum load capacity of the bearing is calculated by determining the pressure build-up across the seal that is defined by the relevant magnetic field intensities at the inner and outer fluid interfaces of the seal. These values can be read from Figure 11 that presents the field intensity as a function of the radius for different fly heights. The field intensity at the outer fluid interface when there is no contact between the bearing faces is derived by comparing the location of the outer fluid interface with the isolines of Figure 10. When the load is increased further, the outer fluid interface will move outwards to a location with lower magnetic field intensity during the measurement. This is taken into account by the model, by a linear interpolation of these two values. The direct load contribution of the seal itself also has been taken into account in the model by averaging the magnetic field intensity over the surface area of the seal. Relation (equation (4)) is now extended to the following relation:

For the stiffness, two different expressions are mentioned in this article (relation (equation (6)) and (equation (7)) that are both validated individually. Relation (equation (6)) is validated by analysing the stiffness of the bearing between two points on the load curve generated by decompressing the bearing. To maintain a constant pocket volume, it is made sure that no air leaks across the ferrofluid seal during this decompression. One point that is easily distinguishable is the point of maximum load capacity given by relation (equation (13)). Another point that is easily distinguishable is the so-called ‘knee point’, which is a point on the force curve that shows a sudden change in slope. This ‘knee point’ is caused by a sudden change in the slope of the curve of the magnetic field intensity followed by the inner fluid interface. This occurs when the inner fluid interface is right in-between the two peaks of magnetic field intensity presented in Figure 11. The inner fluid interface moves inwards for a decreasing compression.
For the stiffness validation, it is required to know the difference in magnetic field intensity across the seal for a certain fly height for the two points (the point of maximum load capacity and the knee point). This is no problem for the point of maximum load capacity since the location of the inner fluid interface is known. The fly height of the knee point can be derived from the point of maximum load capacity by analysing how the inner fluid interface moves inwards for increasing fly height. For small displacements and so small change in pressure, the air volume of the pocket can be assumed to be incompressible. The fly height for a corresponding knee point can then be calculated with

Relation (equation (7)) is validated in a similar way by predicting the linear stiffness between the point of maximum load capacity and the knee point. This is done by using the pneumatic leverage value of exactly in-between the two points.
For the whole stiffness validation, it is assumed that the field intensity at the outer fluid interface stays constant since the displacements are only small. The measurements are performed by increasing the force up to a value of
Results and discussion
This chapter validates the theoretical predictions with experimental results and is divided into three parts: first the model of the load capacity is validated followed by the validation of the knee point that is then used to validate the stiffness model.
Maximum load capacity
The measured curve of maximum load capacity is presented in Figure 12. During the experiments, it is observed that the initial outer magnetic field interface, when the bearing faces were not touching, is measured to be The force in the figure presents the maximum load of the in function of the fly height. Compressing the bearing will cause air to escape from the seal, because the pressure in the pocket of air becomes larger than the pressure that can be counteracted by the seal. The first three datasets in the figure are three different measurements that show that the maximum load curve of the bearing has a high repeatability. The fourth dataset is the result from the theoretical model of this process presented in relation (equation (12)). The figure shows that the model fits the measurements well.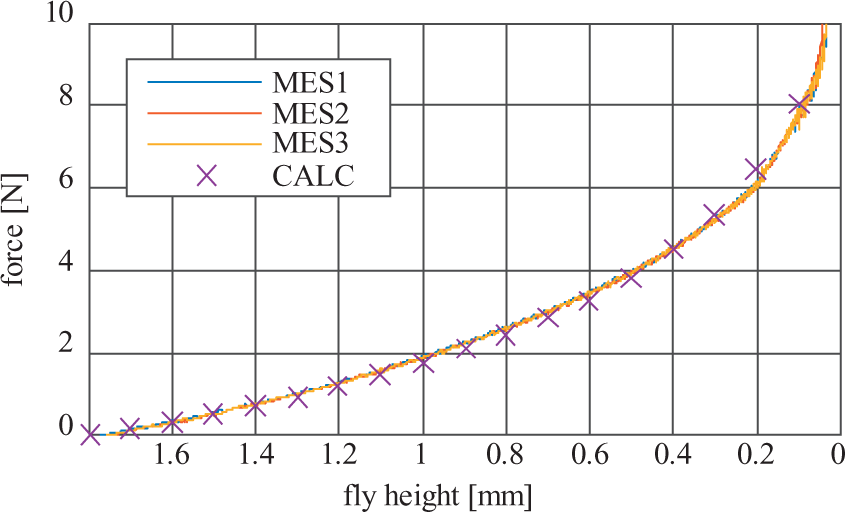
The data show that the theoretical model fits the measurements well. This furthermore shows that the load capacity is mainly defined by the pressure across the seal and only partly defined by the contribution of the pressure of the seal itself.
Knee point
The force curve that is applied over time is presented in Figure 13. The force in function of the fly height is presented in Figure 14. The location of knee point in the load curve is presented in Figure 15. The knee point can be calculated by using formula (equation (14)) and the shape of the magnetic field presented in Figure 13. These graphs show that point of maximum load capacity is located at a radial position of rmax = 11.8 mm with a fly height of hmax = 0.235 mm. Decompressing the bearing causes the inner fluid interface to move inwards towards the knee point. The air mass inside the pocket stays approximately constant during this process, which means that the location of the inner fluid interface can be calculated from the known fly height of the bearing and the known volume of the pocket. The fly height of the knee point can now be calculated to have the following value
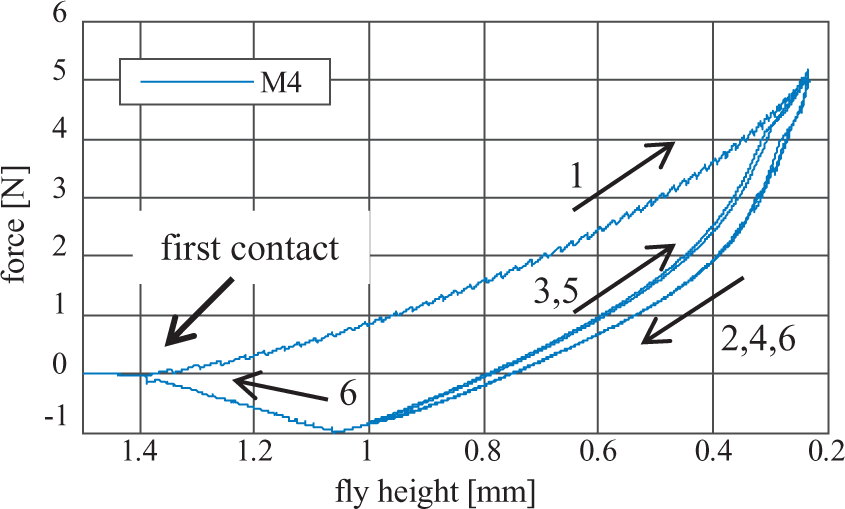
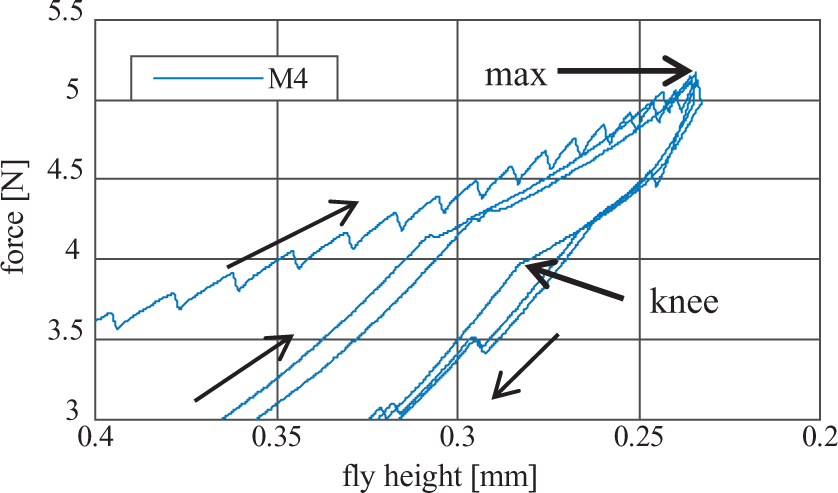
This figure presents the measured force and fly height of the bearing over time. The measurement starts with no contact between the bearing and the surface. The load–unload cycle is repeated three times and shows the hysteresis of the bearing. The numbers correspond with the numbers of Figure 14. This figure presents the measured force of the bearing as function of its fly height. In the initial part, some force ripple can be observed that is caused by air escaping from the pocket. The repeated part of the graph shows two different stiffness values that are caused by the shape of the magnetic field. The hysteresis mainly is caused by the air transport across the inner ferrofluid seal. The numbers corresponds with the numbers of Figure 13. This figure presents a zoomed-in part of Figure 14. It can be seen that the curve shows some hysteresis. The two points of interest are the point of maximum load capacity and the knee point. The point of maximum load capacity (max) is at a force of FL = 5.2 N and an fly height of h = 0.235 mm.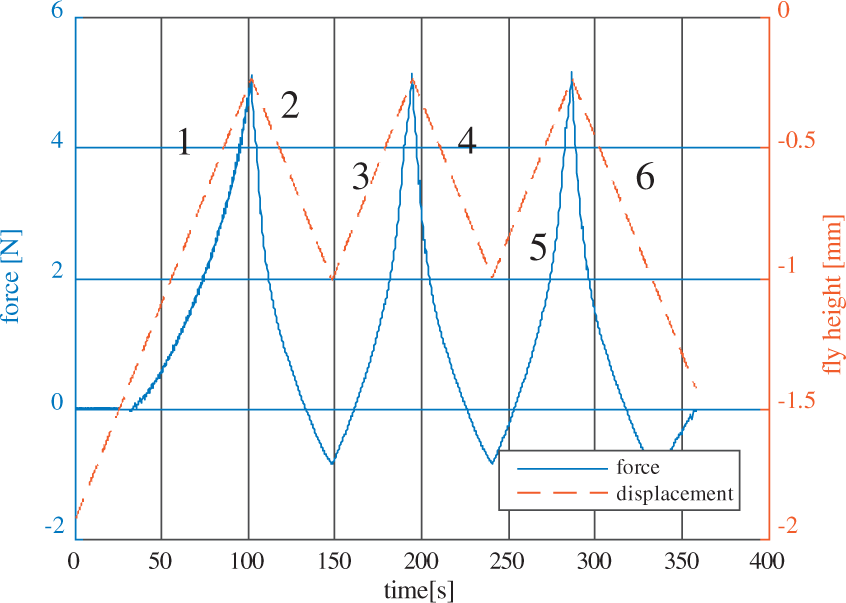

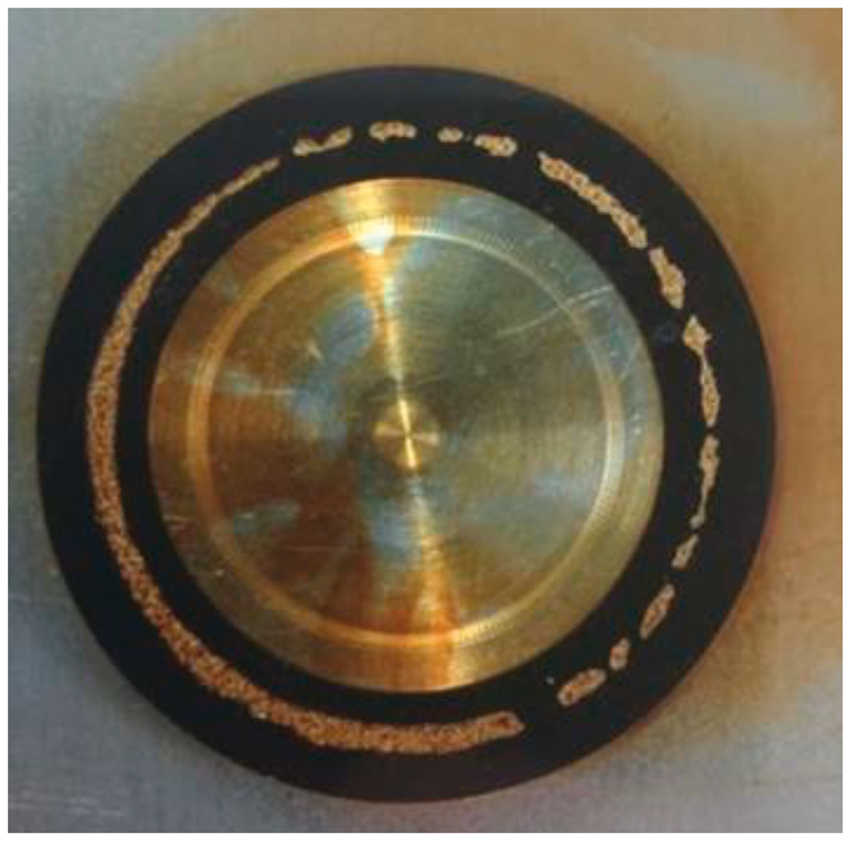
Decreasing the compression even more makes the inner fluid interface to jump over this peak to continue back down at the other side of the inner peak (Figure 16). The inner fluid interface is able to jump over this peak due to the fluid that sticks behind as can be seen from Figure 17. Fluid sticks behind due to the attracting force of the inner peak in magnetic field.
This figure presents the modelled magnetic field intensity as function of the radial position r for different fly heights. The point of maximum load capacity has a fly height of hmax = 0.235 mm and the knee point has a fly height of hknee = 0.28 mm. This figure presents the ferrofluid pocket bearing used for the experiment discussed in this section. With a glass plate, the two seals with capillary interconnection are made visible. The magnet used is the HKCM 9963-433.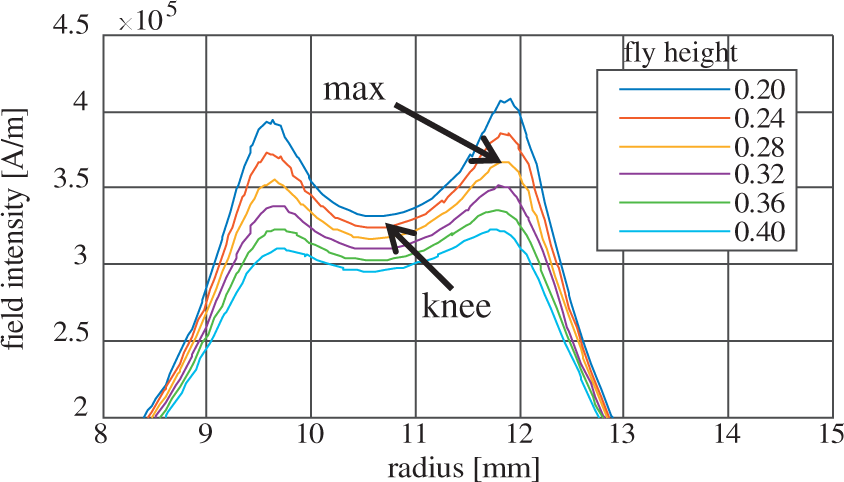
This inner peak also causes ripple in the load curve due to air escaping from the outer chamber into the inner chamber. This introduces a hysteresis like behaviour that is clearly visual in the shape of the curve presented in Figure 14. The hysteresis decreases for increasing fly height due to the decreasing contribution of the inner peak as can be seen in Figure 16.
Bearing stiffness
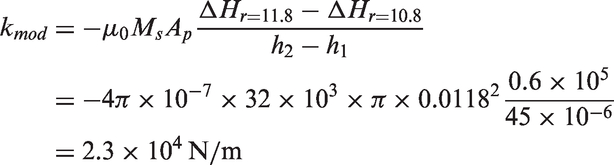
The stiffness of the bearing can now be validated by comparing the measured stiffness with the stiffness that is described with relation (equation (7)). The location of the knee point is now used to calculate the average measured stiffness between the two points of interest in Figure 15. This has the following value

The theoretical stiffness can be calculated from the magnetic field presented in Figure 16.
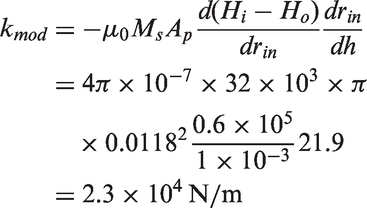
The theoretical stiffness can also be calculated by using the pneumatic leverage.

The three calculated stiffness’s have a value of around
Discussion
The experimental results of this research are in good accordance with the derived model. This shows that the proposed method provides a reasonable method to predict the load and stiffness characteristics of a ferrofluid pocket bearing. This furthermore shows that the load capacity of the bearing is mainly determined by, the magnitude of the magnetic field, the magnetization strength of the ferrofluid and the surface area of the pocket. This also shows that the stiffness of the bearing is mainly determined by the gradient of the magnetic field at the fluid interfaces, the magnetization strength of the fluid and the surface area of the pocket.
Maximizing the load and stiffness requires maximizing the different parameters they are related to or by placing multiple ferrofluid seals in series. The magnetic field strength at the fluid interfaces can be increased by using stronger magnets or by focusing the magnetic field with the use of example iron. Focusing the magnetic field has the additional effect that the gradient increases, which is beneficial for the stiffness. The compressibility of the pocket of air in the bearing is negligible for the bearing design, because the effective stiffness of the air is much larger than the stiffness of the seal. This might not be the case anymore for other designs that for example use a larger surface area of the pocket, the stiffness of bearing will in this case be predominantly determined by the stiffness of the air instead (see equation (11)).
Conclusions
The theoretical model for the maximum load capacity and the stiffness is in good accordance with the experimental results, which means that the proposed method is valid for describing the load capacity and the stiffness of a ferrofluid pocket bearing. This method shows that the load characteristics can be directly calculated from the shape of the magnetic field and the geometry of the bearing. Comparing the theoretical model with the measurements also shows that the load and stiffness of the bearing are in general mainly determined by the sealing capacity of the seal and only partly determined by the pressure of the ferrofluid itself. The results furthermore show that having two radially distributed peaks in magnetic field intensity introduces some hysteresis in the system that might be undesirable. It has been shown that a bearing with a diameter of 24.5 mm is capable of carrying a load of approximately 8 N with a stiffness of approximately
Footnotes
Declaration of Conflicting Interests
The author(s) declared no potential conflicts of interest with respect to the research, authorship, and/or publication of this article.
Funding
The author(s) disclosed receipt of the following financial support for the research, authorship, and/or publication of this article: Dutch TKI Maritime Funding Program.