
Abstract
Surface topography is important as it influences contact load-carrying capacity and operational efficiency through generated friction, as well as wear. As a result, a plethora of machining processes and surface finishing techniques have been developed. These processes yield topographies, which are often non-Gaussian, with roughness parameters that alter hierarchically according to their interaction heights. They are also subject to change through processes of rapid initial running-in wear as well as any subsequent gradual wear and embedding. The stochastic nature of the topography makes for complexity of contact mechanics of rough surfaces, which was first addressed by the pioneering work of Greenwood and Williamson, which among other issues is commemorated by this contribution. It is shown that their seminal contribution, based on idealised Gaussian topography and mean representation of asperity geometry should be extended for practical applications where surfaces are often non-Gaussian, requiring the inclusion of surface-specific data which also evolve through process of wear. The paper highlights a process dealing with practical engineering surfaces from laboratory-based testing using a sliding tribometer to accelerated fired engine testing for high performance applications of cross-hatched honed cylinder liners. Such an approach has not hitherto been reported in literature.
Introduction
For all machinery and devices there has been a growing trend towards system compactness, whilst maintaining or improving upon functional performance. These requirements often lead to smaller load-bearing conjunctions with higher applied loads. The repercussion is often very thin lubricant films operating under mixed or boundary regimes of lubrication. Therefore, there is a greater tendency in asperity interactions on the counter face surfaces, which would adversely affect generated friction and hence the system efficiency. Consequently, at least for advanced modern engineering design, a formative process of running-in wear is desired in order to reduce the long-term effect of system inefficiency. This is often achieved through thin sacrificial coatings or more durable smooth hard wear-resistant coatings, depending on application and dominant mode of wear. 1 These are often planned, designed and incorporated into component design. Howell-Smith et al. 2 described the approach for advanced cylinder liners of high performance race engines and Styles et al. 3 explained the combination of a sacrificial and a sputtered hard porous layer on the compression ring of an engine subject to high loads and sliding speeds, to name but a few such approaches. After the initial running-in period, the resultant surface topography often determines the tribological contact conditions for most of the remaining useful life of the conjunction. 3 The process of running-in is quite complex due to the simultaneous transient nature of contact mechanics, tribo-chemistry and evolving topography as discussed by Blau. 4
The first recorded account of running-in was by Hirn, 5 who noted that lubricated bearings should run for a length of time before a stabilised frictional torque, lower than that initially measured, would be achieved. Later, the work of Abbott and Firestone 6 led to the concept of real as opposed to the apparent bearing contact area as a function of surface height topography. They commented on new surfaces moving into a contact and causing the highest peaks to be removed during a rapid initial running-in stage, which reduced in intensity as the contact area grew. Reason 7 reported that the height distribution alone was not an adequate measure in describing the functionality of rough surface topography and that more accurate measurements and statistical representation would be required.
The seminal work in representation of contact of real rough surfaces was carried out by Greenwood and Williamson 8 and extended by Greenwood and Tripp. 9 It provided a greater understanding of the nature of rough surface interactions. The surface topography was represented stochastically as distributed elastic contacts, complying with the classic elastostatic Hertzian contact theory. 10 The rough surface topography was represented by asperities as elastic ellipsoidal solids with an average radius of curvature, peak density and height distribution. In this manner, the contact load-carrying capacity of the surface at varying separations could be determined as well as boundary friction. Whitehouse and Archard 11 proposed a random process theory to investigate the properties of assumed Gaussian contacting surfaces. The study was limited to the treatment of simple exponential probability density functions. This work was later extended by Whitehouse and Phillips.12,13 The approaches expounded in Greenwood and Williamson, 8 Greenwood and Tripp, 9 Hertz, 10 Whitehouse and Archard 11 and Whitehouse and Phillips12,13 have provided an opportunity for representing asperity interaction in mixed and boundary regimes of lubrication in prediction of conditions (load-carrying capacity and friction) in many applications in the past half century. In many cases predictions have shown good agreement with the experimental measurements, e.g. for prediction of engine cylinder friction.14–16 Any deviation between predictions and measurements were accentuated in the parts of piston cycle, which promoted increased boundary interactions such as at the piston dead centre reversals. These differences were seen as the result of cross-hatched honed new liner surfaces whose topography deviates from a Gaussian distribution. The reported works in Akalin and Newaz, 14 Mishra et al. 15 and Gore et al. 16 deal with new liner topography. Cross-hatch honing creates a plateaued surface with a kurtosis value greater than 3. Kurtosis value of 3 represents a Gaussian surface. 2 In fact, Stout and Davis 17 who also investigated cylinder liners’ surfaces showed that the kurtosis of the surface was significantly increased during engine running. Therefore, many surfaces, particularly prepared for certain applications do not conform to a Gaussian assumption. The processes of wear and deformation change the nature of the surface topography, something which has to be taken into account in predictive analyses. The assumption of an average asperity radius is also idealistic and varies particularly with height of topography or separation of contacting rough surfaces.1,18
Greenwood and Williamson’s model 8 was further developed to account for the non-uniform nature of the radii of curvature of asperity peaks by Hisakado, 19 and for elliptic paraboloid asperities by Bush et al., 20 as well as for anisotropic surfaces by McCool. 21 The Greenwood and Tripp model 9 was extended by Pullen and Williamson 22 to account for the plastic deformation of asperities and further improved by Cheng et al. 23 by an elastoplastic model. A recent extension of the model for combined elastoplastic and adhesion of asperities for fairly smooth surfaces, using fractal geometry was reported by Chong et al. 24 Nevertheless, the original Greenwood and Tripp model 9 has been widely used in many applications.14–16,25–27
Following from the findings of Stout and Davis, 17 several authors have studied the changes of surface topography during the running-in process.28–30 Jeng et al. 28 compared a numerical analysis with experimental measurements, overall parameters such as the arithmetic mean, root mean square (RMS) and skewness were considered. Shakhvorostov et al. 29 undertook an energy-based approach, concluding that the total power loss is due to dissipated heat, wear generation and material change. A recent numerical analysis was conducted by Ghosh and Sadeghi, 30 showing that kurtosis tends to increase with wear, and higher wear rates occur for more positively skewed surfaces.
This paper shows that whilst pioneering works reported in Greenwood and Williamson 8 and Greenwood and Tripp9 have laid a solid foundation for interaction of rough surfaces, certain aspects of the work should be extended for use in many practical applications. Engineering surfaces are often non-Gaussian and may also not be considered as nominally (i.e. fairly) smooth,8,9 such as those of plateau honed. Furthermore, engineering surfaces are prepared through a series of progressive operations, thus asperity geometry is often of a hierarchical nature. Finally, the process of wear alters the topographical parameters, thus the tribological performance of rough contacting pairs. Thus, although the fundamentals of the approach in Greenwood and Williamson 8 and Greenwood and Tripp remain largely unaltered salient extensions are required to address a host of practical cases, as highlighted in the review of literature since the works in Greenwood and Williamson 8 and Greenwood and Tripp. 9 This paper addresses the particular shortcomings noted here and in particular with respect to the non-Gaussian plateau honed surfaces. The surface-specific topographical approach, including the evolving effect of running-in wear is demonstrated using a sliding tribometer and the verified approach is extended to the study of similar surfaces in a series of internal combustion engine tests.
Contact mechanics of rough surfaces
Discretely measured surfaces can be used in probabilistic models, using frequency distributions in the form of histograms. The asperity summits can be identified as the local maxima of the surface heights and analysed using discrete peak height distributions. The convolution of the two peak height distributions of a pair of contiguous surfaces can be used to represent an equivalent rough surface (equivalent of the two rough surfaces in contact), combining the topography of the two original surfaces, against a flat smooth one. If the deformation behaviour of all equivalent asperities at any separation is assumed to follow the classical elastostatic Hertzian theory, then Greenwood and Tripp9 showed that the load carried by the convoluted equivalent rough surface becomes


In a similar manner, the mean area of asperity contact is found as


The asperity tip radii were identified as points on the surface, higher than the surrounding points. A sixth-order Lagrangian function is then applied to determine the radius of the identified asperities in the x and y directions and an average is assigned.
For the individual surfaces,


Sliding tribometer tests
A reciprocating sliding tribometer is used to measure the generated friction between the two measured rough surfaces. One is a ‘strip,’ comprising a parabolic contact face profile, typical of piston compression rings. The strip slides on a flat sample, mounted onto a floating flat plate, supported by low friction bearings and intervened from the solid base of the rig by piezo-resistive load cells (Figure 1). The floating plate is dragged by the sliding contact conjunction, which is furnished with 1 mL of a highly paraffinic, ultra-low sulphur base oil. Table 1 provides the rig specification and the base oil rheological data. A base oil is used in order to guard against adsorption of boundary active species present in the usual lubricants, which can affect the repeatability of testing. The motor-driven leadscrew drives the sliding strip against the flat plate samples, while it is loaded downwards. The generated friction equates to the inertial force.
The sliding strip tribometer. Experimental data.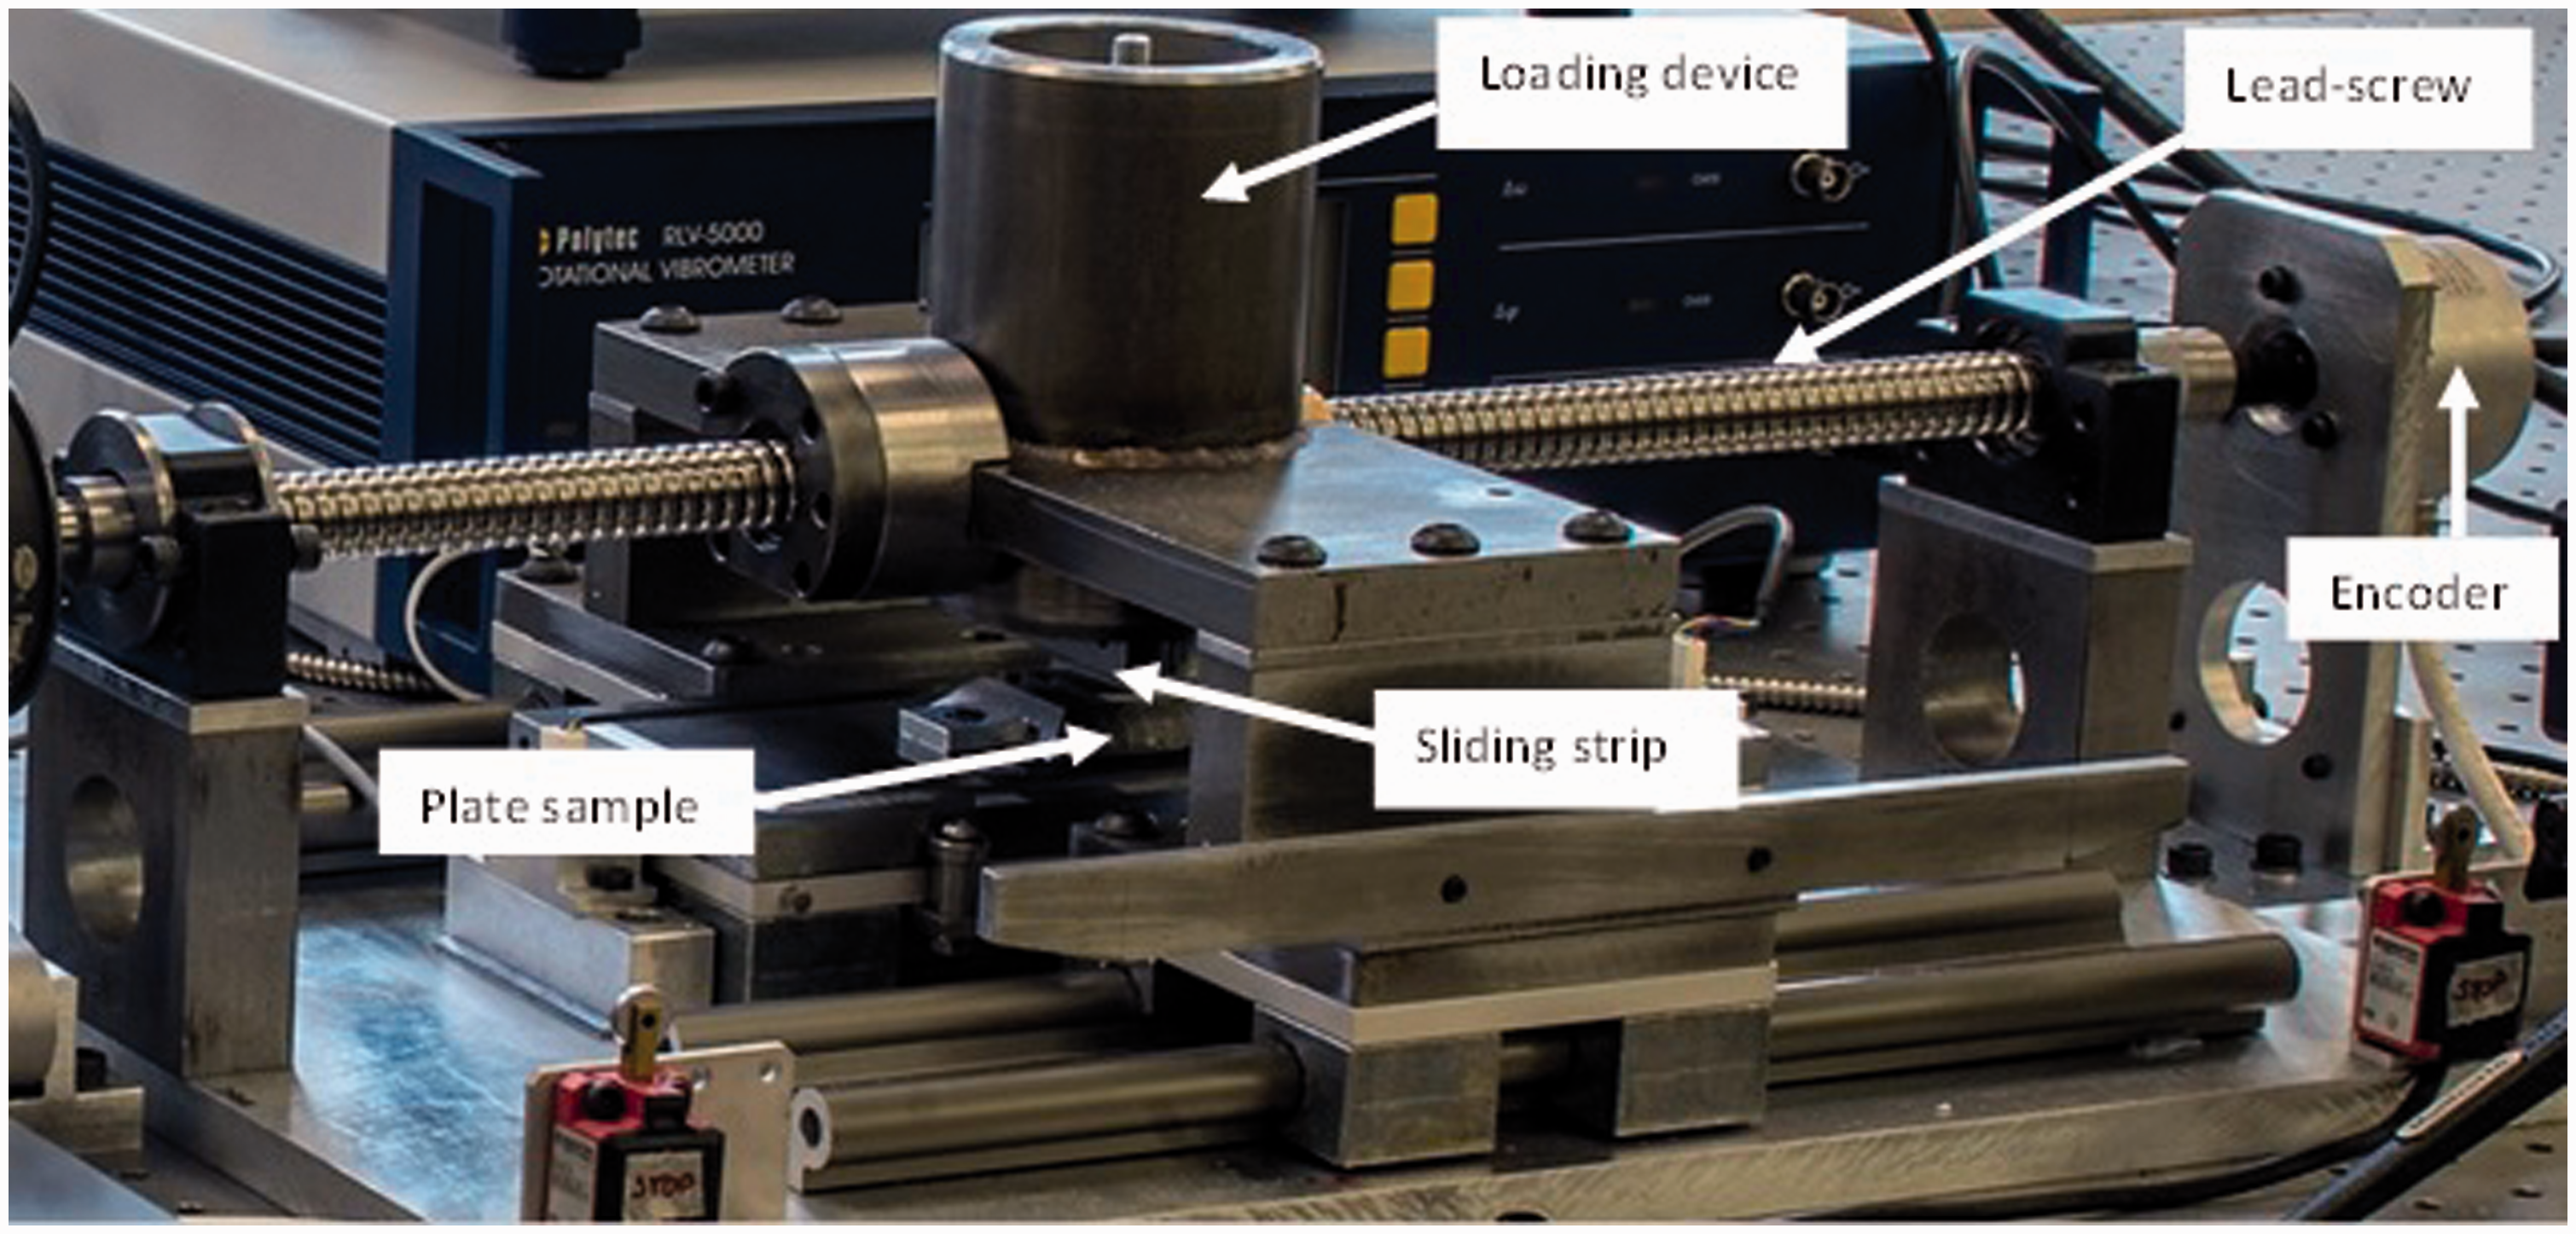
The rig is operated at low sliding velocity, thus rendering mixed or boundary regimes of lubrication. Further details about the sliding tribometer are provided by Morris et al. 31
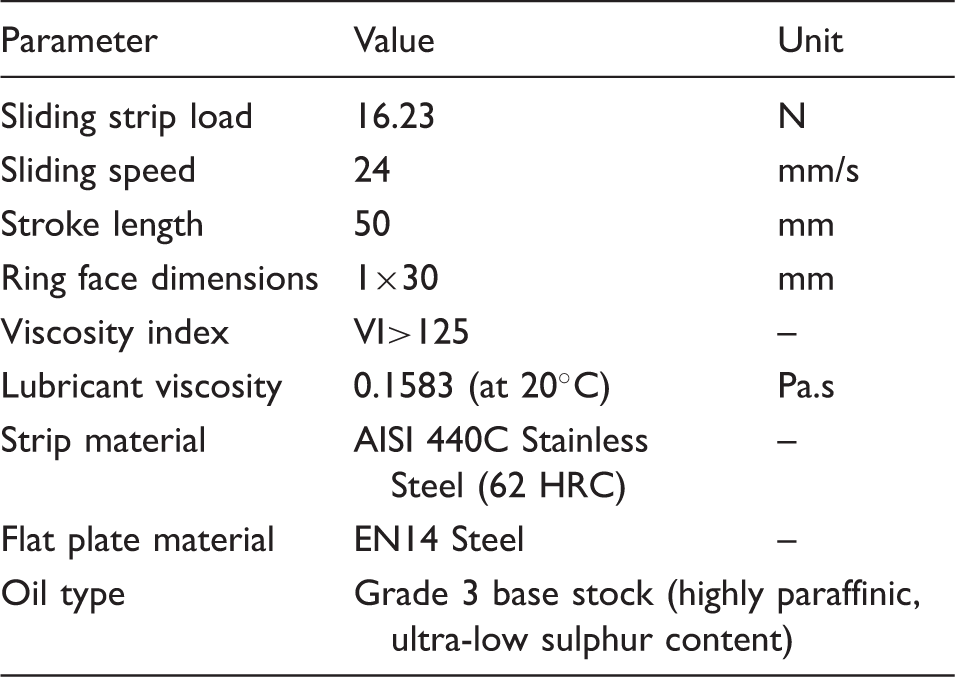
The surface finish of the strip and the flat sample were created to replicate those of the contact face-width of the piston compression ring and a cross-hatched cylinder liner respectively. These are shown in Figure 2.
Surface height plot of (a) cross-hatched plate sample, (b) sliding strip (both images represent an area of 0.3845 mm2).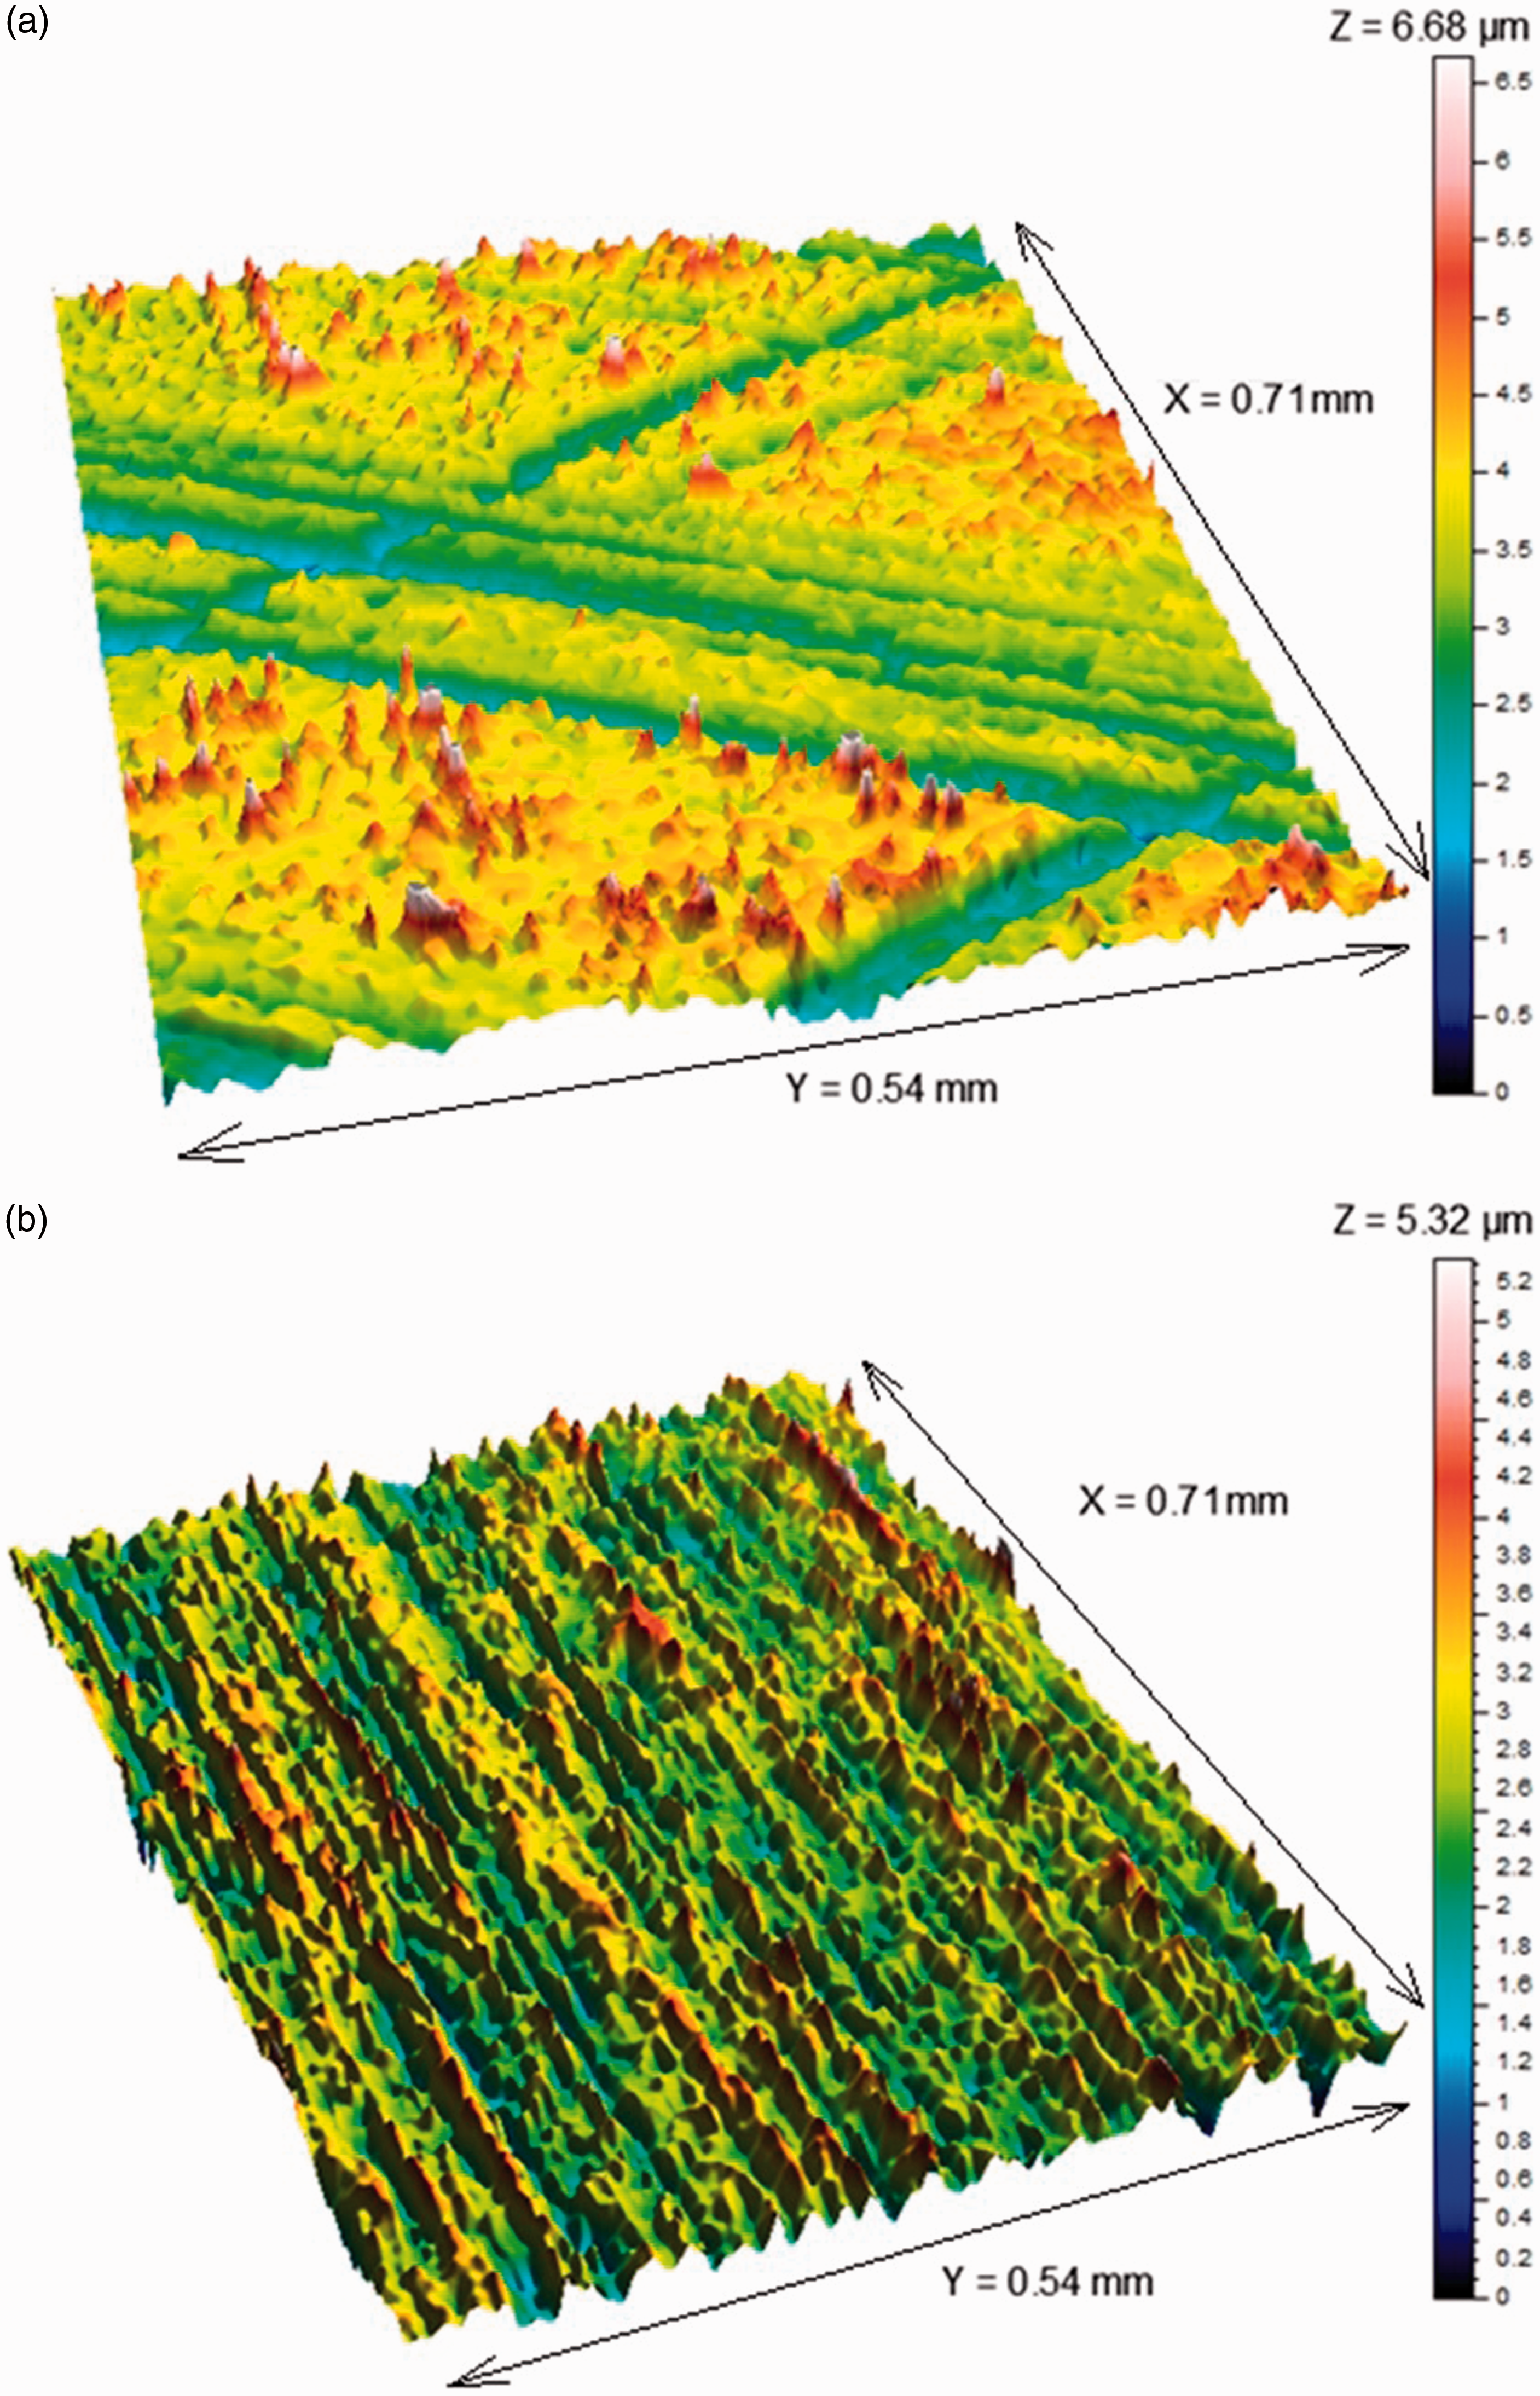
Sliding tests procedure and measurements
Initially, the roughness of the sliding strip and the cross-hatched plate were measured using an Alicona infinite focus microscope with a
Then, a series of reciprocating tests were carried out using the sliding tribometer. These included 5, 15, 35, 75, 115 and 155 reciprocating passes. The used samples were then measured using the same approach. Four measurements were taken at marked areas of the surfaces consistently throughout the test procedure. Therefore, all changes to the surface topography as the result of wear were accurately monitored.
As can be observed from equations (1) and (3), the important parameters affecting the boundary interactions are the number of contacting peaks, the average radius of the contacting peaks and the surface RMS roughness,
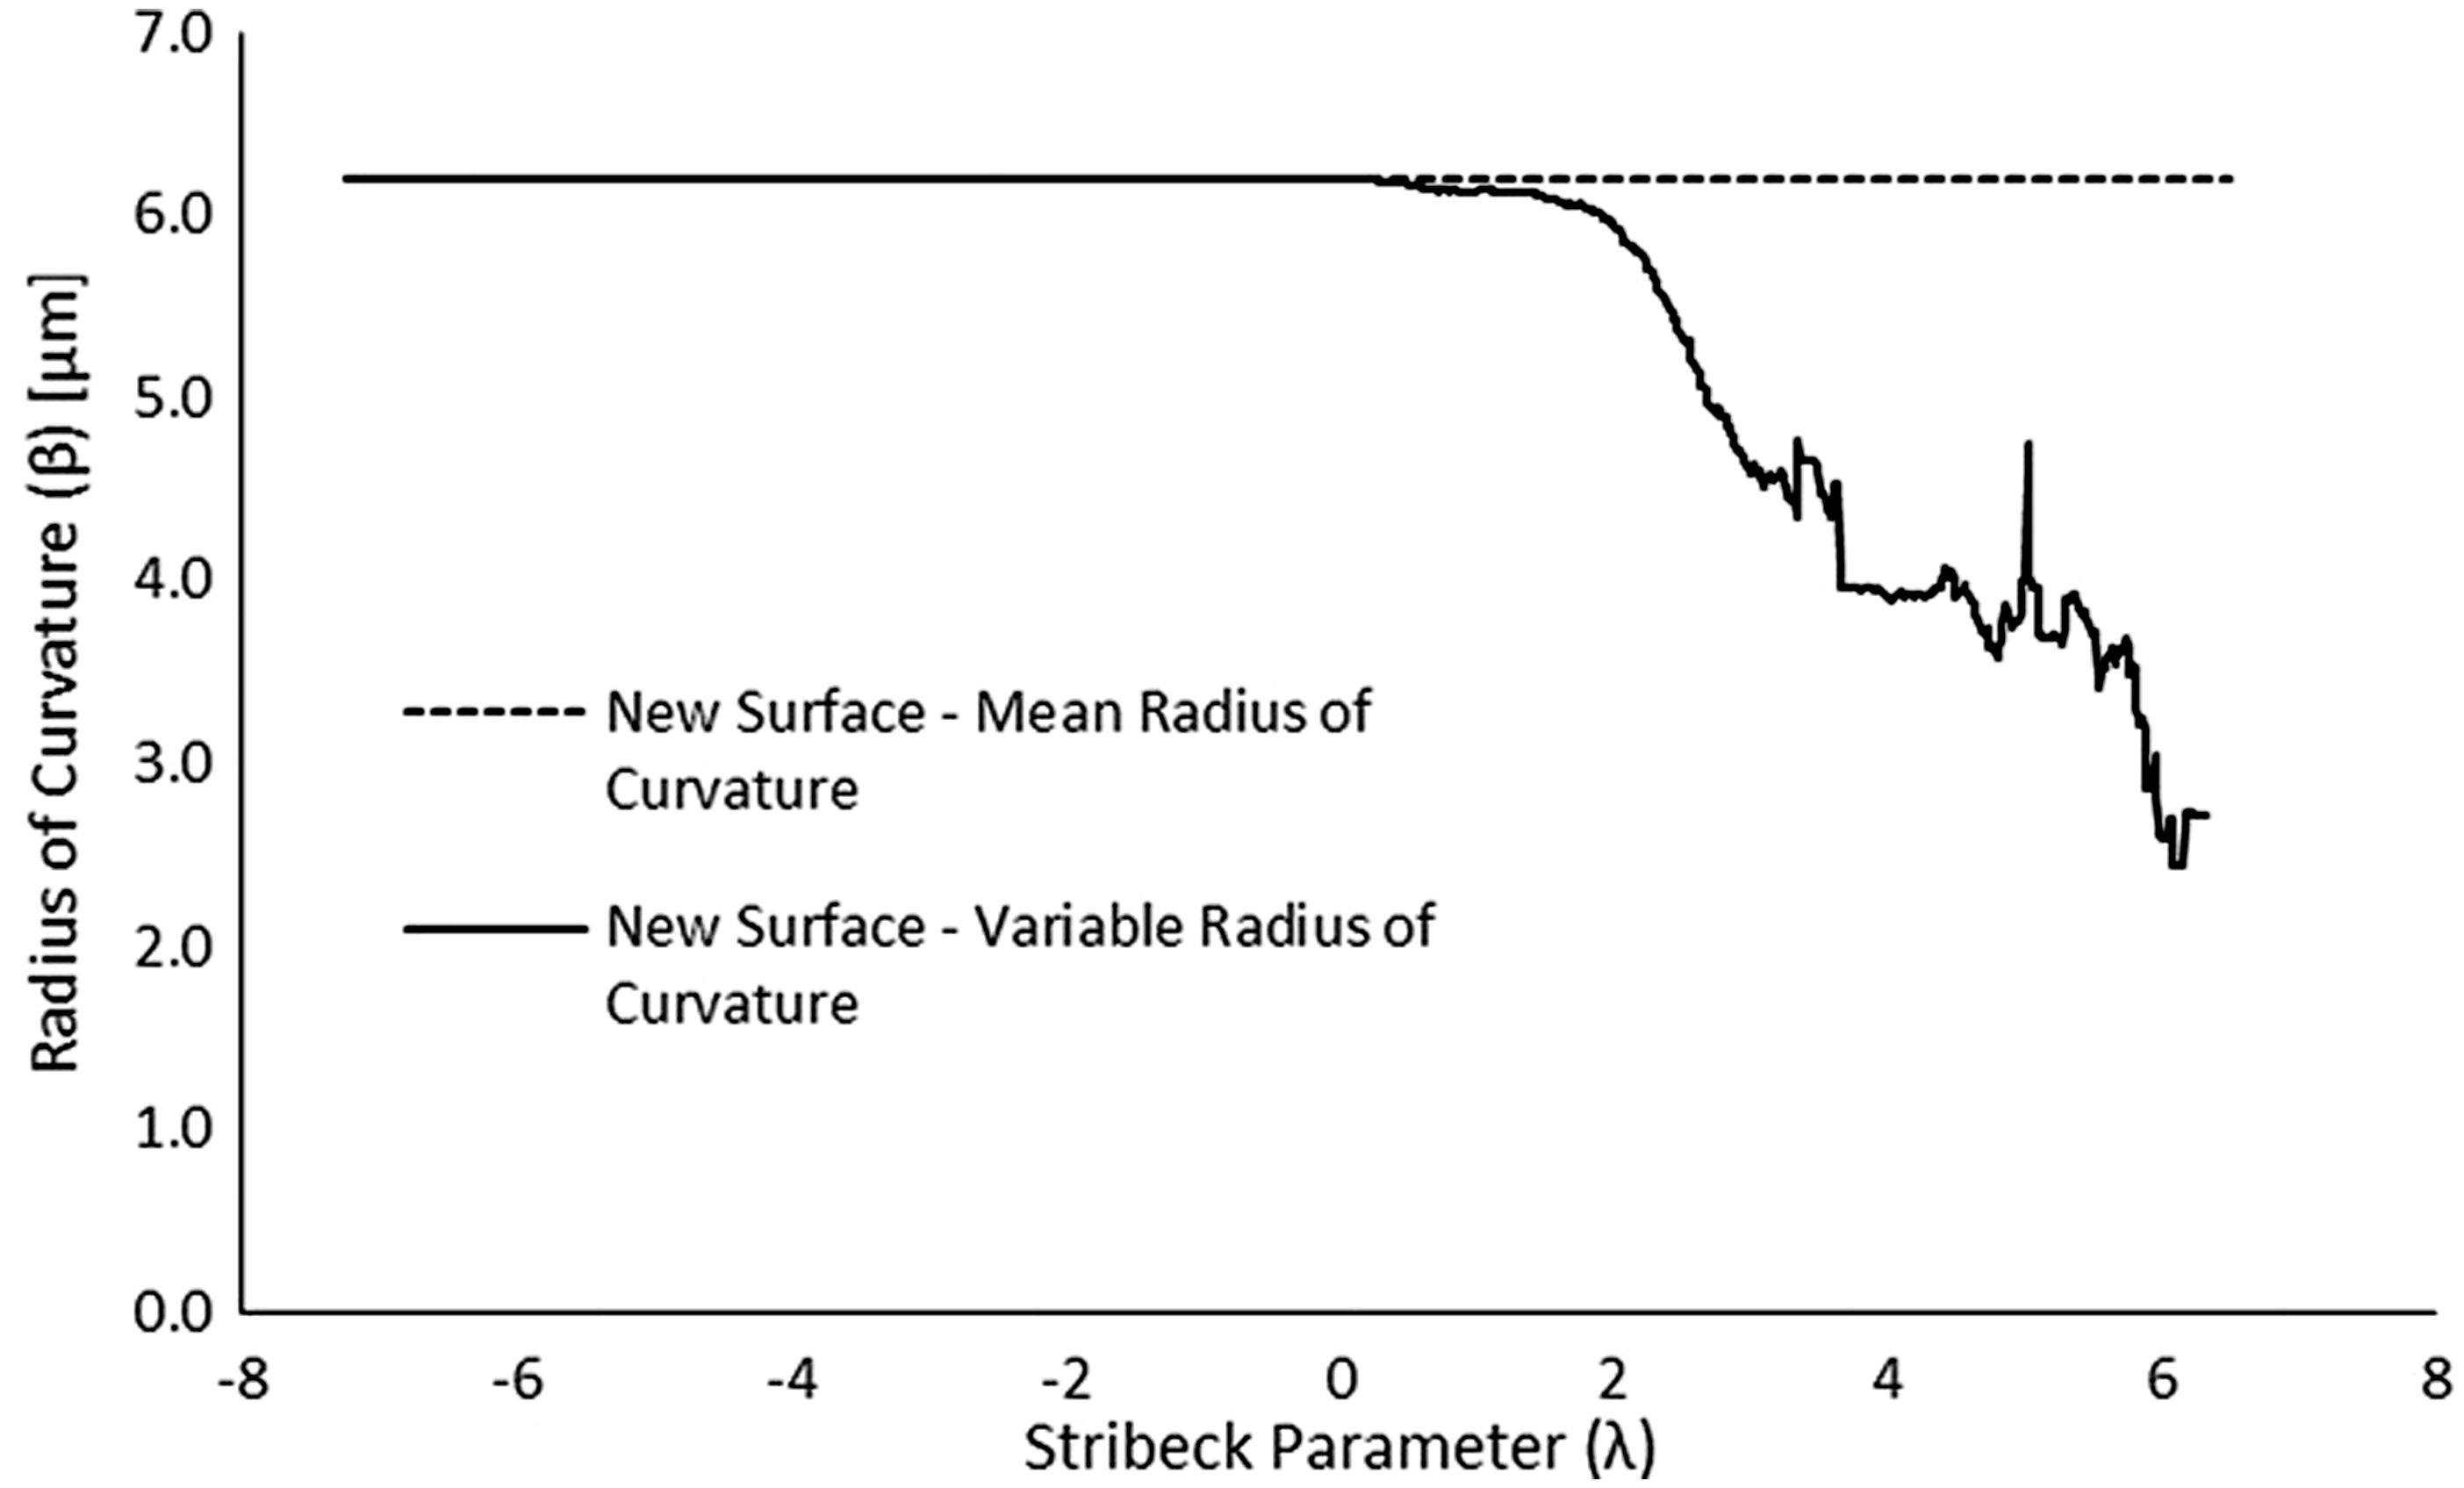
Figures 3, 4 and 5 show the surface height distributions, peak height distributions and peak asperity radii of curvatures, respectively. These graphs are determined by taking the statistical convolution of the upper surface (the sliding strip) and the lower surface (the cross-hatched plate) data.
Convoluted surface height distribution for the new and worn surfaces. Convoluted peak height distributions for the new and worn surfaces with (a) full peak height range and (b) likely contacting region of surfaces under mixed regime of lubrication. Convoluted peak asperity radius of curvature for the initial state of surfaces.
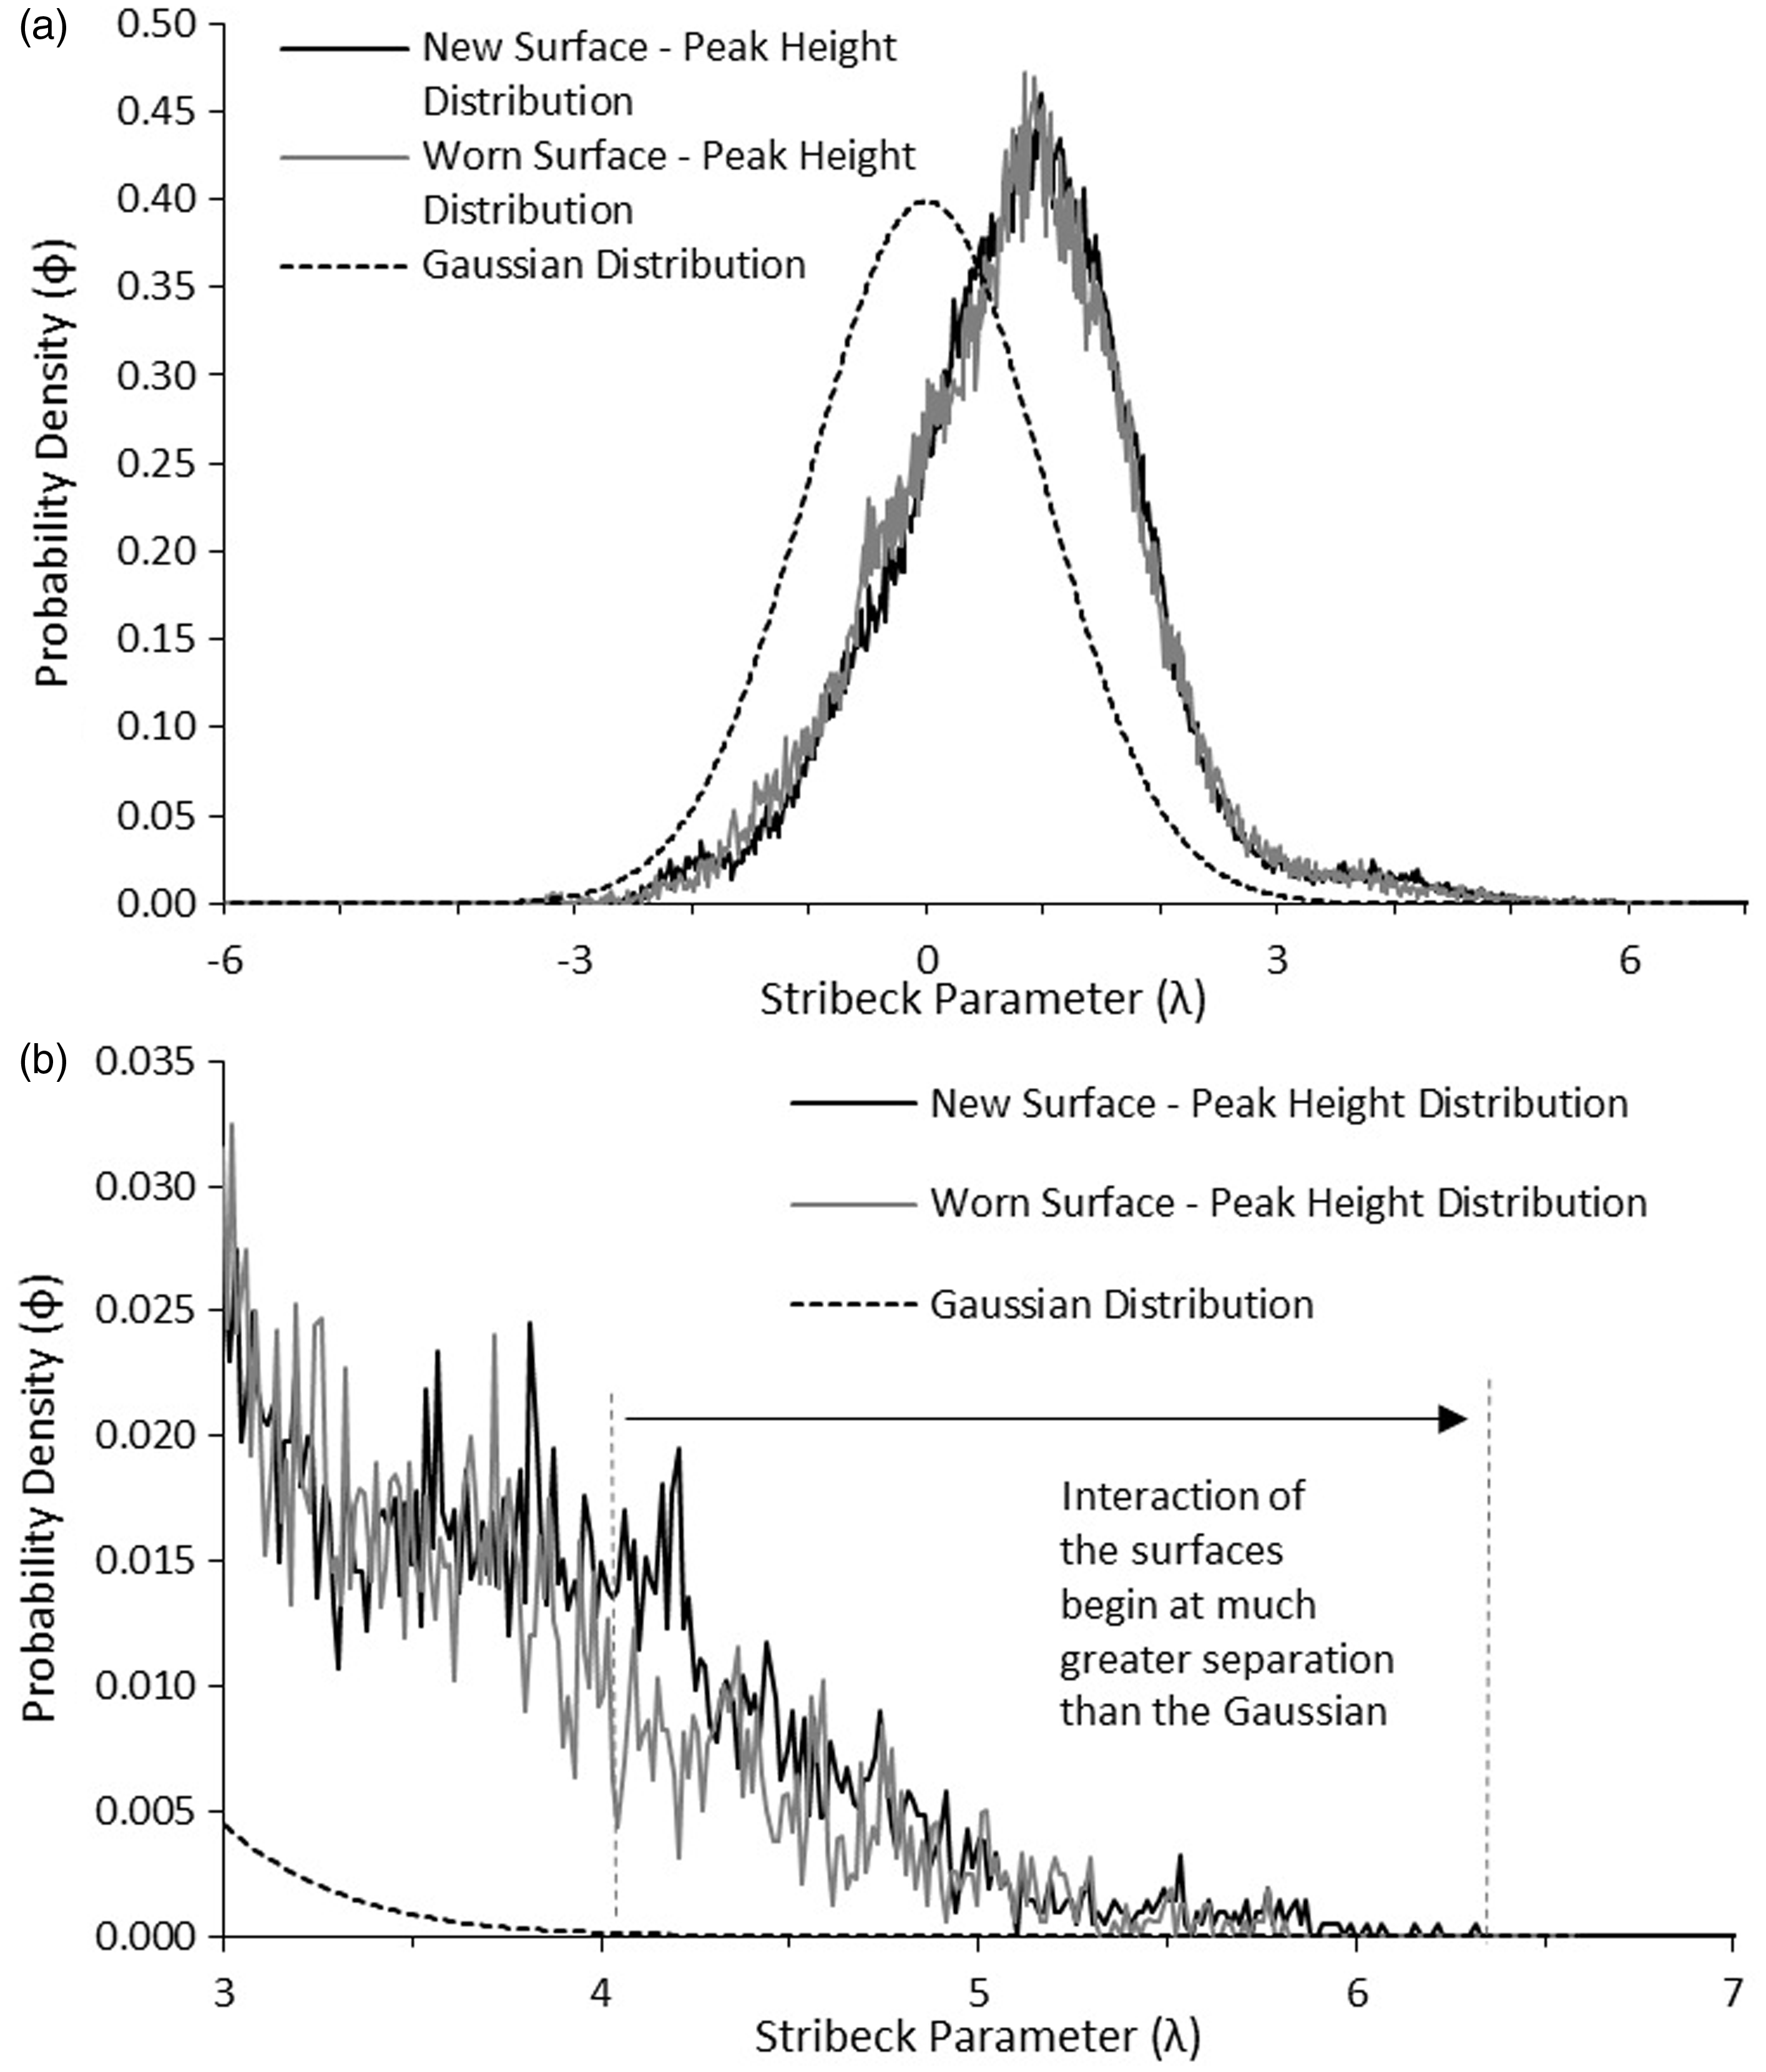
The results in Figure 3 show that the convoluted measured surface height distribution closely conforms to an approximated Gaussian distribution. However, the measured peak height distribution in Figure 4(a) exhibits a negative skew with respect to the Gaussian. Therefore, in this case the measured distribution is distinctly non-Gaussian in form. The measured convoluted distribution is used in the analyses carried out here.
To calculate the roughness parameter and asperity slope for use in the analysis, the mean radius of curvature of the asperity peaks is required. This mean value is shown in Figure 5 for the unworn surface (the dashed line) as a constant value. However, it can be seen that the actual measured peaks’ radii significantly deviate from the mean value, particularly at high Stribeck ratios, which correspond to interactions at larger separation of surfaces. It is noteworthy that these highest peaks come into contact first with the mutual approach of the surfaces. It is therefore clear that the asperity radii cannot be treated as a constant mean value for all separation of counter face surfaces. Another important point to note is that the use of an average asperity radius is reasonable for fairly smooth surfaces, for which the Greenwood and Tripp model 9 was really intended. The measurement results also suggest that the use of a variable average peak radius of curvature in an analysis would also be more representative of worn surfaces.
Analysis of evolving topography with running-in wear
The surfaces (sliding strip contact face and the cross-hatched flat specimen) shown in Figure 2 were subjected to sliding reciprocating contact (see Table 1) in a series of tests with 5, 15, 35, 75, 115 and 155 reciprocating passes. The contacting pair were removed from the rig and their contact surface topography was measured at the same marked locations, thereby enabling monitoring of evolving topographies with the wear process.
The convoluted surface height distribution of the contacting pairs, peak height distribution and variation of asperity radii were determined from the measured data. A comparison of the new and worn (after 155 reciprocations) for convoluted surface height distribution, peak height distribution and peak radius of curvature are presented in Figures 3, 4 and 6. The figures also include an equivalent Gaussian distribution, thus showing any deviations of surface-specific data from the assumptions in Greenwood and Tripp.
9
Asperity radius of curvature for the initial and worn surfaces.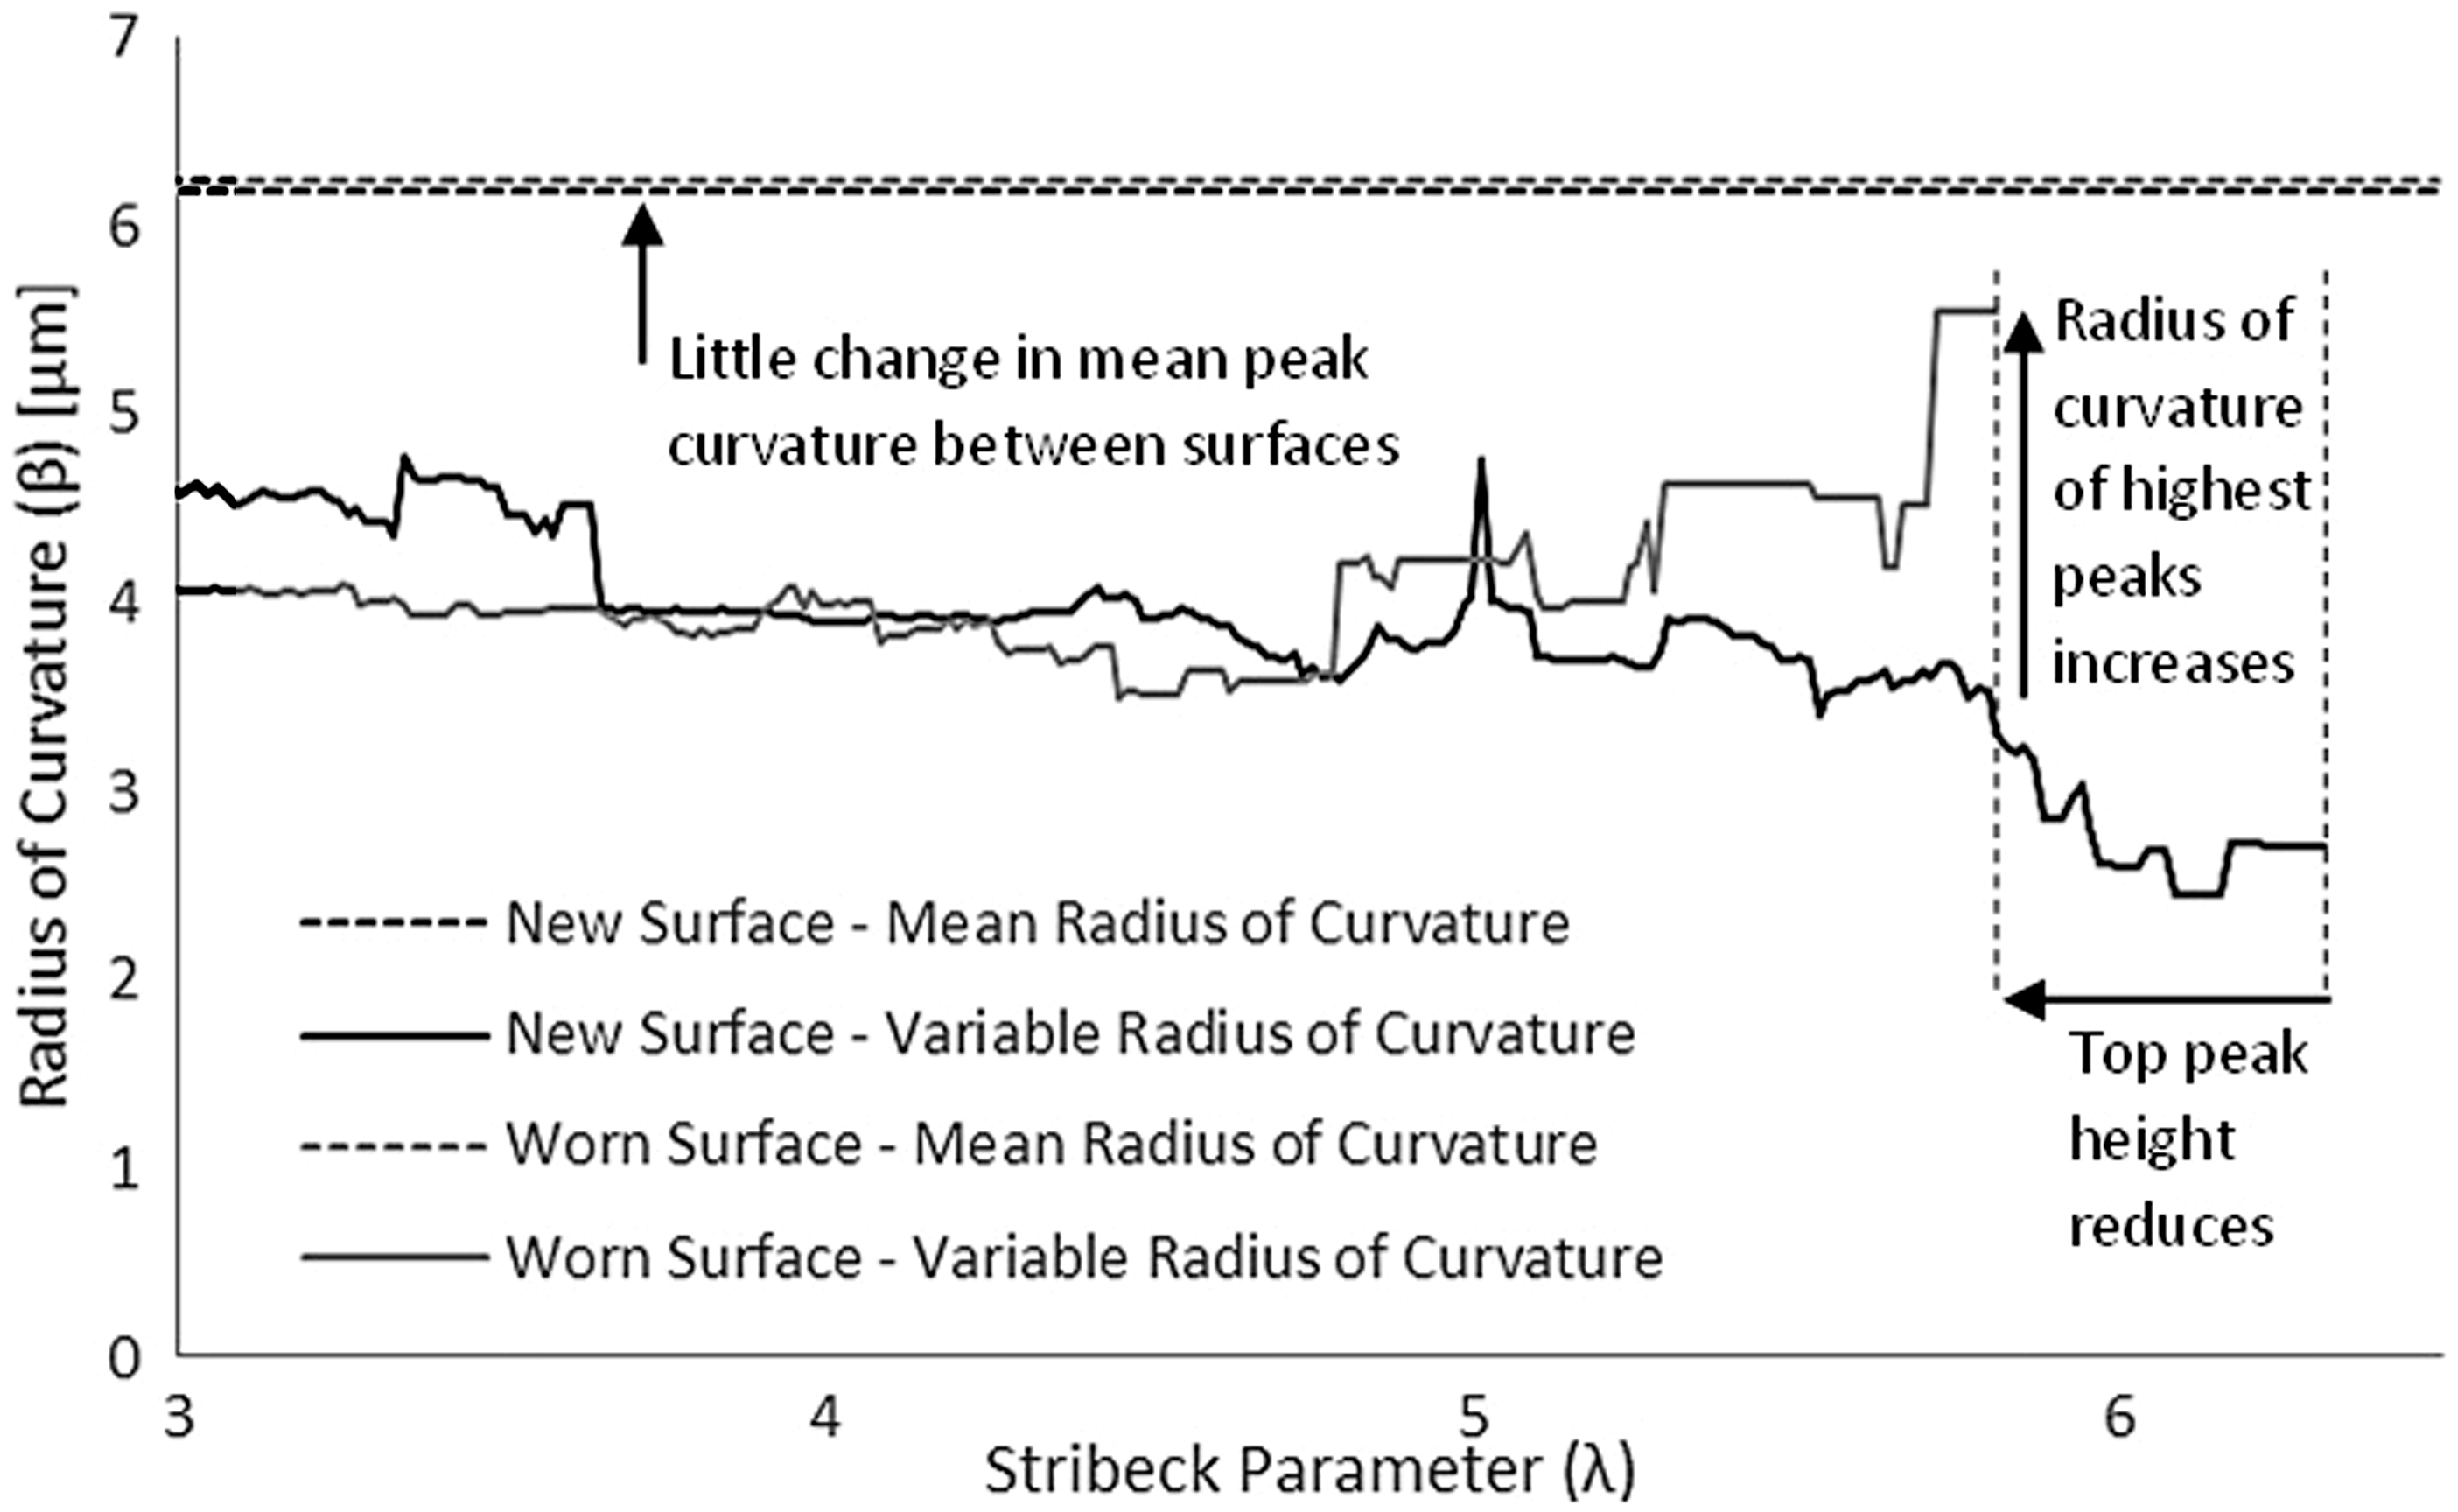
Figures 3 and 4(a) show little discernible change in the evolution of the surface topography from new to the worn state. The non-Gaussian nature of the new surface peak height distribution persists to the case of the worn state. However, there is an appreciable difference in the heights of the uppermost asperity peaks after the running-in process which can be observed in Figure 4(b). The fluxion of the top region of the surface, highlighted in Figure 4(b), indicates the region at which contact between the surfaces occur. The significant deviation from an assumed Gaussian peak height distribution is particularly noteworthy in Figure 4(b). These deviations show that cross-hatched liner topographies are indeed non-Gaussian, even though many studies have used this assumption in using the highlighted approach in Greenwood and Tripp. 9
The change in the uppermost portion of the topography in Figure 4(b) is further emphasised by results in Figure 6. It is shown that the radius of curvature of the upper asperity peaks has increased whilst the height of these has reduced with the wear process. This is an expected outcome as the running-in wear results in broader and flatter asperity geometry. On the other hand, the mean asperity radius shows very little variation through this process. Therefore, the assumption of an average asperity radius of curvature is not representative of the evolving surfaces.
The foregoing shows that the use of appropriate topographical parameters is very important in prediction of key tribological measures such as load-carrying capacity and friction under mixed and boundary regimes of lubrication. In particular, the evolving topography during the process of wear has a profound effect upon frictional performance, thus energy efficiency of all machines, where a realistic prediction of performance is often a key concern. In high performance applications, often a sacrificial coating layer or surface texturing/modification is based on such predictive analysis of evolving topography though the running-in wear. The analysis highlighted thus far shows that the process of development should be based on surface-specific data rather than assumed distributions, particularly for surfaces that do not conform to such assumptions, such as cross-hatched cylinder liners or anisotropic forms. This approach is highlighted in Figure 7, where the load-carrying capacity due to direct boundary interaction is shown through the running-in wear process of the sliding strip against the cross-hatched flat plate specimen, with applied load and sliding speed combination, which is quite representative of conditions encountered in top dead reversal of piston system of motocross motor bike engines. The asperity load-carrying capacity alters significantly in the first 35 reciprocating passes, after which it begins to stabilise after 35 passes in the region above 3.2 µm from the mean line of the surface.
Load-carrying capacity of rough boundary solid interaction through running-in wear.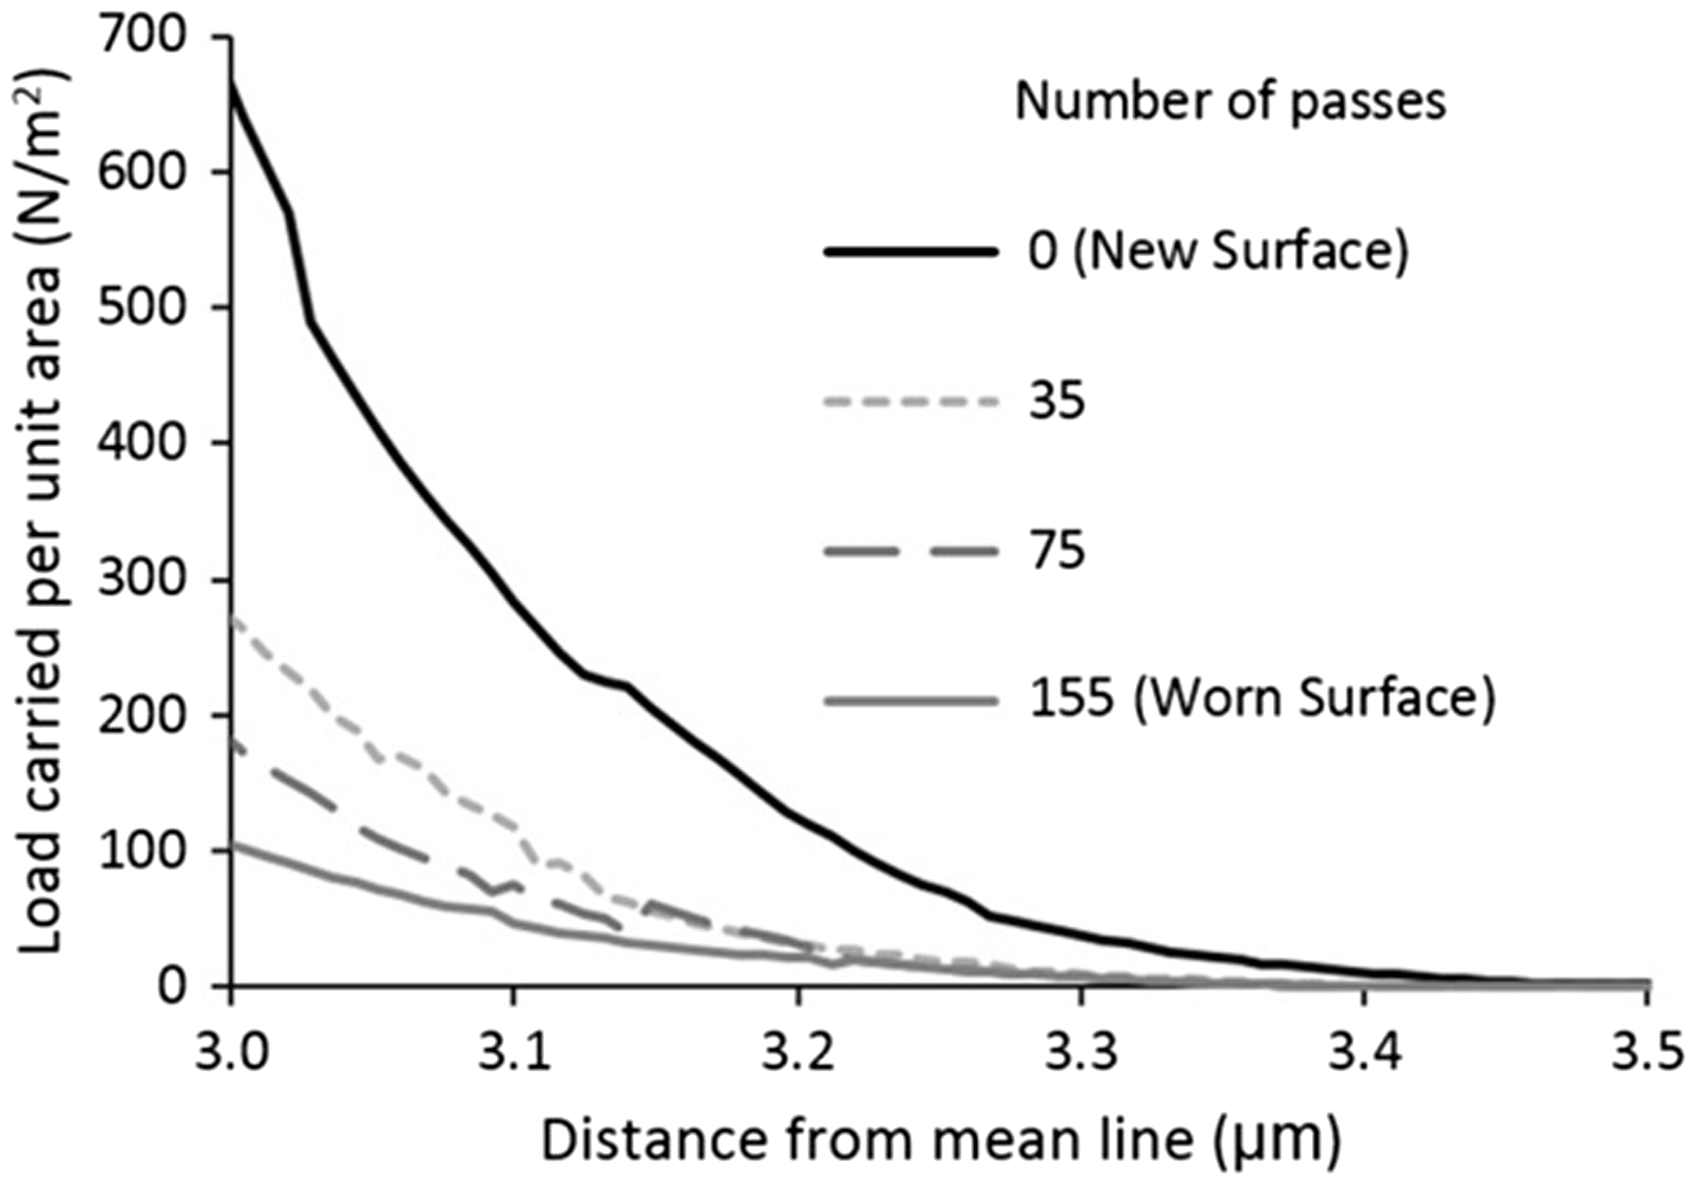
Engine testing and measurement procedure
Honda CRF 450R engine data.
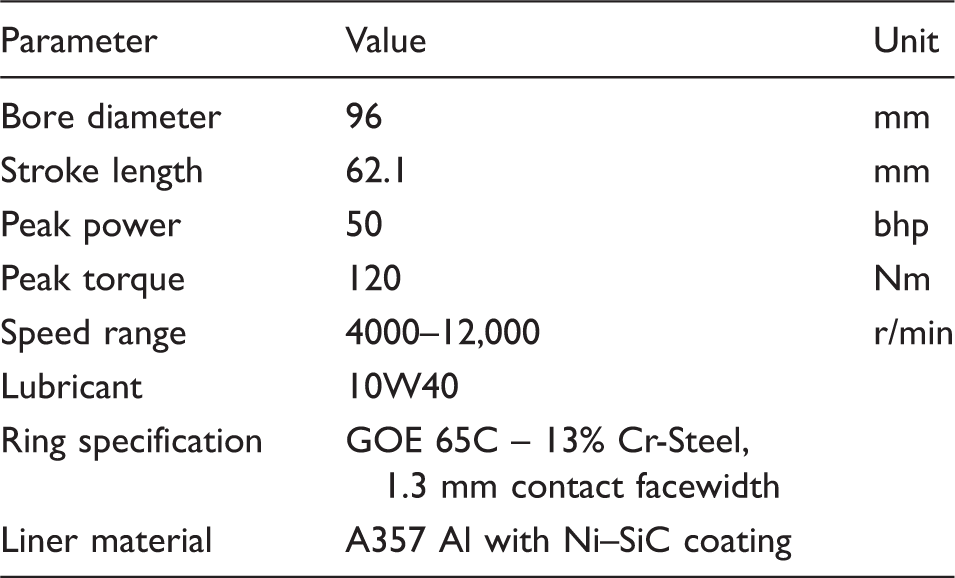
The engine was fired and resisted by a 200 kW Shenk eddy current transient dynamometer. A repeatable combined test and surface measurement procedure was undertaken, comprising initial measurement of cylinder liner topography using a Taylor Hobson precision PGI 1250 aspheric mould measurement system with a 2 µm stylus tip 155-P54469. A 20 mm region of the surface was measured down from the reversal position of the top compression ring (TDC reversal point), were mixed or boundary regime of lubrication, thus significant wear of the surface is prevalent. Measurements were taken in three circumferential locations at the piston thrust, anti-thrust and neutral sides.
The engine test procedure consisted of four 12-min periods during which the engine speed was ramped from a minimum speed of 4000 r/min, rising to a maximum of 8000 r/min, with application of 25% throttle to wide open throttle as shown in Figure 8. This testing procedure is the standard manufacturer’s test procedure for rapid running-in condition.
Cyclic engine test procedure.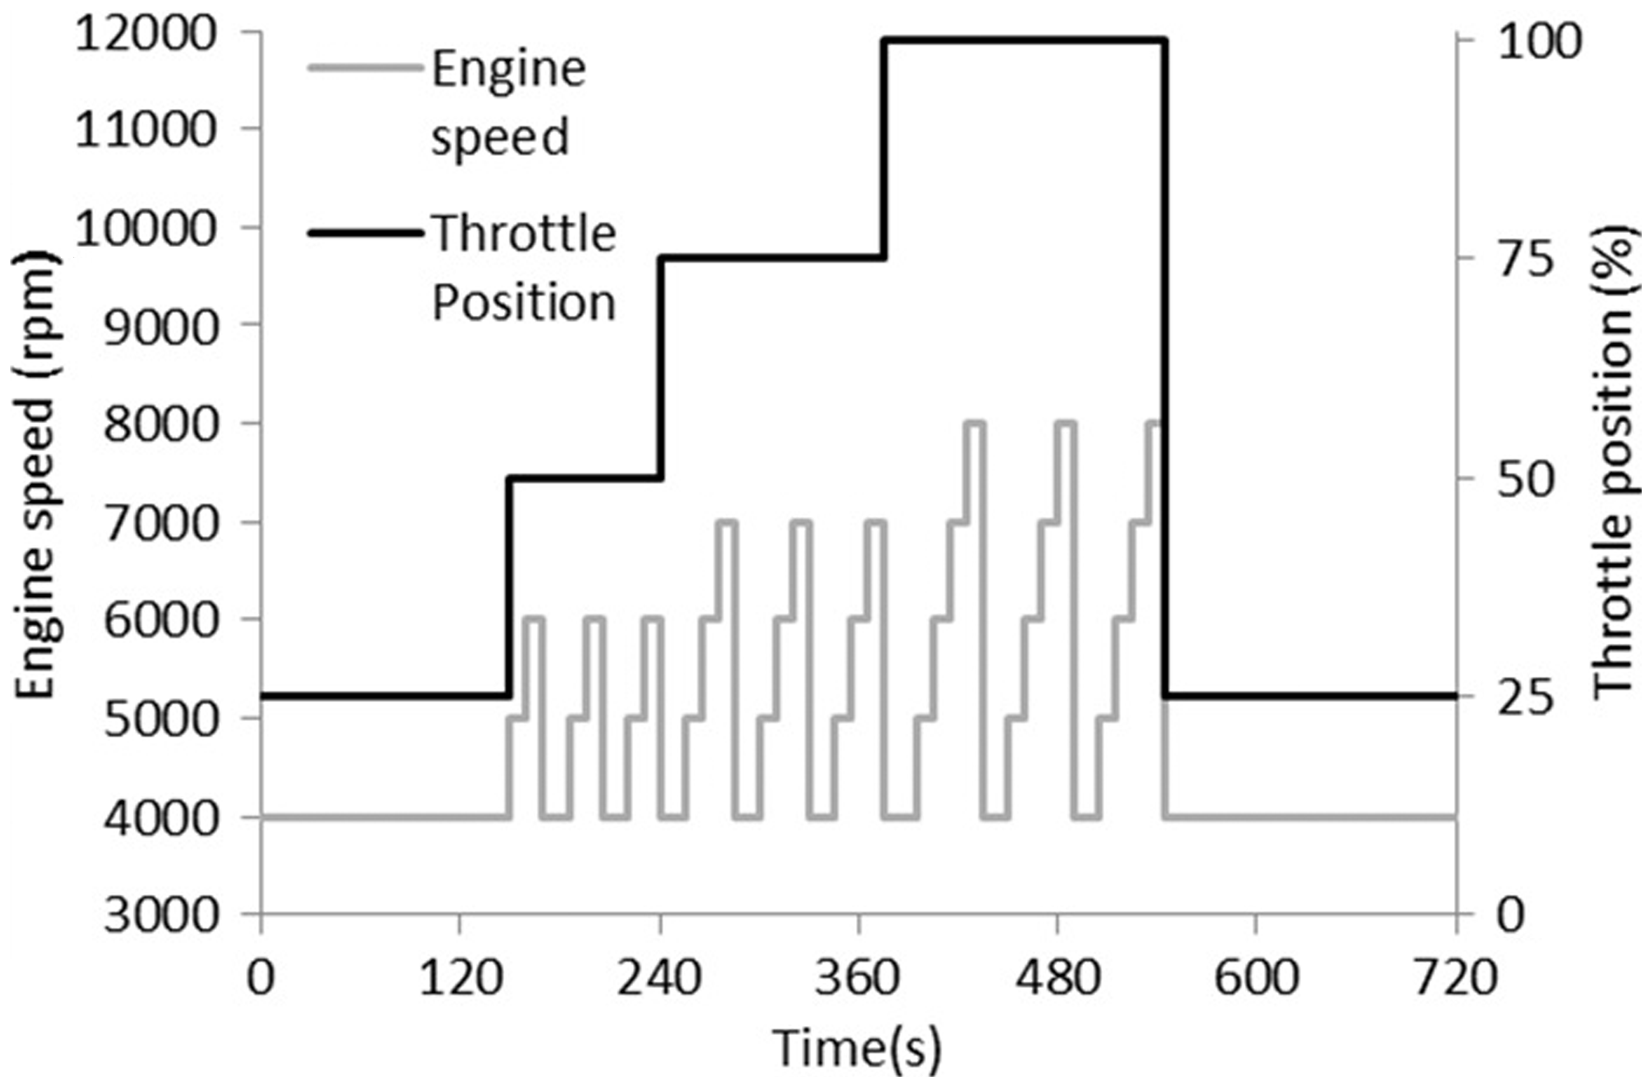
At the end of each run period of 12 min, the engine was drained and dismantled, removing the liner for measurement of evolving topography. Further, detailed information on the test procedure is provided in Gore et al. 34
Experimental engine test results
Figure 10(a) shows that the highest roughness peaks above the mean centreline of the liner topography are removed after the first engine test cycle of 12 min. In fact, this is also evident from the average reduced peakiness of the surface, Rpk (ISO 13565-1/-2/-3), which are the peaks resident upon the formed plateau created by the cross-hatch honing of the liner (Figure 10(b)). The finding here is in agreement with the aforementioned slider rig tests, where topographical stabilisation occurred after 80 reciprocations. Clearly, there have been many passes (piston reversals) in the engine test cycle of Figure 8.
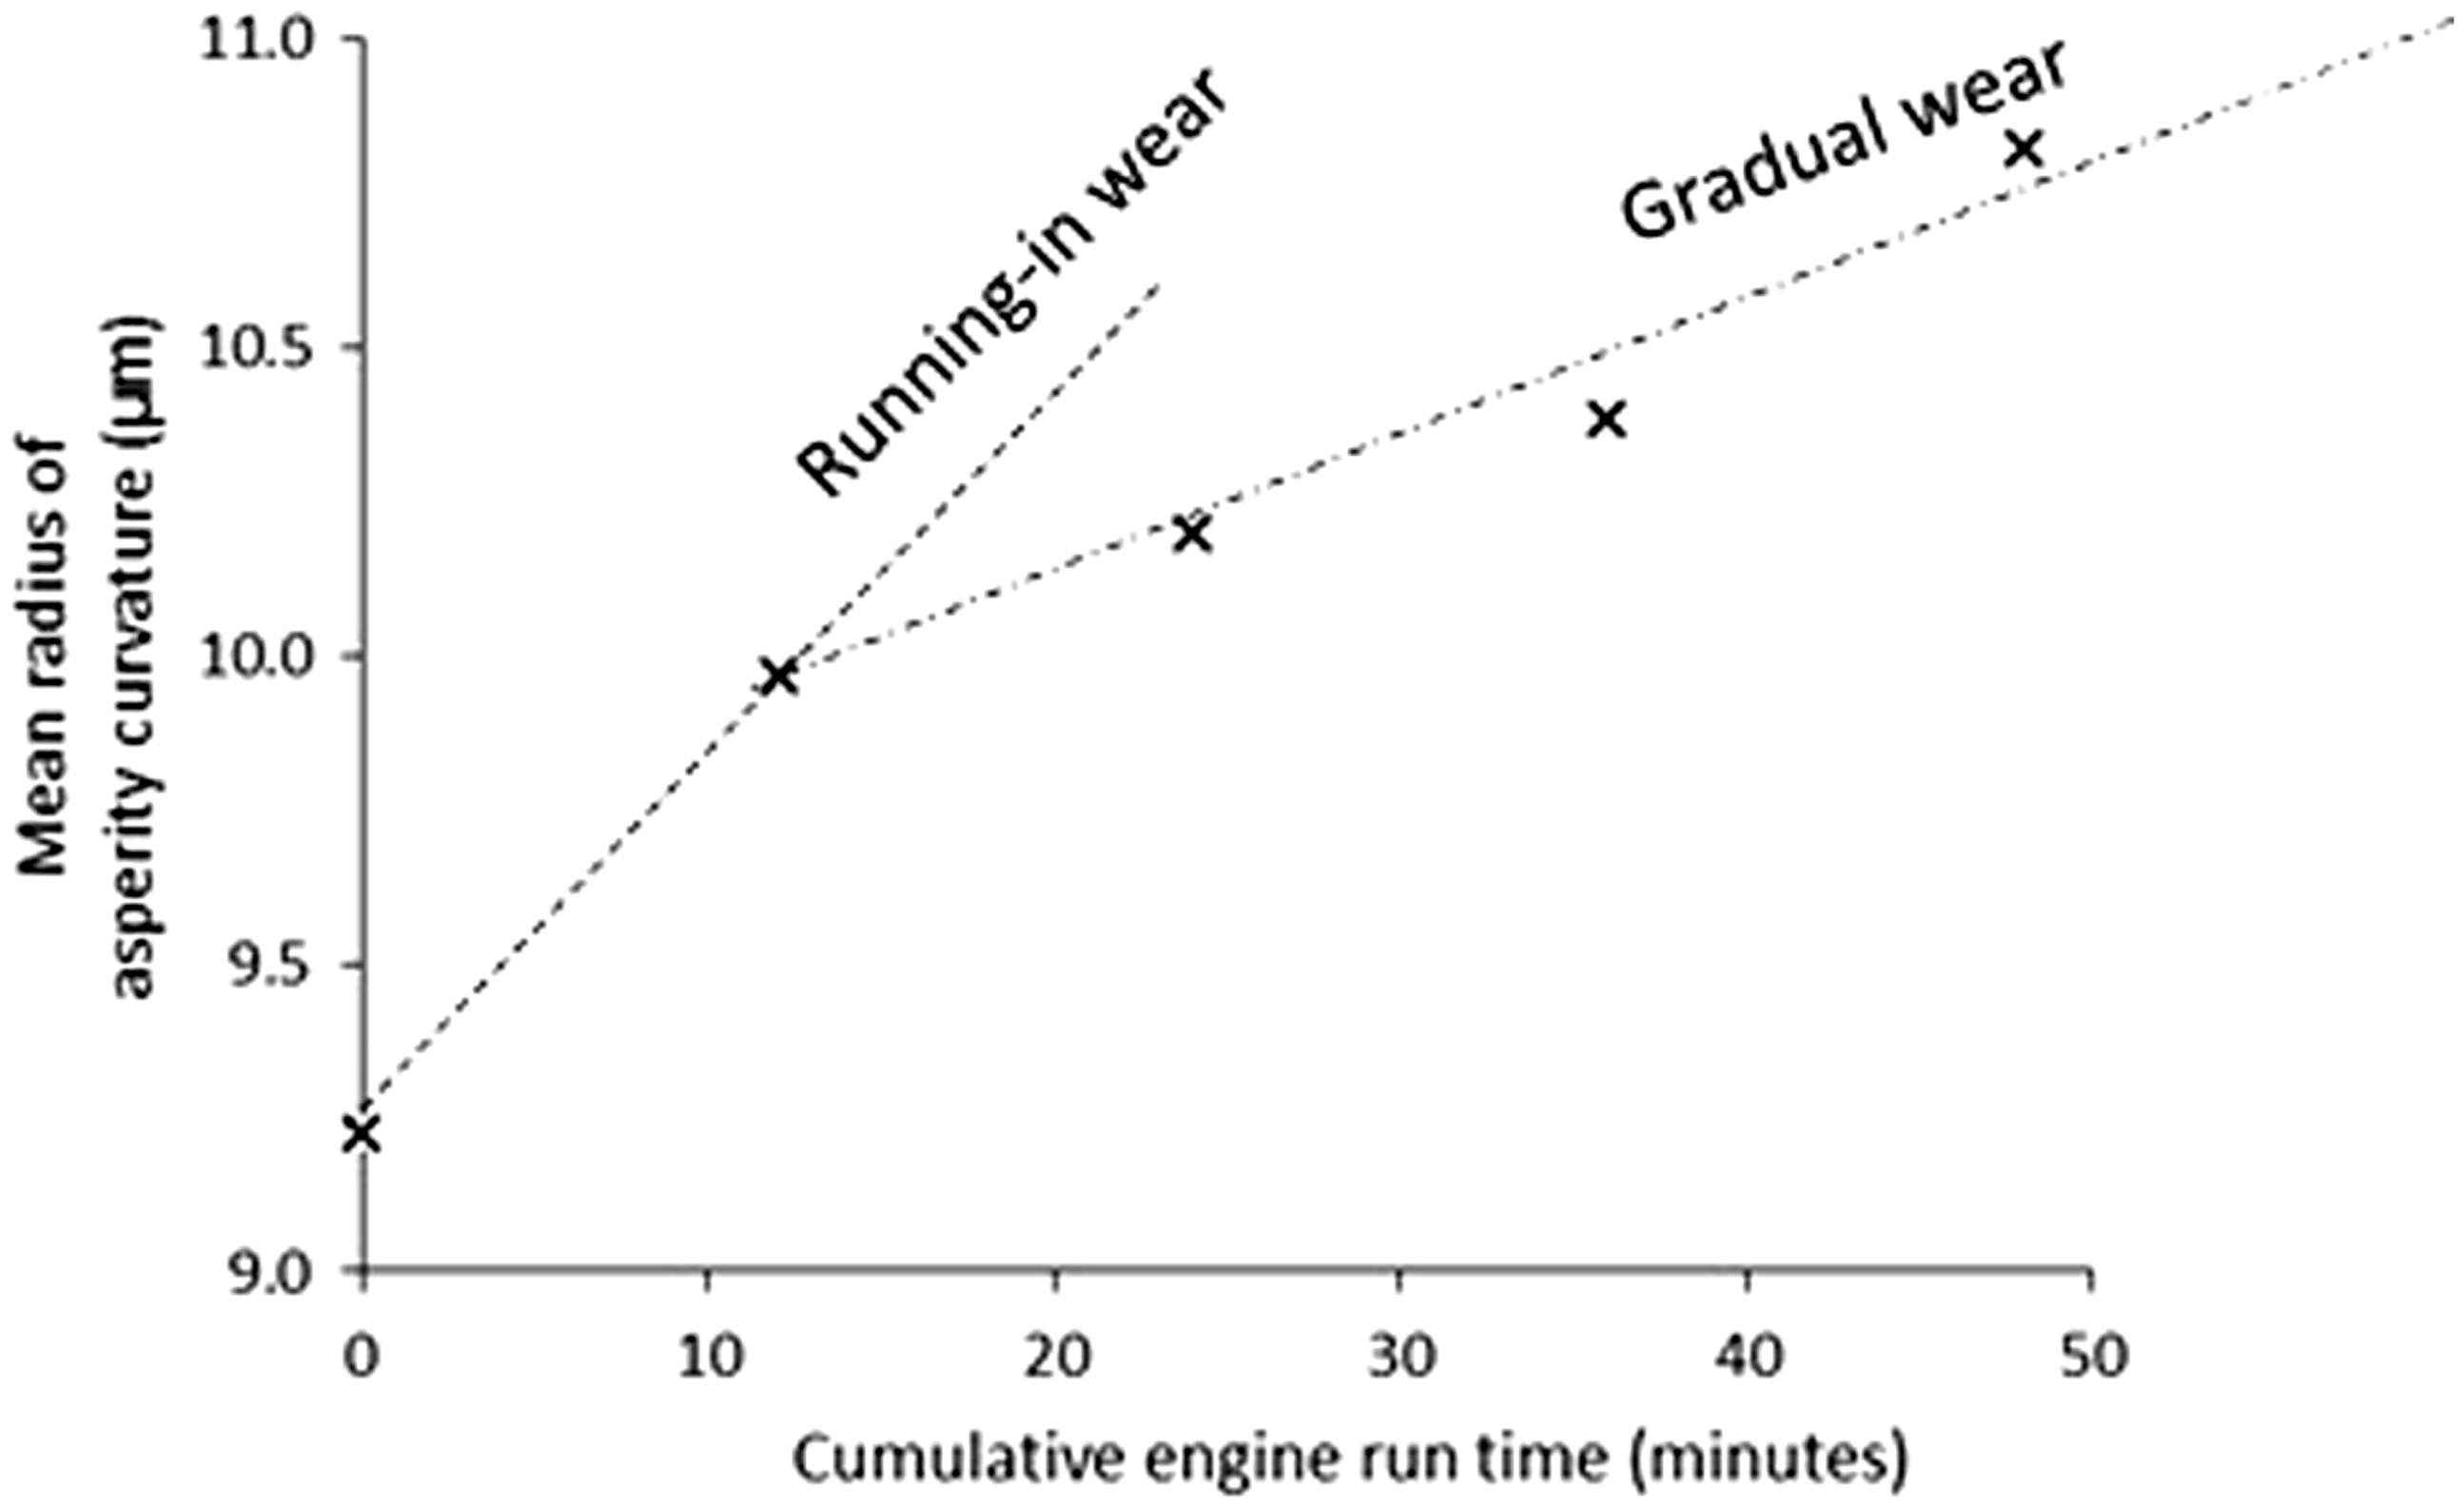
The results in Figure 9 show stabilisation of topography through removal of sharp peaks, establishing a plateau, and heralding the culmination of the running-in wear process. Figure 10 shows that in the same manner as the results of the sliding tribometer, the cylinder liner’s mean radius of curvature of the asperities also changes during the running-in process and in fact beyond it with further gradual wear.
Evolving cylinder liner topography with wear: (a) peak heights above the centreline roughness and (b) Rpk. Mean asperity radius of curvature of the liner surface.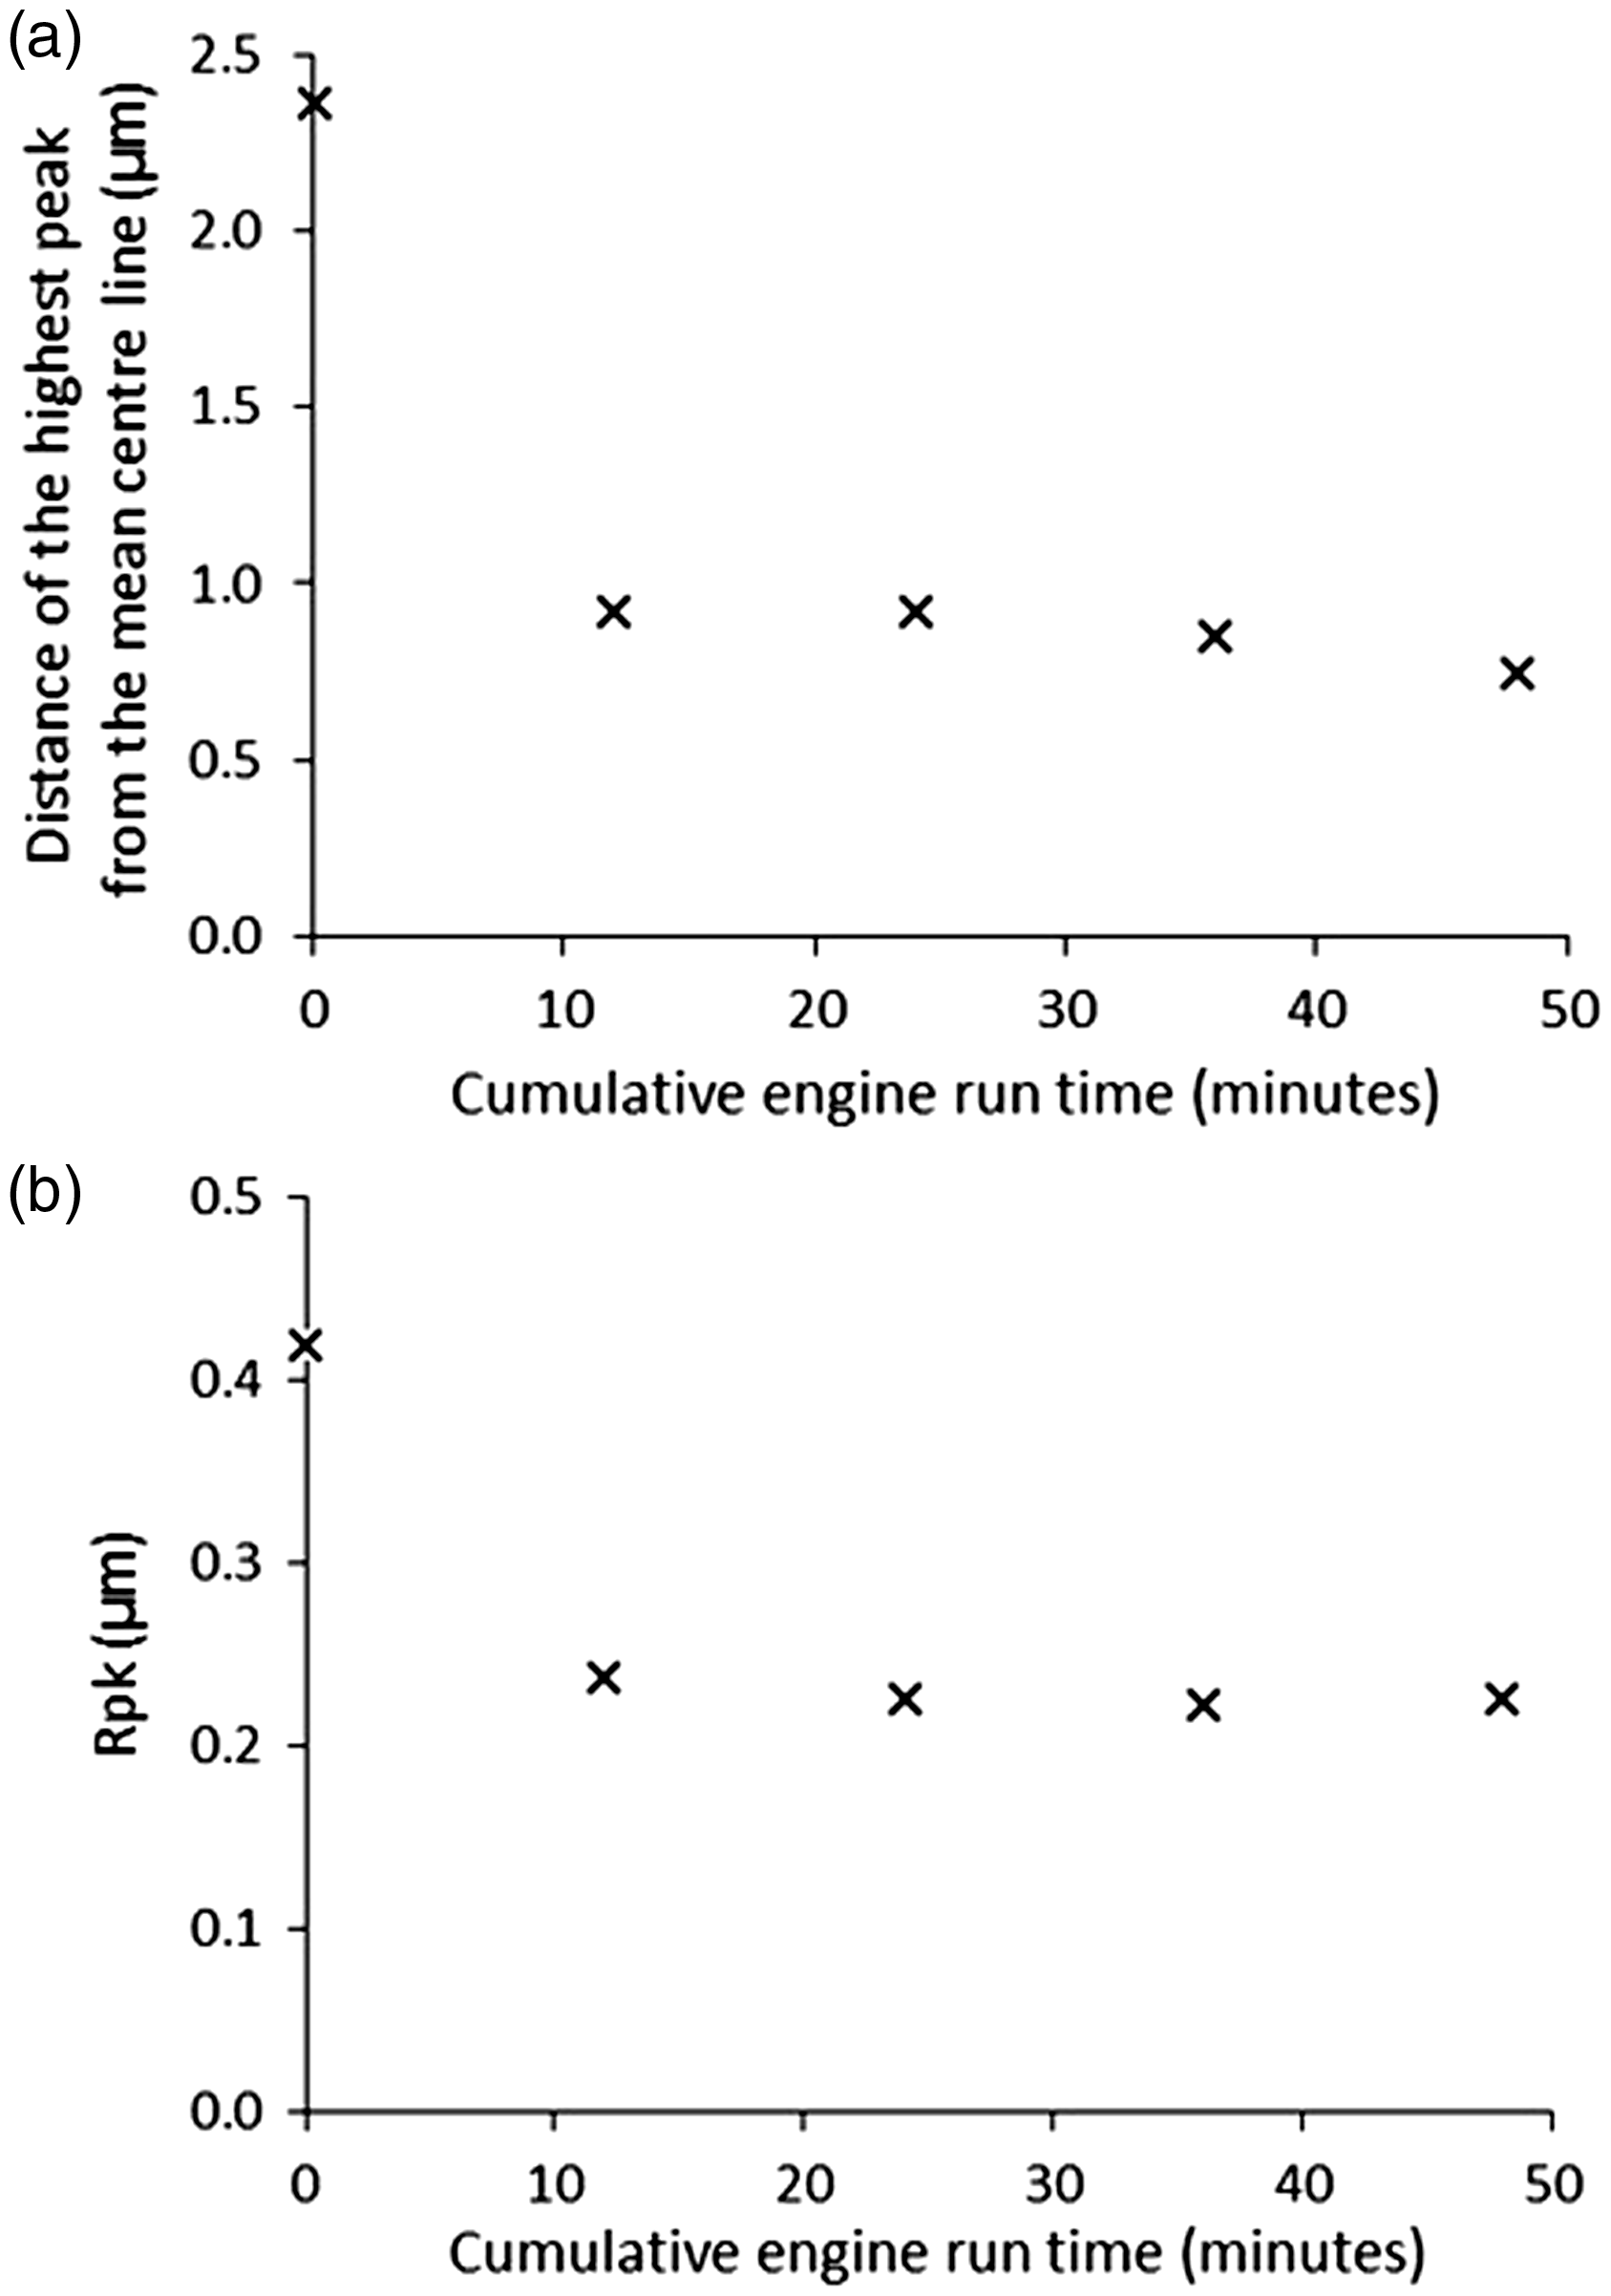
More detailed observation of various stages of wear (initial running-in and subsequent gradual wear) can be made through monitoring of the variation of asperity radius of curvature with peak height (Figure 11). The measurements were taken on the piston thrust side in this instance. Firstly, the hierarchical nature of asperity summit sharpness is evident as would be expected. This means that the highest peaks have smaller summit radii of curvature (sharper). The highest peaks for the newly machined surface have quite low radii of curvature (sharp asperity peaks). A significant change (rapid running-in wear) in surface roughness is noted after the first 12 min engine running cycle (Figure 8). During the subsequent three cycles, the heights of the highest peaks change only marginally (gradual wear). Therefore, shorter and broader asperities evolve.
Asperity radius of curvature with peak height.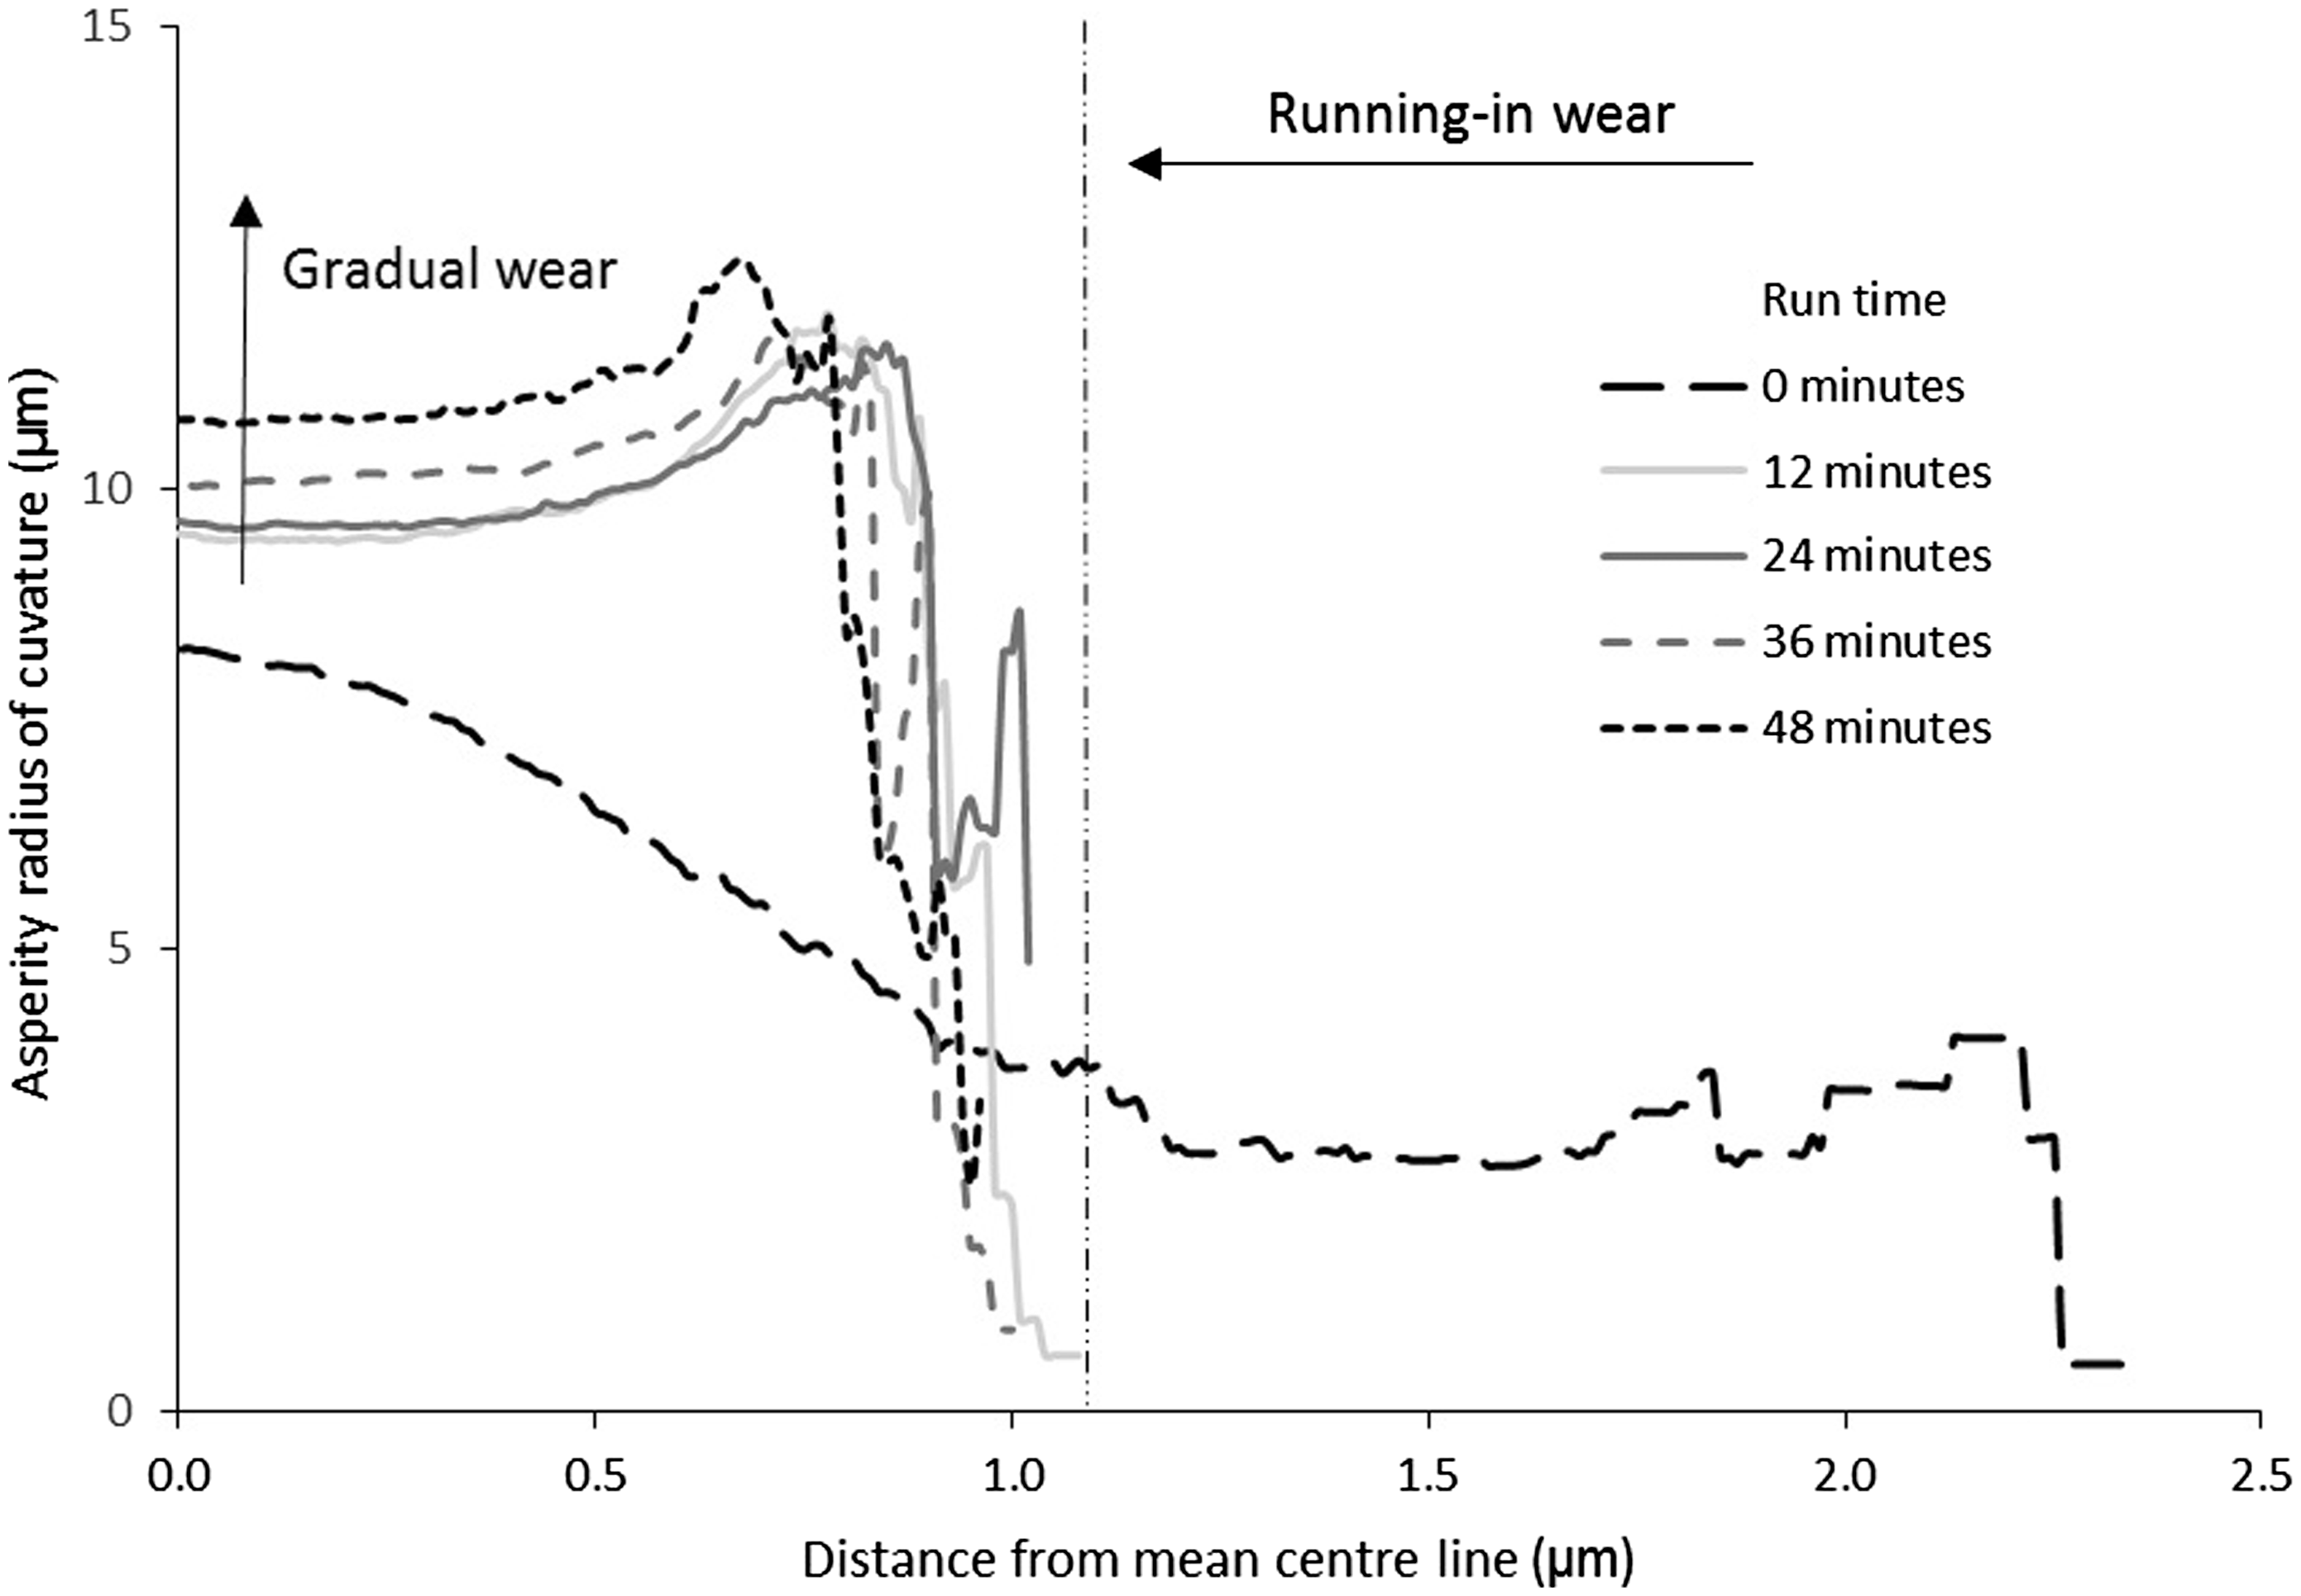
Contrary to the usual representation of cylinder liner surfaces in many tribological studies by a Gaussian distribution of asperity heights and an average peak asperity radius of curvature, the plateau honed liner surface is actually non-Gaussian, whilst new and indeed throughout the running-in and gradual wear states. This was also noted by Stout and Bovington, 35 who showed that plateau honed surfaces are characterised by a negative skewness (a measure of distribution asymmetry) value and a kurtosis (a measure of peakiness) value exceeding 3.
In fact, cross-hatched and plateau honed liners should ideally have a skewness of around -1.5 and a kurtosis exceeding a value of 5. Figure 12(a) shows that the liner surface in this study retains a skewness of approximately -1.75 from its new state throughout the engine testing process. Thus, the desired plateau nature of the surface is retained. Using a very similar liner topography, Gore et al.
34
showed that the plateau height above the mean centreline of the topography altered only marginally with reduction of Rpk as in the case of results shown in Figure 9(b). The depth of valleys (grooves) created by the honing tool through cross-hatching in Gore et al.’s
34
experiments hardly altered through testing. Figure 12(b) shows that the new (unused) cylinder liner has a non-Gaussian topography (non-Gaussian: Cylinder liner surface with engine run time: (a) skewness, (b) kurtosis.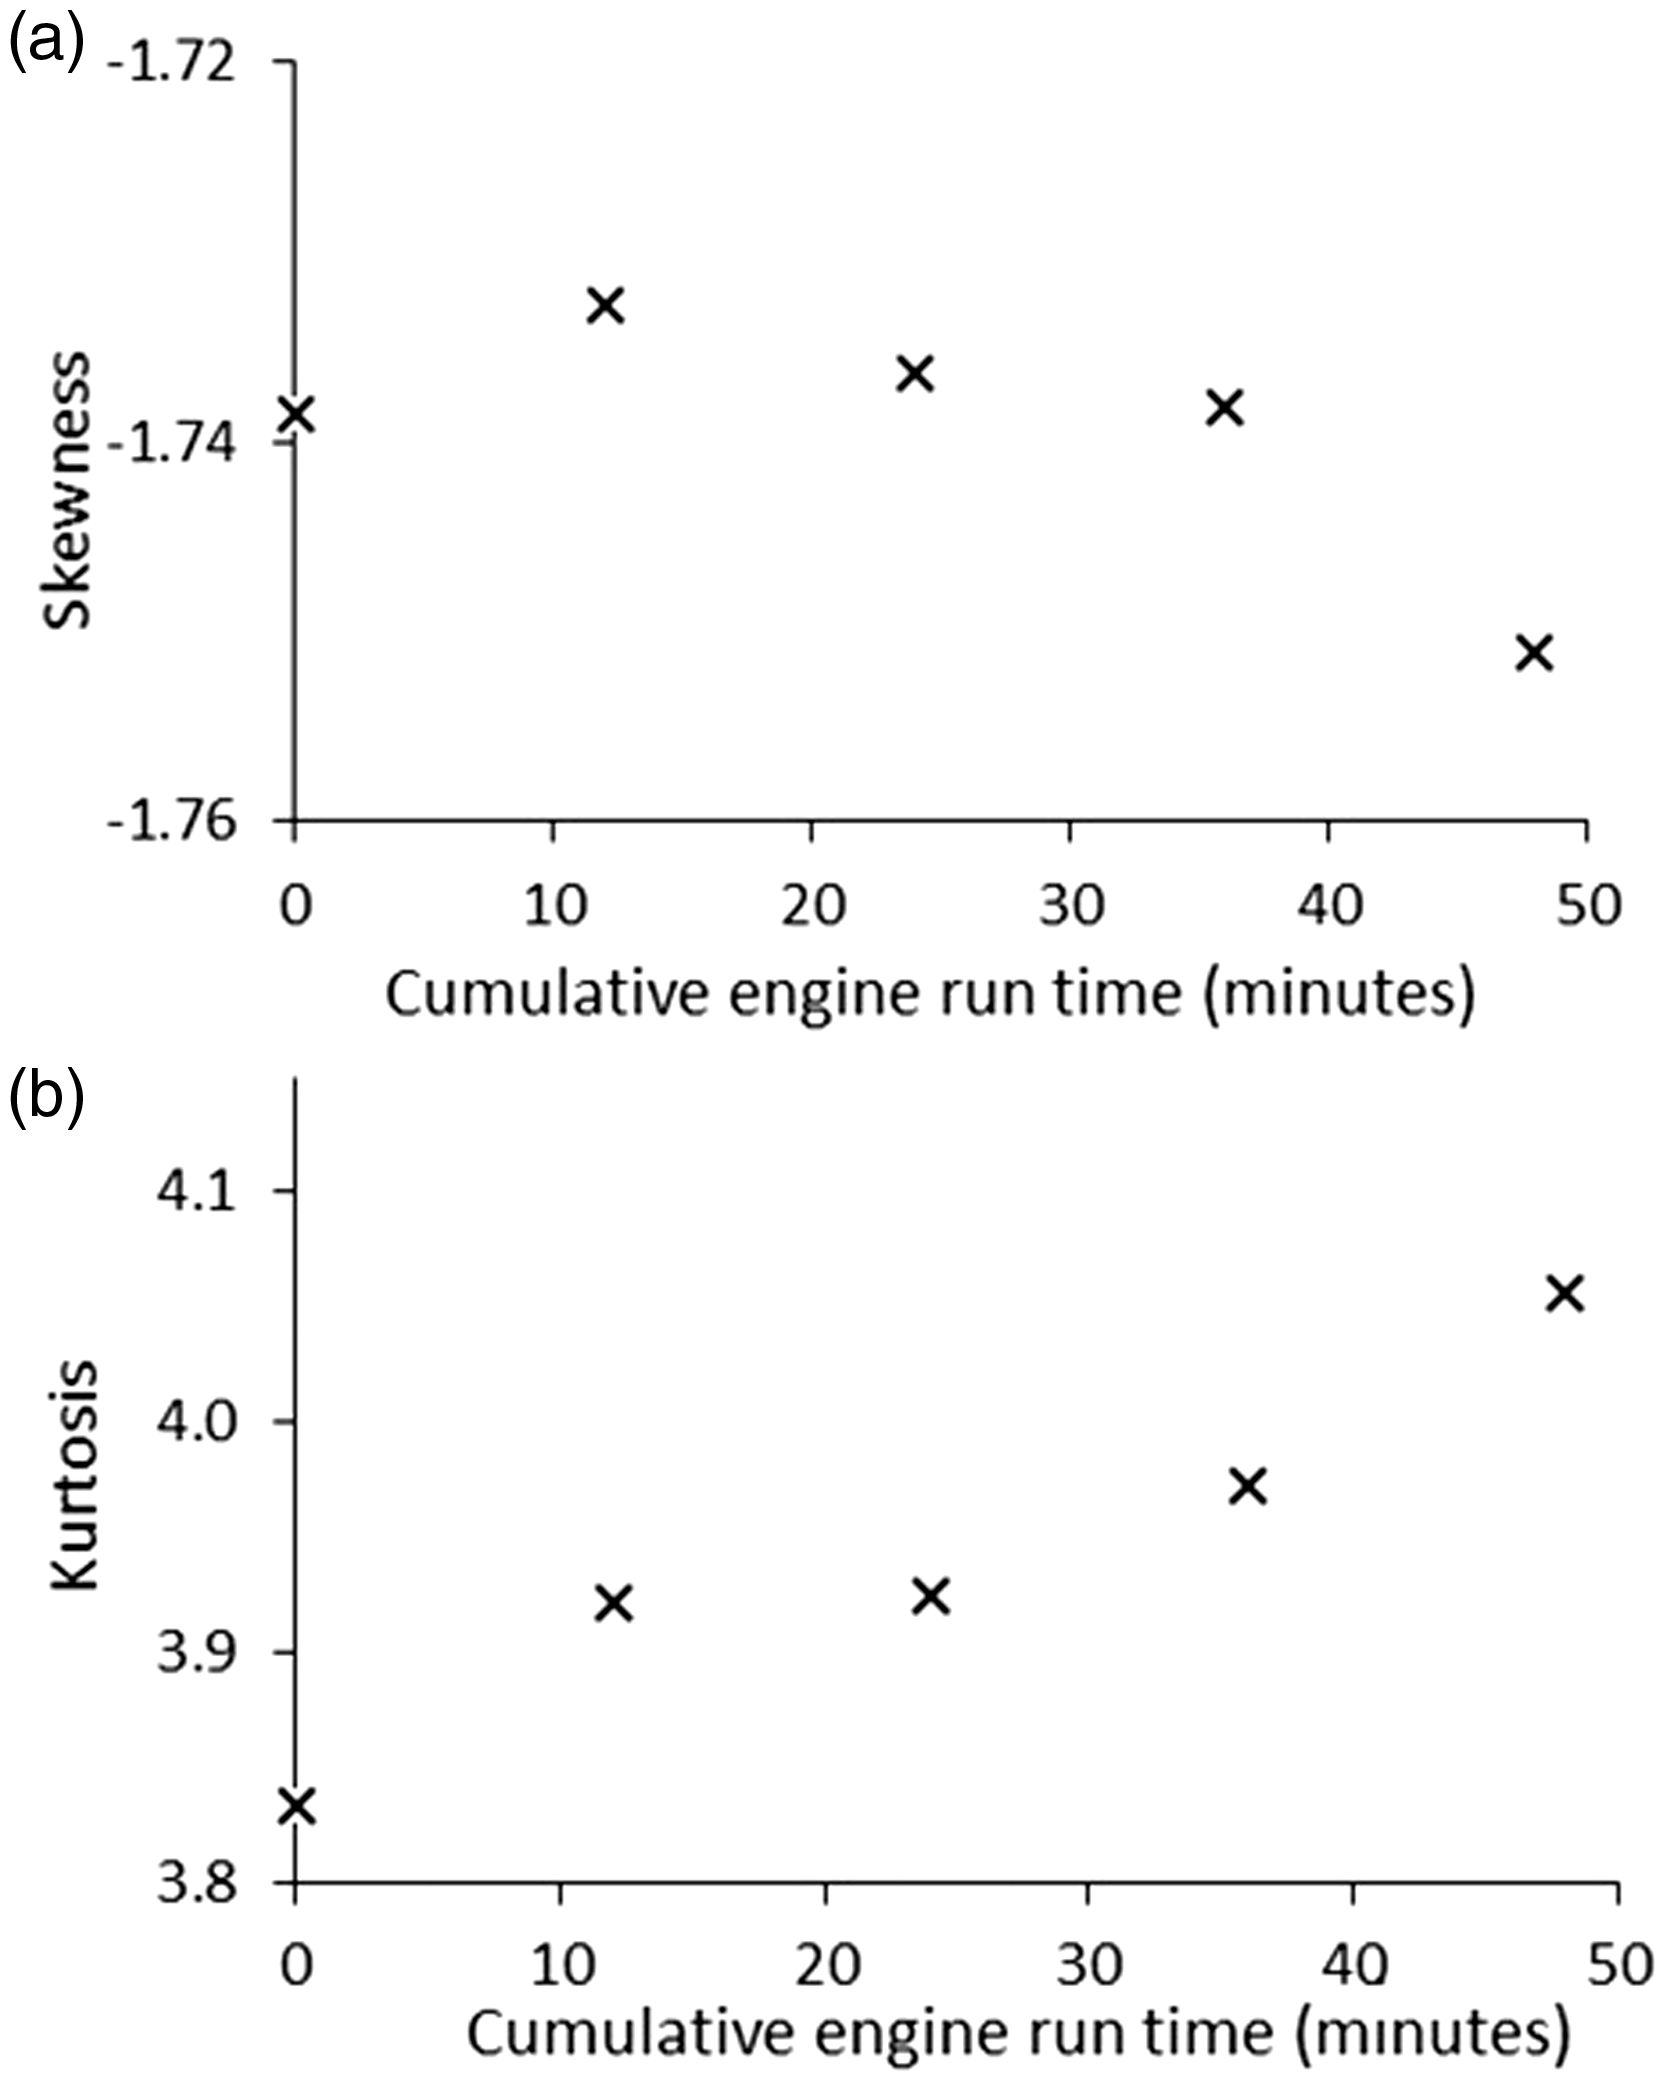
Conclusions
Variations in key topographical parameters have been shown for cross-hatch honed cylinder liner surfaces as well as flat sliding plates of similarly prepared test specimen through wear process, including running-in period and subsequent gradual wear. It has been shown that the cross-hatched honed surfaces are non-Gaussian and plateaued, thus it would be necessary to obtain surface-specific asperity distribution data to modify the asperity interaction models of Greenwood and Williamson 8 and Greenwood and Tripp, 9 which are essentially suitable for Gaussian surfaces. Furthermore, the roughness parameters, such as radii of curvature of asperity peaks cannot be represented by a mean quantity as these alter according to interaction heights and also change with the wear process. Hence, the effect of wear during the initial running-in period and subsequent gradual wear would affect any predictive analysis which is critically important in the determination of important issues such as selection of honing tools and use of any sacrificial coating. The main contribution of this paper is in providing detailed analysis of non-Gaussian surface parameters, particularly for the case of plateau honed surfaces and their evolution with wear from laboratory experiments onto fired engine tests, representative of harsh conditions experienced in the racing arena. This approach has not hitherto been reported in the literature.
Footnotes
Declaration of Conflicting Interests
The author(s) declared no potential conflicts of interest with respect to the research, authorship, and/or publication of this article.
Funding
The author(s) disclosed receipt of the following financial support for the research, authorship, and/or publication of this article: The authors would like to thank the UK Engineering and Physical Sciences Research Council (EPSRC) for the sponsorship of this research under the Encyclopaedic Program Grant (![]() ).
).