
Abstract
The proliferation of data journalism has enabled newsrooms to deploy technologies for both mundane and more sophisticated workplace tasks. To bypass long-term investment in developing data skills, out-of-the-box software solutions are commonly used. Newsrooms today are partially dependent on third-party platforms to build interactive and visual stories – but the business models of platforms are predisposed to changes, frequently inducing losses of stories. This article combines in-depth interviews and an ancillary survey to study the status quo and identify future challenges in embracing out-of-the-box and in-house tools, and their impact on Australian data journalism. Results indicate a dichotomy between commercial and public service media organisations. Commercial outlets are heavily reliant on out-of-the-box solutions to develop stories, due to a lack of skillsets and a shortage of skilled labour. By contrast, public service media are developing their own in-house solutions, which reflects their desire for the continuous digital preservation of data stories despite the challenges identified.
Keywords
Introduction
Although the field of computer-assisted reporting (CAR) dates back as far as the 1960s (McGregor, 2013), data journalism did not established itself until 2009, when The Guardian launched its prominent ‘Datablog’. In it, it broke the then widely publicised expenses scandal by Members of Parliament in the United Kingdom, asking its readers to sift through MP’s expense reports and to highlight questionable claims (Coddington, 2015; Daniel and Flew, 2010; Schapals 2020). Around that time, the developer and data journalist, Adrian Holovaty had already triggered a debate about the role of technology in journalism (Stalph and Borges-Rey, 2018). The proliferation of data journalism in recent years has enabled newsrooms around the world to deploy digital technologies both for mundane and for more sophisticated workplace tasks. Naturally, data journalism has attracted significant attention not just across the journalism industry, but also within academic scholarship. For some, data journalism is widely considered to be the ‘future of journalism’ (Knight, 2015). However, the attention given to the ‘Datablog’ also demonstrates that scholarly attention to data journalism is frequently centred on media initiatives and professionals across early-adopter nations such as the United Kingdom, the United States and the Nordic countries (Appelgren and Nygren, 2014; Borges-Rey, 2016; Parasie and Dagiral, 2013; Young and Hermida, 2015).
In this article, we argue that this limited perspective is no longer sustainable at a time when data journalism has not only established itself as an important discursive order, but has permeated contemporary news production processes across a wide range of journalistic forms and formats around the world. Therefore, this article deliberately steps outside this somewhat narrow area of study and instead develops a better understanding of how, specifically, the technological limitations, possibilities and business models of out-of-the-box solutions commonly deployed in data journalism practice, including Infogram, Carto, Datawrapper and Tableau, affect the production and archiving mechanisms for major data-intensive stories (Broussard and Boss, 2018) in the still under-researched case of Australia, as well as how such solutions compare to those developed in-house.
Therefore, this article contributes to a new wave of data journalism scholarship in two ways. First, to a substantial degree, news media today depend on the use of third-party tools in building interactive and visual stories – tools whose evolving business models produce changes to their information architecture, leading to a gradual loss of data stories. The infrastructure of these technological tools, which we refer to as out-of-the-box solutions, is crucial in fostering the production of data-intensive stories among journalists without prior knowledge of coding techniques. Second, the reliance on these companies also fosters questions about the infrastructure and ownership of the archives of such content, affecting both future scholarly study and continued accessibility of these stories by the general public. To avoid reliance on these tools, some publishers are either establishing their own in-house solutions or outsourcing to non-media actors (Stalph and Borges-Rey, 2018). Greater understanding of these processes may help us understand and explain the dependency on third-party platforms to produce data stories, an issue which has yet to be addressed in scholarship. Given this gap in the literature, this study poses the following research questions: (1) How are out-of-the-box solutions embedded in data journalism practice in Australia? and (2) What challenges does the reliance on third-party tools produce?
This article relies on a mixed-methods approach to study the status quo and identify future challenges in the adoption of out-of-the-box and in-house tools, to shed light on how they, respectively, impact on the practice of data journalism in Australia. First, all major data-intensive stories produced by established Australian news organisations between January 2017 and May 2018 were retrieved and reviewed to establish an overview of how many were still accessible (even if such access was restricted by paywall), despite the aforementioned challenges caused by their changing information architecture. Second, the study presents 18 semi-structured, in-depth interviews conducted in early 2018 with Australian media practitioners, all of whom have played major roles in the reporting, design and presentation of major data journalism stories. In addition, a questionnaire circulated to Australian data journalists informs our understanding of both the benefits and disadvantages of the usage of out-of-the-box and in-house tools, respectively. In sum, this article sets out a forward-looking agenda for the use of out-of-the-box and in-house solutions to aid our understanding of how both affect the practice of journalism. Finally, the article concludes with an agenda for future research.
Literature review
Data journalism in Australia: the status quo
Data journalism began to establish itself as a recognised field over a decade ago, when in 2009, The Guardian reported the expenses scandal by Members of Parliament in the United Kingdom (Coddington, 2015; Daniel and Flew, 2010). Arguably, as a result, the availability of data-intensive stories has increased greatly – followed by other successful cases, with the New York Times’ ‘Ebb and Flow at the Box Office’ as another prominent example (FlowingData, 2009). Specifically, data journalism encompasses compiling, cleaning, providing context for and combining data in order to communicate it to a news audience (Bradshaw, 2007; Weiss and Retis-Rivas, 2018). This practice allows media organisations to scrutinise data, which have become a lot more accessible, and to produce visual content more seamlessly than before (Flew et al., 2012). Yet, the application of data in news reporting is not new (Segel and Heer, 2010): in fact, data journalism is an extension of CAR, which rose to prominence in the 1950s, when surveys, content analyses and statistics were used to validate journalists’ questions (McGregor, 2013). This technique was further popularised by Phillip Meyer, considered to be the father of CAR and one of the first journalists to use computers for investigative journalism in the United States. His investments in this area were fundamental to rethinking journalism and the production of news (Coddington, 2015; Ojo and Heravi, 2018). Despite this, until recently, scholarly focus on the discipline of data journalism has centred on professionals’ perceptions and media initiatives in early-adopter nations such as the United Kingdom, the United States and the Nordic countries (Appelgren and Nygren, 2014; Borges-Rey, 2016; Parasie and Dagiral, 2013; Young and Hermida, 2015).
In the last few years, interest in the development of data journalism and the impact of data beyond the American and European contexts have grown (Mutsvairo, 2019; Wright et al., 2019). This is particularly evident in the Global South, where the challenges and opportunities of producing data stories have attracted a great deal of attention in academic scholarship (Mutsvairo et al., 2019), due to the social and developmental challenges facing these countries. In Africa, non-profit organisations are negotiating with media organisations to advance the development of data journalism. Consequently, the practice manifests in different forms of collaboration between publishers and civic tech groups, as a result of the friction between journalistic and civic goals (Cheruiyot et al., 2019). A different scenario is encountered in Argentina, where there is an effective participation by the public in news production, positioning La Nacion as an example of success in collaborative data projects carried out in Latin America (Palomo et al., 2019).
In the Asia-Pacific region, further nuances were brought to light by scholars: in India, the presence of ‘external and internal bottlenecks’ (Kashyap et al., 2020: 121) challenges the evolution of the practice in the country. Similarly, Pakistan suffers from poor investment in news organisations and lacks the ability to access accurate data, which presents obstacles to the development of data journalism (Jamil, 2019). In China, researchers explored the diffusion of data journalism as an innovation that initiated in portals and was only later taken up by traditional and new media. The lack of motivation is one of several obstacles that delay an expansion of the practice in the country (Zhang and Feng, 2019). In the same vein, Australia has also faced some hurdles in the development of data journalism. Wright and Doyle (2018) identified ‘a decline in larger projects and in exploratory dashboards, as well as in the number of active data journalists in Australia’ (1811), thus calling for novel ways to deliver data stories to the audience.
Nonetheless, investment in data journalism is now comparatively high across major, legacy news organisations, generating high-quality content that engages audiences and cements the organisations’ reputation. While these leading publishers are successful in producing data-intensive stories, other news organisations with fewer resources are struggling to develop data journalism teams at their newsrooms, due to overall declines in investment and workforce (Lewis and Nashmi, 2019: 7) even before the impact of the COVID-19 pandemic. Crucial to this, the advent of novel technological tools allowed newsrooms to apply data science to journalism, thus enabling them to extract ‘knowledge from data’ (Howard, 2014). Furthermore, the availability of open data and the development of a digital economy together with sophisticated software were essential to adding another dimension to the robust offering of data journalism projects (Flew et al., 2012). Thus, a range of tools have become available to support journalists in the development of data stories – ranging from effective data scrutiny to sophisticated data visualisations. Such solutions are particularly useful for newsrooms that lack institutional backing – not least because these tools offer free or inexpensive versions that enhance the digital and data capabilities of teams working in data journalism.
However, while democratising data skills and enhancing data storytelling, these solutions also take control of the content, and data journalists end up ‘playing in someone else’s sandbox, according to their rules and whims’ (Young et al., 2018: 127). Such tools have also attracted widespread criticism for their limited affordances – ranging from ‘relatively unsophisticated’ functionalities (Tabary et al., 2016: 81) to merely ‘basic sharing functionality’ (Wright and Doyle, 2018: 1814). Over the years, well-resourced outlets such as The New York Times and the Globe and Mail have started to devote more attention to developing their in-house tools (Hermida and Young, 2019). This has resulted in the emergence of data desks to train and strengthen the skillset of staff familiar with the technology (Rogers et al., 2017).
Beyond such criticism, a more nuanced approach recognises that the emergence of out-of-the-box solutions democratises and promotes data journalism to less-resourced news outlets that would otherwise lack the necessary resources (Hermida and Young, 2019); this is particularly true in Australia. Following an extended period of redundancies across the Australian media landscape since the late 2000s, and the ensuing emergence of novel players in the field, there was initial optimism: this included the rise and expansion of BuzzFeed in several countries in early-2010, including Australia, leading many to believe that continuous declines in revenue and downsizing in newsrooms could be overcome (Burgess and Hurcombe, 2019; Wu, 2016). However, these developments were not sufficient to offset the impact of job losses. Further jobs were lost in Australia in 2012, which affected all three major commercial media outlets, Fairfax Media (now Nine), News Limited (now News Corp Australia) and Network 10 (Ricketson et al., 2019); the severe economic downturn resulting from the COVID-19 pandemic produced a new wave of job cuts and newsroom closures, including the shutdown of BuzzFeed Australia’s news operation.
For data journalism, this has meant that news organisations have relied on third-party providers to assist with their reporting (Ojo and Heravi, 2018) – and even less-resourced publishers began using new approaches to produce data-intensive stories. Specifically, this included the use of out-of-the-box tools: ready-made software or platforms that match data journalism’s needs but would otherwise require a special development effort (Nordheim and Päivärinta, 2006). Also known as ‘off-the-shelf’, these tools do not require practitioners to have pre-existing knowledge to create visualisations or engage in sophisticated data analysis. Such solutions are provided by third-party companies that are not directly engaged in the process of news production. These platforms include, but are not limited to, Carto, Datawrapper, Infogram, Mapbox and Tableau, among others (Ojo and Heravi, 2018).
Archiving data stories
Crucially, these platforms take on the form of digital intermediaries for publishers and audiences, generating a benefit for news outlets by allowing them access to analysis and visualisation expertise that they do not have or are unable to develop in-house. These dynamic features are essential for enabling an organisation to continuously reconfigure its competences to address innovation in the newsroom (Ekdale et al., 2015). However, the start-ups that produce these tools are frequently subject to mergers and acquisitions, as seen most recently in Tableau’s acquisition by Salesforce (Turner and Yang, 2019). Where such organisational changes spell the end of a software product line, important works of data journalism may disappear from news websites. Studies have shown that this is a recurring problem in data journalism projects (Boss et al., 2019; Broussard and Boss, 2018; Hermida and Young, 2019).
Many of these platforms do not offer ways of archiving stories in a way that would keep them accessible to audiences in the long term. Therefore, digital preservation efforts are necessary to capture the history and development of data journalism (Rosenzweig, 2008). Thus far, research shows that the public has little to no access to visual or other multimedia archives across newspapers (Hansen and Paul, 2015). In fact, to date, web archiving efforts are merely capturing a snapshot of these webpages without the rich and interactive content they contain, unless maintained by the proprietors of such content (Weber and Napoli, 2018). In addition to these efforts, stories would have to be archived in the same look, feel and functionality as the stories created by the news outlet; thus, if archives are not saved appropriately, users will be unable to access the dynamic, multimedia elements embedded in them (Broussard and Boss, 2018).
The key challenges associated with the creation of such archives include completeness, the storage of dynamic data, changes in programming languages and the costs of preserving content, making it harder to digitally preserve data-intensive stories for the long term. In addition to these challenges, the rise of paywalls creates a barrier to web crawling, which only complicates the archiving process further (Broussard and Boss, 2018; Weber and Napoli, 2018). The programming languages that lie beneath these pages have also undergone a constant evolution, resulting in technological challenges that are exacerbated by the limited attention by news organisations or start-ups to the digital preservation of data stories (Weber and Napoli, 2018).
Diffusion of innovations: out-of-the-box solutions and their use of freemium business models
The multi-faceted upheaval facing journalists and news organisations has three interrelated dimensions: technological, relational and cultural. Findings suggest that technological change faces the fewest barriers, as journalists are more readily convinced of its benefits (Ekdale et al., 2015). There have been many studies explaining changes in the news industry using theoretical perspectives as distinct as organisational development theory (Gade, 2004) or actor-network theory (Anderson, 2013).
Rogers (2003) identifies five stages in the adoption process for new technologies: among these stages, two are in the initiation phase of diffusion, and the others in an implementation phase. The first phase (1) consists of agenda-setting, or identifying organisational problems and observing a need for innovation, which is followed by the matching step (2) that involves applying innovation to the observed problem and outlining an implementation process. The third phase (3) is the implementation of organisational innovation, which results in a change of process that is tailored to fit the organisation’s particular requirements, which are generally changed in the process. Fourth comes the clarifying process (4), which happens when an innovation attains a more generalised application throughout the business, and its contextual meaning becomes clearer to adopting individuals. The final step (5), routinising, happens when the innovation is consolidated into regular activities (Ekdale et al., 2015). In line with such adoption processes, organisations are having to innovate their business models to adapt and remain sustainably competitive. Newsrooms are still struggling to achieve sustainable revenue sources, ranging from sponsored content to paywalls. In fact, ‘technology innovation has been a key issue in the designing of a business model once it is the core of the business in digital journalism’ (De-Lima-Santos and Zhou, 2018: 127).
In the early 2000s, the hosting platform for image, video and web services, Flickr, emerged as one of the most prominent Internet business models from the revolution brought about by technology innovation. The platform created a business model known as ‘freemium’, a portmanteau of ‘free’ and ‘premium’. In the words of the former managing partner at venture capital (VC) firms, Wilson (qtd. in Schenck, 2011),
Give your service away for free, possibly ad supported but maybe not, acquire a lot of customers very efficiently through word of mouth, referral networks, organic search marketing, etc., then offer premium priced value-added services or an enhanced version of your service to your customer base.
This business model is based on a pricing structure by which basic functionalities are free, while access to advanced features entails a payment to be made (Xu et al., 2018). Its prevalence among software enterprises and Internet start-ups has encouraged other companies to use this model to be profitable. Skype, for instance, offers network voice for free as a basic feature, but calling mobile or landline numbers when out of network is a premium service for which customers need to pay. LinkedIn, however, allows its users to access a variety of services with their professional connections, but demands a subscription fee in order to message people who are not part of the users’ existing network (Schenck, 2011; Seufert, 2014; Teece, 2010; Zhang et al., 2016).
Currently, research suggests a high likelihood for vendors to transform their free users into paying customers once accustomed to a specific service (Seufert, 2014; Teece, 2010). The freemium business model relies on a certain percentage of users seeing sufficient value in an enhanced version of the product or service to pay for it, thereby effectively subsiding the cost of the basic functionalities offered by the service provider. Transferred to the news industry, today, publishers fall back on the use of third-party platforms to produce interactive and visual stories, whose freemium business model attracts news outlets and journalists through the initial sampling of basic functionalities, while later convincing them to pay for more advanced capabilities (Teece, 2010). The infrastructure of these technological tools, which we categorise as out-of-the-box solutions, is crucial in democratising the production of news to non-coder journalists without compromising journalistic integrity or the quality of data-driven visualisations. If a strong functional fit between the free version and the paid associated service is established, non-paying users are encouraged to upgrade to premium features. The potential for free initial exploration is particularly attractive to the journalism domain, one long characterised by a sense of crisis and deficit (Wagner et al., 2014 as cited in Xu et al., 2018) – yet, the need to switch to a premium subscription to ensure long-term use and preservation means that the initial savings may only hide the longer term costs.
Given these opportunities and limitations, embracing such services has its costs and benefits. On one hand, out-of-the-box solutions have the potential to empower journalists, designers and news developers alike while democratising the immense power of data visualisation, enabling non-experts to create data stories quickly and easily. On the other hand, news outlets and their staff are thus locked into a reliance on these third-party services. As such, this necessitates studying the challenges brought about by the adoption of out-of-the-box and in-house solutions in shaping journalistic practice.
Method
To address the adoption of out-of-the-box and in-house tools in data journalism, this article relies on a multi-method approach. This research project was designed to understand the status quo and future challenges in the adoption of these solutions to shed light on how they, respectively, impact on the practice of data journalism in Australia.
First, all major data-intensive stories produced by established Australian news organisations between January 2017 and May 2018 were retrieved from specific data sections or by-lines of data journalists on key news sites to identify the tools used, and to establish an overview of how many were still freely and fully accessible in light of the digital preservation challenges. The authors searched for professionals who were or are working with data journalism in Australia, as identified through the commercial contacts database Cision and the professional networking service LinkedIn. We then followed a snowball sampling method, which included relying on the recommendations of initial contacts, as the data journalism community is known for its collaborative nature (Lewis and Usher, 2013). In total, 299 data stories from ABC News, Fairfax outlets (as of 2018, Nine Publishing), The Guardian, SBS News and News Corp outlets were recorded. Building on a study by Ojo and Heravi (2018), which developed a typology to identify patterns in the award-winning stories for Data Journalism Awards from 2013 to 2016, it was possible to trace a variety of technologies employed by these news outlets to produce visually appealing, data-intensive stories. Among these technologies were some of the aforementioned and widely referenced tools, such as Infogram, Datawrapper and Tableau.
Second, this study presents semi-structured, in-depth interviews with Australian media practitioners conducted between February and May 2018, all of whom have played major roles in the reporting, design and presentation of these data journalism stories. We established an initial list of media outlets and professionals working with data journalism. From this, we developed a shortlist that included the names of 20 professionals (journalists, designers and programmers related to the discipline of data journalism); we contacted these through email. Of the 20 identified journalists, 18 agreed to take part in the project; these included current or former employees of media organisations based in Australia, as shown in Table 1. Their uneven distribution across news organisations is due to the different team structures in these organisations, variously drawing on larger, hybrid teams or individual journalists who are responsible for more than one activity in the production of data stories.
Number of interviewed professionals working with data journalism in Australia.
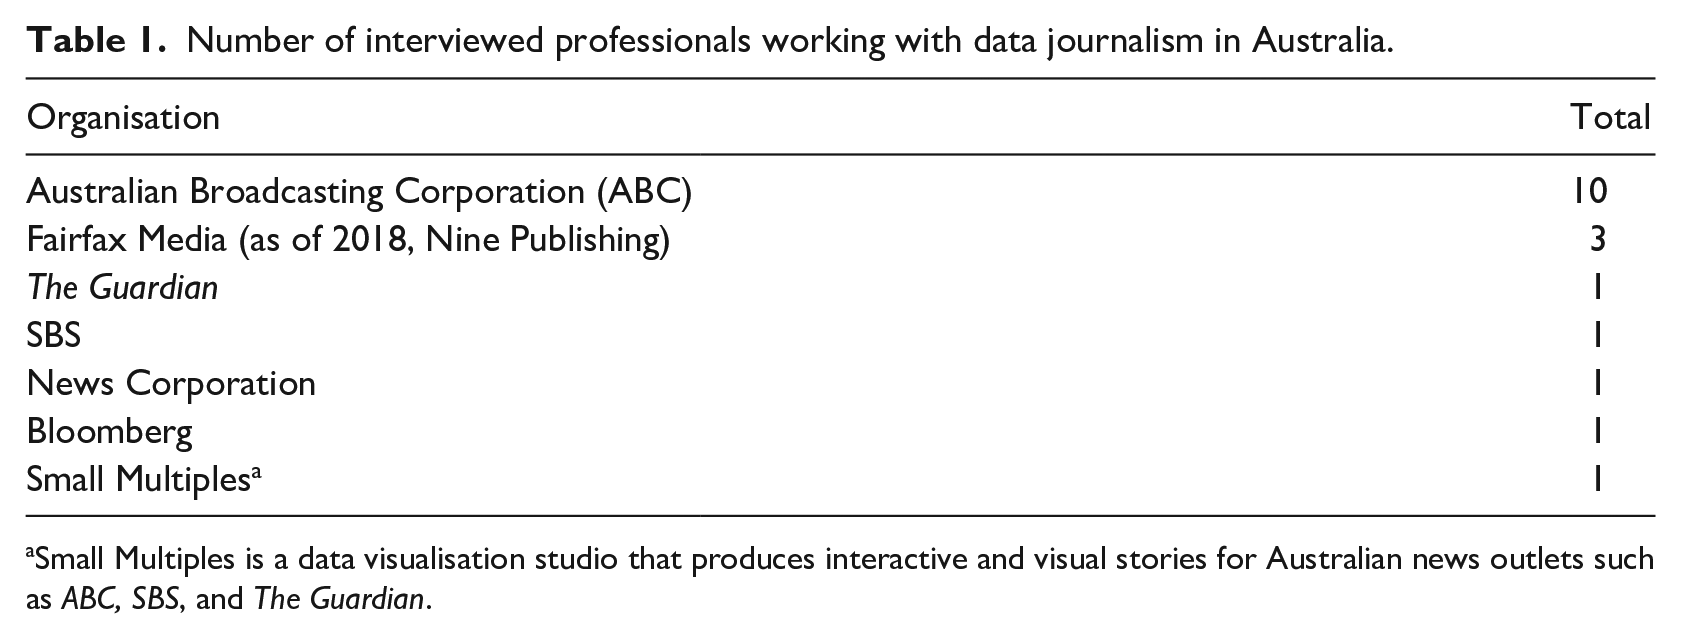
Small Multiples is a data visualisation studio that produces interactive and visual stories for Australian news outlets such as ABC, SBS, and The Guardian.
Finally, based on the literature review and the results of the interviews, an ancillary questionnaire was circulated to data journalists in Australia in early 2019 to further explore their understanding of both the benefits and disadvantages of using out-of-the-box and in-house tools. We sent this questionnaire to respondents to allow them to express ideas they had not mentioned before. The online questionnaire included open- and closed-ended questions that addressed the adoption of these tools in relation to data journalism practice. The questionnaire was shared with those professionals who were shortlisted for an interview, as well as the remaining professionals appearing in our longlist. In total, this included 36 professionals. Using the prominent #ddj hashtag, the survey was also circulated on Twitter, where it was retweeted by several journalists. The survey was also posted in a Slack group called ‘Stories with Data’, which is frequently used by data journalists.
In total, 16 participants from different news organisations and different levels of seniority in their respective organisations took part in the survey. These included four developers, three editors, three data journalists, two journalists, two designers, one head of social media and audience engagement, and one freelance journalist. Overall, this survey was used to provide complementary data about the use of these tools by actors involved in the production of data stories. As interviews ‘are designed to elicit depth on a topic of interest’, however, they are considered as the primary data for this study (Guest et al., 2013: 113). Building on these data, this article sets out a forward-looking agenda for the use of out-of-the-box and in-house solutions in order to better understand how both affect the practice of data journalism in Australia.
Findings
Mapping data journalism in Australia
Our study shows that unlike their commercial counterparts, public service media are at the forefront of data journalism in Australia. Indeed, a significant proportion of our survey respondents works for the ABC, the news organisation most invested in data journalism in the country, with three distinct teams working on related projects. One group of journalists, programmers and designers who develop new interactive ways to tell stories in the digital space is based in its Brisbane offices; it produced the highest number of data stories in the period analysed. ‘Interactive Digital Storytelling’ (now ‘ABC News Story Lab’) comprises a team of 10 staff. In its Sydney headquarters, the ABC established a second team in 2018, with a scope similar to the Brisbane team. This team was named ‘Digital Story Innovations’ and has some additional staff working from the ABC’s Melbourne offices. It is composed of eight professionals, which includes a supervising producer (a role similar to an editor), a data journalist, a digital producer, an audience researcher, a designer, a videographer and two developers. Besides these two teams, the structure in the Canberra office is similar. There is a newly established team producing data stories but working predominantly in the political domain. This is mainly because one of the journalists who is currently a political reporter has substantial experience in data journalism. Hence, the stories produced by him and his team make extensive use of data and visualisation.
Following the ABC, the second-biggest team works at Fairfax Media (now Nine Publishing, following a 2018 merger between the two companies to form Australia’s largest media company). The group publishes two major newspapers invested in the production of data journalism in Australia, The Sydney Morning Herald and The Age. Another newspaper producing data journalism in the group is The Canberra Times, based in the capital.
Although the ABC and Fairfax Media are at the forefront of the development of data journalism in Australia, the commercial news organisations The Guardian and News Corp are also making efforts towards greater inclusion of data in their stories. Similarly, SBS has a diverse team that produces interactive and data stories. However, the small number of professionals involved in data journalism limits its expansion, which mirrors existing findings in literature (Jamil, 2019; Kashyap et al., 2020). To overcome this challenge and fill these gaps, our respondents pointed out that Australian newsrooms greatly rely on the adoption of out-of-the-box solutions to produce data stories.
A range of different solutions to data visualisation
Our analysis shows a significant deployment of out-of-the-box solutions in Australian newsrooms (93.75% across all respondents). One major exception is The Guardian Australia, which predominantly relied on in-house tools developed in its parent organisation’s London headquarters. This finding is in line with studies of the field in the United Kingdom, which report that there was a ‘degree of frustration when the generic third-party solutions they used for data processing or visualisation were not compatible with the software infrastructure of their news outlets or were not for certain projects they pursued’ (Borges-Rey, 2016: 840).
To better understand this adoption by Australian newsrooms, we asked our interviewees which tools are used in Australian newsrooms. Our survey presented a list of common out-of-the-box solutions drawn both from the in-depth interviews and the tools used by award-winning data stories (Ojo and Heravi, 2018). We listed a total of 11 solutions, including Carto, Datawrapper, Flourish, Gephi, Google Data Studio, Infogram, Mapbox, Plot.ly, Tableau, Maps4News and Google Fusion Tables. Although we provided a free-text option, no other solutions were added by the survey respondents.
The survey showed that Carto (93.75%), Tableau (87.50%), Datawrapper (81.25%) and Mapbox (62.50%) are the most used third-party solutions. One interviewee commended their ease of use, but mentioned that is was necessary to have basic data-mapping skills to utilise them. In addition, another respondent stated,
It’s impossible to know all these solutions, and they are pretty easy to use, but it is necessary to have a foundation of spreadsheet skills to apply to them. Whereas I would argue that if you don’t need to have all of that stuff, it’s just not employable. . . . But if you don’t have spreadsheet skills and if you can’t understand the basics, then you’re in trouble. (P1, developer – commercial media)
This shows that more staff education and training is urgently needed, matching findings from other studies (Borges-Rey, 2016; Cheruiyot et al., 2019; De Maeyer et al., 2015; Jamil, 2019).
Their ease of use was also seen as favourable. One developer said, ‘I am seeing with a lot of tools like Tableau and these sorts of graphing tools [that they] are becoming easy to use and a lot of producers have access to them now’ (P2, developer – public service media). Another developer defended the use of these tools by journalists but warned of their limitations:
Out-of-the-box tools are limited in what they can do. In saying that, they can be very useful if you can get the editorial team to use them as is. But for developers most are just a pain – except for the mapping tools – they are amazing; Mapbox is excellent. (P3, developer – public service media)
In newsrooms that lack a workforce with the skills necessary, outsourcing to other companies took place, mirroring existing findings (Hermida and Young, 2019). However, our data indicate a significant move by news organisations to produce in-house solutions. Only 12.5% of the respondents do not also use in-house solutions to produce visualisations. The interviews showed some concern from these professionals in relation to out-of-the-box solutions and the need to implement in-house solutions: ‘I began with out-of-the-box tools and became frustrated with their limits and poor aesthetics’ (P4, editor – commercial media), as one interviewee framed it.
Another interviewee mentioned that while they started off with off-the-shelf solutions, later on they went on to deploy their own, in-house tools. ‘We find ourselves in a situation where it’s easier to start to use a third-party tool [but] in the long run it’s easier to build your own tools’ (P5, editor – commercial media). The same interviewee mentioned that they made extensive use of third-party software, which came at a significant cost, but now ‘we have an in-house chart tool to use; we have an in-house mapping tool’.
One respondent contextualised the use of out-of-the-box tools against the extended period of redundancies the Australian news industry has experienced recently (Ricketson et al., 2019):
It takes a lot of time and effort to make these things, you know? . . . Journalism in Australia doesn’t have a lot of money. . . . I don’t have a lot of time to sit and do fancy visualisations or anything. Basically, it’s mostly very simple charts [and] maps. (P6, journalist – commercial media)
The short life of data stories
Our collection of the 299 stories considered for our analysis revealed that several visualisations had disappeared because of the difficulties identified in terms of digital preservation. This reflects existing research suggesting that digital preservation is a challenging task (Broussard and Boss, 2018).
This difficulty was referenced by our interviewees, too; in fact, one-third of respondents bemoaned this issue. One respondent explained this with the limited storage space available in the freemium versions of out-of-the-box solutions: ‘[We] ran out of space on the plan we had with Carto and had to delete projects to get more space. Losing dozens of maps was not great’ (P7, data journalist – commercial media). Hence, many important works of data journalism are disappearing from news portals. These platforms do not offer ways of archiving stories in a way that would allow for them to be easily traceable in the future. One interview respondent highlighted that ‘[Google] Fusion Tables is being decommissioned, which is a real disappointment, and it will mean lots of maps and sheets we have created will probably break or be lost’ (P8, head of department – commercial media). These developments are mirrored in the published literature: to date, many start-ups transform their free users into paying customers once accustomed to a specific service, which sustains their business models (Seufert, 2014; Teece, 2010) – but that switch to paid access is simply unaffordable for some news organisations.
Another problem is maintaining the tools deployed. Many of these solutions are subject to frequent updates, in some cases leading to a loss of data: ‘Once or twice a service crashed and the interactive that I had created did not work with the story and had to be removed’, one interviewee (P9, data journalist – commercial) mentioned. Our questionnaire also asked if news organisations had their own means to archive these data stories. Most of the respondents – more than two-third – replied that their news outlets do not have any form of archive for such content, making the digital preservation of data stories a key challenge for the media industry.
Opportunities and weaknesses of out-of-the-box tools
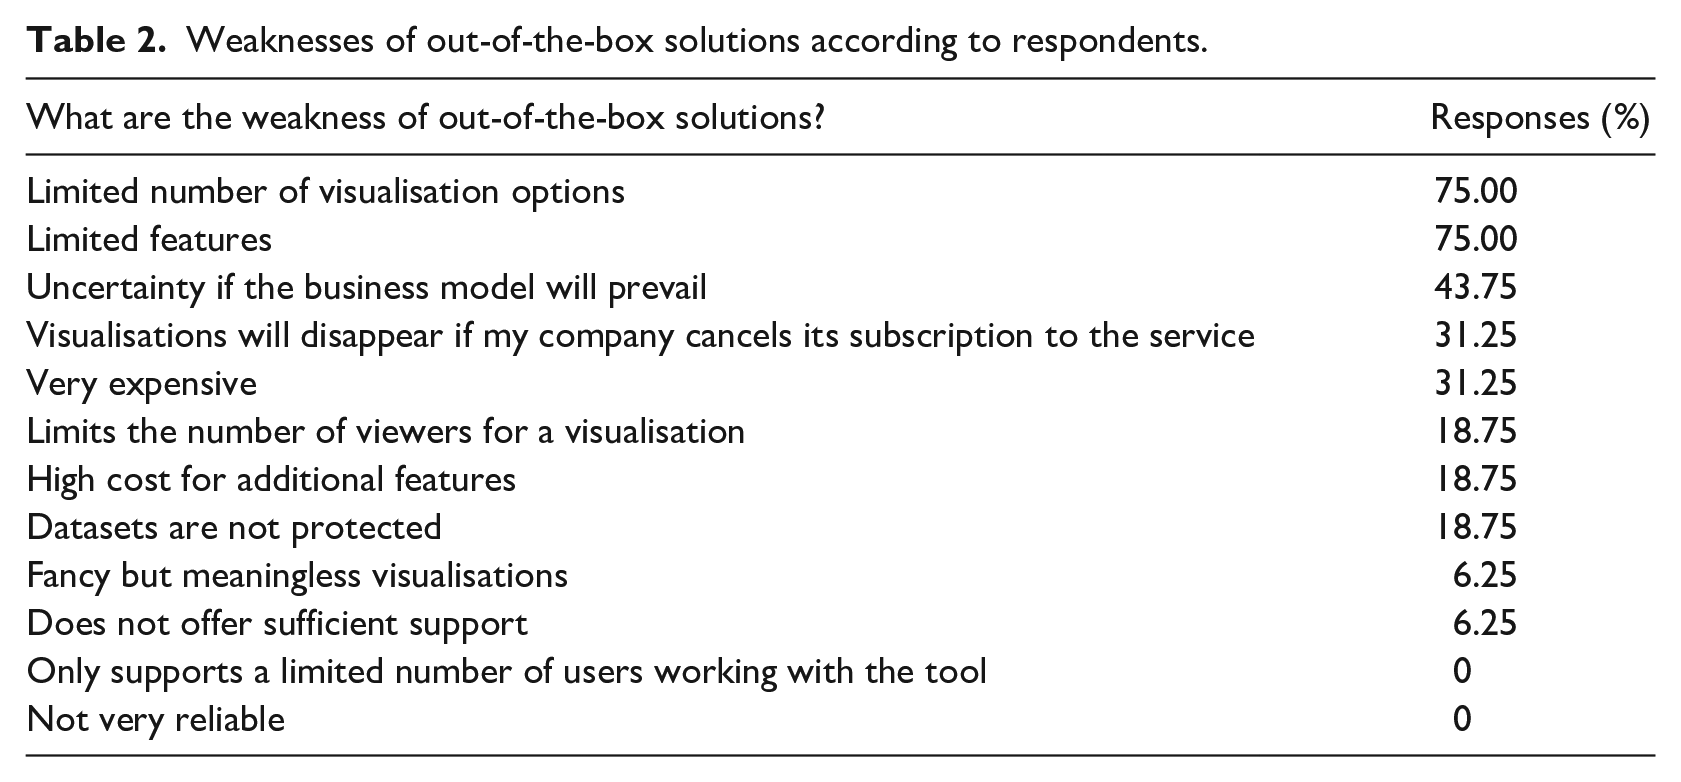
Archiving data stories is however not the only challenge these platforms fail to address. When asked ‘What are the weaknesses of these out-of-the-box solutions?’, respondents referenced two main issues: first, the limited number of visualisation options, on par with the limited number of features available in the basic versions (see Table 2). In one of the interviews, one respondent referenced these limitations, saying,
Toolings is really an interesting topic to explore because no matter what tool you choose, if you’re pushing the boundaries of storytelling, you’re fairly quickly going to run up against the edges of its capability. So, you’ve got to try and figure out what your mix is going to be between doing completely bespoke [in-house] stuff that takes a long time but you can make it do exactly what you want it to do, and settling for the [out-of-the-box] tools that you’ve got that are more readily usable and quick to turn around. We struggle with that mix all the time, and every story is different when we make those decisions on a case-by-case basis. (P10, journalist-developer – public service media)
In the same vein, another respondent mentioned limited features, facing difficulties in editing the mobile and desktop versions of the same visualisation:
The worst part is the inflexibility of tools like Datawrapper and Infogram. The main reason we don’t use these is that we cannot quickly or easily customise background colours and fonts to match a custom-designed news story. Also, these tools have inconsistent or terrible formatting when it comes to certain templates – e.g. too many axis labels or labels that overlap, no tooltips in some chart types [that are] available in others. All the templates should have the same [wide] range of formatting or tooltip options – but in Datawrapper, for example, the line charts, split bar charts, and range plots are very flexible, but all the other templates are rubbish. Also, it would be useful if they allowed you to customise the chart for mobile vs. desktop – [but] this doesn’t seem to be available [yet]. (P11, data journalist – public service media)
In addition to the concerns voiced by one journalist about the tools’ ability to cope with high traffic loads, some of the solutions limited the number of views, requiring organisations to pay a higher fee to allow more users to gain access. This was also highlighted by another journalist: ‘The poorer experiences are mostly [a result of] costs’ (P5, editor – commercial media).
Thus, some of the respondents showed a lack of confidence in the use of out-of-the-box tools in the long term. They believed it would be more beneficial to build their own charting and mapping tools instead of relying on existing tools. Furthermore, the tools’ business models are prone to changes, as also referenced by one interviewee:
The problem are third-party companies: they start out free and then they change their business model – then we can’t afford to spend money on it. Or, I mean, sometimes we can. But . . . we can just build our own chart tool, you know, which means we wouldn’t ever have to pay for it again. (P12, designer – public service media)
However, despite the respondents’ awareness of such issues, out-of-the-box solutions help offset the resources required to build in-house tools. As our findings demonstrate, the use of out-of-the-box solutions for producing data stories still prevails in Australian news organisations.
Discussion and conclusion
This study shows the extent to which Australian news outlets are relying on out-of-the-box solutions in developing their data journalism stories. ABC and SBS are at the forefront of the development of data stories, using their hybrid teams to develop in-house solutions. A lack of resources and the high concentration of media ownership in Australia limit competition, and this enables public broadcasters to be most innovative. By contrast, commercial media organisations are struggling economically to survive in the digital age. Broadly speaking, our findings indicate that off-the-shelf tools serve as a temporary solution to facilitate the tasks performed in the data journalism sector while mitigating the hurdles brought about by a lack of resources and staff. As such, out-of-the-box solutions come in handy, given the fact that there is no need to train or hire specialised staff to produce data and visual stories. But the restrictions imposed by these tools, such as the limitation of features, premium subscription costs and the potential for changes to these services to disrupt existing content create another challenge for newsrooms.
As discussed in the literature review, ensuring the continued availability of these stories beyond their ‘expiry date’ is also a significant issue arising from the use of out-of-the-box solutions. Both our interviews and our analysis of the stories themselves show that a large proportion of the visual elements contained within the stories are lost over time. Thus, pieces of history are slowly disappearing. There is a need to research what steps are being taken to preserve such content.
The interviews also showed that there is a need and a desire on behalf of news organisations to create their own in-house solutions: the business models of the out-of-the-box solutions are prone to change, and many organisations feel that they cannot rely on them in the long run. Some newsrooms – particularly those with specialised technical staff and the necessary skills – develop their own tools; in the Australian case, both the ABC and The Guardian are prominent examples. Importantly, our findings offer evidence that well-resourced media organisations are investing in the field of data journalism and have been able to leverage technologies and tools to advance new practices and norms that enhance journalistic production. This confirms findings from other studies (Borges-Rey, 2016; Hermida and Young, 2019).
Thus, the publishers that are developing their own tools are at the forefront of the development of data journalism in Australia. Conversely, commercial news organisations make less use of interactive stories due to a lack of skillsets and a shortage of skilled labour, and instead continue to rely on the use of out-of-the-box tools to create interactive graphics, tables or maps. Their lack of a profound investment in interactive and visualisation tools might affect the production of data stories, and such outlets will therefore publish a greater number of stories that are static or offer only very limited interaction. Further studies should investigate if data journalism in Australia is experiencing the so-called ‘crowding out’ effect, where strong and innovative public service media offerings discourage investment and innovation in commercial media (Sehl et al., 2020). However, it should be noted that Australia’s public service media have themselves been starved of funds by successive federal governments in recent decades; if they remain more innovative than their commercial counterparts, this is a sad reflection on the overall state of investment in the Australian media sector.
The specific Content Management Systems (CMS) used by each organisation also play a vital role in editorial decisions: their affordances limit innovation in newsrooms, as charts and maps from off-the-shelf solutions must be able to be embedded into the content published through such systems. Further research on the limitations of CMS should address how they affect data journalism in Australia and beyond.
There are other limitations that further research needs to address. As mentioned earlier, our sample is limited, which however merely reflects the limited number of professionals working in data journalism in Australia. Considered as expensive by many news outlets, data journalism in Australia is concentrated in a small number of legacy publishers, while there is a lack of professionals working in this field in born-digital organisations. Further research is necessary to understand why so few resources are devoted to data journalism by born-digital news outlets.
Finally, then, this article contributes to the data journalism literature by shedding light on the adoption of out-of-the-box tools and the deployment of in-house solutions by news organisations. Considering the limitations of workforce, skills and resources, off-the-shelf solutions might come in handy for news organisations under economic stress. However, these platforms do not assure efficiency and security in relation to the future digital preservation of these data stories, and come with hidden costs down the track – a challenge which needs to be addressed to safeguard the archives of such stories in the long run, and to ensure the long-term sustainability of data journalism efforts in Australian news organisations.
Weaknesses of out-of-the-box solutions according to respondents.
Footnotes
Funding
The author(s) disclosed receipt of the following financial support for the research, authorship and/or publication of this article: This article was partially funded by the project JOLT – Harnessing Data and Technology for Journalism (H2020 – MSCA-ITN-2017; grant number: 765140), and the ARC Discovery project DP160101211 Journalism beyond the Crisis: Emerging Forms, Practices, and Uses.