
Abstract
Background:
CT signs of inflammatory and malignant pulmonary nodules are shared and often confused, leading to difficulties in clinical differentiation. Previous relevant studies have neglected to explore the reclassification of morphological signs. This study was designed to evaluate radiomics based on CT images for distinguishing difficult-to-diagnose inflammatory and malignant pulmonary nodules.
Methods:
This retrospective study included 333 patients with malignant pulmonary nodules (Mn) and 161 patients with inflammatory pulmonary nodules (In) who were pathologically diagnosed between January 2017 and February 2024. According to whether the CT signs of pulmonary nodules were typical (typical: A or atypical: B), they were further divided into typical malignant nodules (MnA), atypical malignant nodules (MnB), typical inflammatory nodules (InA) and atypical inflammatory nodules (InB). Group 1 (MnA/InA), group 2 (InA/MnB), group 3 (MnA/InB), and group 4 (MnB/InB) were obtained by pairwise comparison. Clinical models, radiomics models and nomogram models were established for each group. The model performance was evaluated by the area under the curve (AUC), accuracy, sensitivity and specificity. The AUCs of the models were compared by using the DeLong test.
Results:
In the test set, the AUC values ranged from 0.63 to 0.82. In each group, the nomogram model had the highest diagnostic efficiency and had high accuracy, sensitivity and specificity. For group 3, the nomogram model had the best diagnostic ability (training set: AUC, 0.83; 95% CI [0.75-0.90]; accuracy, 0.72; sensitivity, 0.70; specificity, 0.84, test set: AUC, 0.82; 95% CI [0.70-0.94]; accuracy, 0.65; sensitivity, 0.96).
Conclusions:
The nomogram model was useful in diagnosing inflammatory and malignant nodules with typical or atypical signs, especially those with malignant signs, yielding a better classification performance than the radiomics and clinical model.
Introduction
With the wide application of high resolution CT, the detection rate of pulmonary nodules (PNs) is increasing. Because inflammatory and malignant pulmonary nodules differ significantly in clinical management, mortality, and prognosis, it is important to accurately classify nodules. 1
At present, the preliminary judgment of the nature of PNs mainly depends on CT morphological observation. However, the CT features of inflammatory PNs are complex and variable. Atypical PNs often exhibit characteristics similar to malignant PNs, such as lobed signs, burr signs, and other signs. 2 At the same time, some atypical malignant PNs lacked evidence to support malignant diagnosis and showed the characteristics of benign PNs. Their CT signs are identical and often confused, making it difficult to distinguish them based on imaging results. Therefore, the limitation of morphological observation in conventional imaging often leads to a high rate of misdiagnosis and missed diagnosis.
At this time, invasive means such as puncture biopsy are often required for further clinical judgment. However, this method also has limitations that cannot be ignored: First, it is difficult to locate the puncture for PNs with a diameter of less than 1cm. Second, pure ground glass nodules contain fewer tumor components, which can lead to false negative results. Third, invasive examination may be accompanied by pneumothorax, bleeding, infection and other complications. Finally, PNs in special locations, such as near the heart, large blood vessels, trachea, and other vital organs, are at greater risk of puncture. Therefore, there is an urgent clinical need for a comprehensive, non-invasive method to determine the nature of PNs.
Three-dimensional (3D) reconstruction technology transforms the two-dimensional (2D) CT images of the patient’s chest into intuitive 3D images, simulates the morphology of PNs and surrounding tissue structures on the computer, and uses software processing tools to display lung structures (blood vessels, bronchi and nodules) from any angle in an all-round way. By applying a large number of quantitative imaging features, radiomics can extract information that is not easily seen by the naked eye or features that are not easily quantified from CT images. 3 Radiomics has the advantages of repeatability, noninvasiveness, lack of time and space limitations, and low cost. Recent studies show the potential of radiomics to distinguish inflammatory and malignant PNs.4 -6 Based on previous studies, this study was the first to further distinguish inflammatory and malignant PNs into typical and atypical PNs based on morphological characteristics and cross-building models, and to explore the value of radiomics combined with 3D reconstruction technology in the differential diagnosis of inflammatory and malignant PNs.
Materials and Methods
Patients
This retrospective study was approved by the local institutional review board (Approval number: YX-P-2020-085-01). The requirements for informed consent were waived. In total, 832 patients from January 2017 to February 2022 were included in the study. All patients met the following inclusion criteria: (a) complete pathology report; (b) lesions < 3 cm in diameter; (c) solid or partial solid nodules. Patients were excluded if: (a) unclear boundaries or obvious imaging artifacts that affected the analysis; (b) neoadjuvant chemoradiotherapy was administered before surgery. Finally, 494 patients were included (1 PN per patient, 333 patients with malignant PNs and 161 patients with inflammatory PNs).
CT Scanning
The images were acquired by the SIEMENS 128-slice spiral CT scanner. The patient was positioned supine with their heads first, and a continuous CT scan was performed after breath holding at the end of the inspiration. The scan included the whole lung. The tube currents were automatically adjusted; the tube voltage was 120 kV; the layer thickness and layer distance were both 1 mm; and the image matrix size was 512 × 512.
Image and Data Analysis
The Quantitative Data of PNs Obtained by 3D Reconstruction
The 1 mm thin layer chest images of 494 patients were imported into the SIEMENS Syngo.via platform to obtain image measurement data (RECIST diameter, maximum orthogonal diameter, HU mean value, eccentricity, and volume).
Observation of Morphology
Two senior radiologists (with 6 and 8 years of experience performing chest imaging) were blinded to the clinical and pathological data and examined all images, respectively. If there was any disagreement, they would consult and reach a consensus. The concordant diagnosis of the 2 radiologists were tested and their evaluation results were highly consistent (Kappa value = 0.73, 95% CI [0.6655-0.795], P < .001). PNs meeting the characteristics were classified as typical inflammatory or malignant PNs. Those that did not fit were classified as atypical inflammatory or malignant PNs. The characteristics are described in Table S1. 7
Participant Groups
In order to avoid error interference between PNs, we selected the nodule with the highest risk from each patient’s images for analysis. Among 333 malignant and 161 inflammatory PNs, 88 and 49 PNs were atypical, respectively. It was found that the common benign CT signs (the halo sign, loose sign, shallow lobular sign, flatness sign, smooth flow of blood vessels, etc.) were present in atypical malignant PNs.6 -10 Atypical inflammatory PNs often exhibit malignant CT signs (the deep lobular sign, short burr, pleural pull, umbilical concave sign, vascular cluster sign, etc.). According to whether the CT signs of PNs were typical (typical: A or atypical: B), they were divided into typical malignant nodules (MnA), atypical malignant nodules (MnB), typical inflammatory nodules (InA) and atypical inflammatory nodules (InB). Group 1 (MnA/InA), group 2 (InA/MnB), group 3 (MnA/InB), and group 4 (MnB/InB) were obtained by pairwise comparison (Figure 1).

Flow chart summarizing the patient’s allocation and grouping.
Segmentation of the Region of Interest (ROI)
At present, the segmentation methods of ROIs are mainly divided into manual, semi-automatic, and automatic segmentation. Semi-automatic and fully automatic segmentation methods are fast but lack accuracy and are easily influenced by surrounding factors. 11 Some studies have already improved this issue,12,13 but due to the relatively smaller scale of our data, we adopted a manual segmentation method to ensure the accuracy of the region of interest. The CT DICOM files of 494 PNs were imported into the open-source image segmentation software (ITK-SNAP). Each layer of the PN was delineated by manual segmentation, and then 3D regions of interest were reconstructed from the 2D images (Figures 2a-h and 3a-h).

Panels a to d demonstrate the ROI segmentation of typical inflammatory nodules. Panels e to h demonstrate the ROI segmentation of atypical inflammatory nodules.

Panels a to d demonstrate ROI segmentation of typical malignant nodules. Panels e to h demonstrate ROI segmentation of atypical malignant nodules.
High-Throughput Feature Extraction
All raw image DICOM files and the segmented NII files were imported into the Radcloud platform to extract radiomics features. These included shape features, statistical features, gray level cooccurrence matrix (GLCM) features, gray level run length matrix (GLRLM) features, gray level size zone matrix (GLSZM) features, gray level dependence matrix (GLDM) features, neighboring gray tone difference matrix (NGTDM) features, and texture features after Laplacian-of-Gaussian (LOG) filtering and the wavelet transform.
Feature Screening and Radiomics Analysis
The 4 groups of PNs were randomly assigned to training and test groups at a ratio of 7:3. The data in the training set were used for feature screening and diagnostic model construction. The data in the test set were used to verify the efficacy of the model internally. In each group, all PNs were manually delineated by physician A. Meanwhile, CT images of 20 PNs were randomly selected from each group and segmented by radiologist B.
To further assess intraobserver consistency, ROIs of all PNs were delineated twice by physician A, with at least 1 month between delineations. The pathology of the PNs was not known by either physician at the time of ROI delineation. In this study, intraclass correlation coefficients (ICCs) were used to evaluate the consistency of interobserver and intraobserver feature extraction to ensure the reproducibility of generating radiomics features. ICCs > 0.75 indicated good reproducibility, and radiomics features with ICCs ⩽ 0.75 were omitted from further analysis. Reproducible and stable features were used to establish radiomics tags. The radscore was calculated using a linear function of selected features.
Radiomics models were constructed by using logistic regression classifiers in the machine learning algorithm. A 10-fold cross-validation was conducted to determine the optimal value of the regularization parameter (λ). The value of λ corresponding to the minimum mean cross-validated binomial deviance was selected for model construction. Features with non-zero coefficients at this λ value were retained for inclusion in the radiomics model. The final radscore was calculated as a linear combination of the selected features weighted by their respective LASSO coefficients. And the diagnostic efficacy of the models was evaluated by the AUC, accuracy, sensitivity and specificity and compared with the DeLong test. The correction curve was used to evaluate the prediction efficacy of the model. The decision curve was used to evaluate the potential clinical net benefit of the prediction model.
Statistical Analysis
Statistical analysis were performed using SPSS 26.0 and R 3.4.3 (R Foundation for Statistical Computing). Comparisons between data sets are summarized using T or Mann-Whitney U test for the continuous variables and χ2 or Fisher exact test for the categorical variables. The independent predictors were analyzed by univariate and multivariate logistic regression. The “pROC” R software package was used to calculate the sensitivity and specificity of the model and to draw the ROC curve. AUCs were compared with the DeLong test. Kappa test was used to evaluate the consistency. The calculation of ICCs was performed using the “DescTools” software package; LASSO regression was calculated using with the “glmnet” software package; and the “rms” software package was used to draw the nomogram. A decision curve was drawn with the “rmda” software package. The calibration curve was drawn with the “ModelGood” software package. P < .05 was considered statistically significant.
Results
Patient Characteristics
Among the 333 patients with malignant PNs (117 males, 216 females; median age of 58 years (range of 22-81 years)). The pathological distribution was as follows: adenocarcinoma (n = 333). Among the 161 patients with inflammatory PNs ((104 males, 57 females; median age, 57 years (range of 20-78 years)).The pathological distribution was as follows: chronic inflammation (n = 98), granulomatous inflammation (n = 19), mechanical pneumonia (n = 14), tuberculous nodules (n = 12), atypical hyperplasia (n = 7), inflammatory pseudotumor (n = 6), and Aspergillus nodules (n = 5). Logistic regression analysis of clinical data of inflammatory and malignant PNs is shown in Table S2 to S4.
After the PNs in each group were randomly divided into subgroups according to a 7:3 ratio, R language software was used for further multifactor logistic regression analysis (Table S3) and backward logistic regression analysis (Table S4) on the data from the training set. Independent predictors (P < .05) were obtained as follows: group 1: sex, eccentricity, and HU mean; group 2: sex, age, and HU mean; group 3: sex, RECIST diameter, and HU mean; and group 4: sex, age, and HU mean.
Radiomics Feature Analysis
A total of 1409 radiomics features were extracted across the 4 groups. After evaluating the intergroup and intragroup correlation coefficients, radiomics features with ICC ⩽ .75 were omitted. The inter-observer ICC values were provided in the Supplemental Material. Through Spearman correlation analysis, variance analysis, the rank sum test, mRMR analysis and LASSO regression, 5 wavelet transform features were selected for group 1; 2 first-order features and 3 wavelet transform features were selected for group 2. One first-order feature, 1 second-order feature and 1 wavelet transform feature were selected for group 3; 2 first-order features and 8 wavelet transform features were selected for group 4 (Table S5, and screening process is shown in Figures 4 and 5). 14 The radscore was calculated as a linear combination of the product of selected features and their corresponding weight coefficients (Figure 6). The explicit formula of calculating the radscore was shown in Table S6.

Taking group 4 as an example, the variation curve of model polynomial deviation with hyperparameter λ in LASS0 are shown in a. The Y-axis is binomial deviation. The natural logarithm of λ is the X-axis. The red dot represents the average deviation. By adjusting the value of λ on the horizontal axis, the model error along the vertical axis is minimized. The vertical dashed line indicates the log (λ) value corresponding to the best λ value. The selection criterion is the minimization criterion. The best λ value is obtained by a 10-fold cross validation. The profiles of LASSO coefficients for all radiomics features are shown in b. Each curve represents the trajectory of the coefficient for a given variable. The figure shows the nonzero coefficients of 10 radiomics-related features.

LASSO logistic regression was used to select the radiomics characteristics related to classifying inflammatory nodules and malignant nodules. Radiomics features are plotted on the Y-axis of the histogram, and their coefficients are plotted on the X-axis. The figure shows the final screened radiomics features of each group and the absolute values of their corresponding coefficients. (a) Group 1, (b) Group 2, (c) Group 3, and (d) Group 4. The higher the absolute value, the more influential the feature is.

Taking group 4 as an example, the radiomics model rad-score distribution box plots of inflammatory and cancerous nodules in the training set and test set are shown.
As shown in Figure 5, in group 1, the weight coefficients of wavelet_LLLfirstorderRootMeanSquared and wavelet_LLHgldmSmallDependenceLowGrayLevelEmphasis were relatively large. In group 2, the weight coefficients of gradientfirstorderVariance and lbp_2DfirstorderMedian were larger. In group 3, the weight coefficients of squarefirstorderInterquartileRange and originalglrlmRunLengthNonUniformity were larger than other coefficients. In group 4, the weight coefficients of lbp_2Dfirstorder InterquartileRange, wavelet_LLHglszm Size Zone Non Uniformity Normalized, gradientfirstorderVariance, wavelet_HHHglszm Size ZoneNonUniformity Normalized and wavelet_HLHglcmMCC were higher than the coefficients of other features. The corresponding coefficients of the above features were all >0.2.
Model Establishment and Testing
Clinical models were established based on clinical independent predictors. The radiomics models were established based on the identified radiomics features. The nomogram models (Figure 7) were composed of independent predictors and radscores. LASSO logistic regression was used to construct the prediction model. The above models were verified by 10-fold cross-validation combined with receiver operation characteristics. The calibration curve was drawn to evaluate the calibration ability of the models (Figure 8). The decision analysis curve was used to evaluate the clinical practicability of the models (Figure 9). As shown in Figure 9, when the threshold probabilities were within 0.3 to 0.99 in groups 1 and 2, 0.65 to 0.9 in group 3, and 0.5 to 0.8 in group 4, all the models improved the differentiation of inflammatory and malignant PNs. Among them, the nomogram model had the closest to perfect prediction ability and had the highest net benefit for each group.

Nomogram models in the 4 groups. The specific score of each feature from the second row to the fifth row vertically corresponds to the “score” in the first row. In this way, the “score” of each feature is added to obtain the “total score” in the sixth row. The “total score” of each patient then vertically corresponds to the “risk of malignant nodules” in the last row, which helps obtain the predictive probability of having malignant nodules. In Supplemental Figure S1, we incorporated the relevant characteristics of pulmonary nodules from a 54-year-old female adenocarcinoma patient into the Group 1 nomogram model, which predicted an 88% risk of malignant pulmonary nodules. The final pathological diagnosis confirmed adenocarcinoma. (a) Group 1, (b) Group 2, (c) Group 3, and (d) Group 4.

Calibration curves of clinical models, radiomics models, and nomogram models in the 4 groups. The horizontal axis represents the probability of the nomogram model predicting a malignant nodule, and the vertical axis represents the actual probability of a malignant nodule occurring. The solid diagonal line represents perfect prediction, and the dashed lines represents the prediction performance of the diagnostic model. The closer the dashed lines are to the solid line, the better the prediction ability of the corresponding model. The blue dashed line represents the radiomics model, the green dashed line represents the clinical model, and the red dashed line represents the nomogram model. (a) Group 1, (b) Group 2, (c) Group 3, and (d) Group 4.
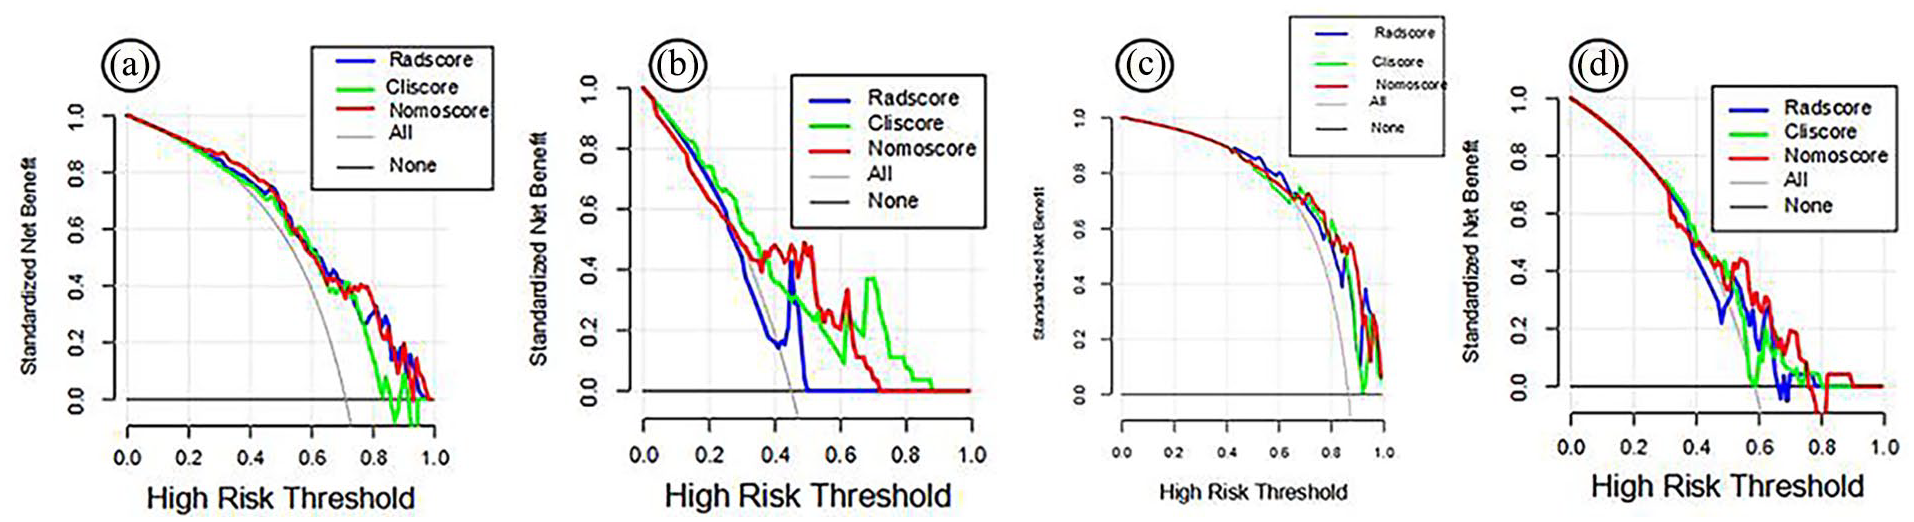
Decision analysis curves of the clinical models, radiomics model, and nomogram model in the 4 groups. The Y-axis represents net revenue, and the X-axis represents threshold probability. The gray line indicates that all PNs are malignant, and the black line indicates that all PNs are inflammatory. The blue, green and red lines represent the benefit curves of the radiomics model, clinical model and nomogram model, respectively. (a) Group 1, (b) Group 2, (c) Group 3, and (d) Group 4.
Comparison of the Diagnostic Efficacy of the Radiomics Model, Clinical Model and Nomogram Model
As shown in Table 1 and Figure 10, in group 1, the diagnostic efficacy of the nomogram model (AUC = 0.87) was significantly better than that of the radiomics model (P = .001) and of the clinical model (P = .037) in the training set. The diagnostic efficacy of the nomogram model (AUC = 0.79) was better than that of the clinical model (P = .044) in the test set. In group 2, The diagnostic efficacy of the nomogram model (AUC = 0.85) was better than that of the radiomics model (P = .014) and of the clinical model (P = .019) in the training set. In group 4, the diagnostic efficacy of the nomogram model (AUC = 0.89) was better than that of the radiomics model (P = .047) and of the clinical model (P = .015) in the training set. The results of DeLong test were shown in Table S7.
Diagnostic Efficacy of the Radiomics, Clinical, and Nomogram Models for Each Group.


ROC curves of the clinical models, radiomics models, and nomogram models in the 4 groups. The prediction performance is expressed as AUC. The blue line represents the radiomics model, the green line represents the clinical model, and the red line represents the nomogram model for each group. The performance of the nomogram model in each group was the best. (a-d) Data from the training Groups 1 to 4 and (e-h) data from the test Groups 1 to 4.
The AUC values of all models ranged from 0.77 to 0.89 in the training set and from 0.63 to 0.82 in the test set. The results showed that all models had good and stable diagnostic efficiency. The nomogram model in each group showed the best diagnostic efficacy in distinguishing between inflammatory and malignant PNs and had relatively high accuracy, sensitivity and specificity. In addition, it is worth noting that the nomogram model in group 3 had the best diagnostic capability (AUC = 0.82, 95% CI [0.70-0.94] in the test set, AUC = 0.83, 95% CI [0.75-0.90] in the training set; Table 1 and Figure 11).

Histograms of AUC values of the radiomics, clinical, and nomogram models for the 4 groups: (a) training set and (b) test set.
Discussion
Radiomics allows images to be converted into feature data, which can objectively describe the characteristics of tumor boundaries, morphology, texture, spatial structure, etc., and reflect the heterogeneity within the tumor. 3 The 3D reconstruction technology uses AI to automatically measure the quantitative data of PNs, which effectively reduces the manual measurement error. In addition, to the best of our knowledge, this is the first study to classify inflammatory and malignant PNs with typical or atypical signs.
First, we found that differences in 2 clinical features (sex, HU mean; P < .05) were statistically significant. These findings indicate that malignant PNs occur more frequently in females and that CT values are lower regardless of whether their signs are typical or not, which may be related to the fact that most of the malignant PNs included in this study were adenocarcinomas. In addition, it is worth noting that between typical inflammatory and malignant PNs, typical inflammatory PNs have a larger eccentricity (P = .38), indicating a more irregular shape, while malignant PNs tend to be spherical. Due to their typical CT signs, typical PNs are easier to diagnose clinically. The results of this study were consistent with our understanding. There were statistically significant differences in age (P = .02) and RECIST diameter (P = .006) between inflammatory and malignant PNs with similar morphological manifestations, suggesting that caution should be exercised in the diagnosis of PNs with malignant signs when the nodule is small. Age (P = .12) was helpful in distinguishing between atypical inflammatory and malignant PNs. Patients with inflammatory PNs tended to be younger, while those with malignant PNs tended to be older. Due to their atypical CT signs, atypical inflammatory and malignant PNs are difficult to diagnose clinically, which suggests that the age of patients may assist decision-making in distinguishing benign and malignant PNs. In the 4 groups, sex and HU mean were common independent predictors, and the OR value of HU mean was higher in each group, indicating that malignant PNs were more common and HU mean was lower in women, regardless of whether the PNs had typical signs or not.
Second, to further improve the diagnostic accuracy, we used Spearman correlation analysis and LASSO regression and obtained the gray size region matrix after wavelet transformation of data from all 4 groups. For inflammatory and malignant PNs with typical signs, Wavelet_LLLfirstorder RootMean Squaredand wavelet_LLHgldmSmall Dependence LowGrayLevelEmphasis had larger weight coefficients (0.6 and 0.48, respectively), which showed that the models were sensitive to the gray value of the image. For inflammatory and malignant PNs with atypical signs, Lbp_2Dfirstorder InterquartileRange and wavelet_HLHglcmMCC had larger weight coefficients (0.25-0.69), showing that the images of different tumor types were relatively sensitive to gray mean, quartile distance distribution, and internal texture complexity. The observed findings may be explained that Wavelet_LLLfirstorderRootMeanSquared and Lbp_2DfirstorderInterquartileRange quantify intranodular heterogeneity, reflecting characteristic malignant features of aberrant proliferation and necrosis, 14 while wavelet_LLHgldmSmall DependenceLowGrayLevelEmphasis and wavelet_HLHgl-cm MCC demonstrate spatial dependence of low-gray-level pixels, 15 potentially associated with the lepidic growth pattern characteristic of malignant pulmonary nodules. For inflammatory and malignant PNs with similar morphological manifestations, GradientfirstorderVariance, lbp_2DfirstorderMedian, squarefirstorderInterquartileRange, and OriginalglrlmRunLengthNonUniformity had larger weight coefficients (0.25-0.6), showing that the images of different tumor types were sensitive to the distribution of mean, median and quartile distance. A potential explanation is that GradientfirstorderVariance reflects abnormal angiogenesis in malignant tumors by quantifying intensity heterogeneity within pulmonary nodules,16,17 while lbp_2DfirstorderMedian represents local textural symmetry of nodules, likely associated with cellular arrangement patterns – inflammatory nodules typically demonstrate more regular cellular organization compared to their malignant counterparts. Furthermore, squarefirstorderInterquartileRange amplifies density variations to identify the characteristic heterogeneity of malignant components. By comparison, radiomics could extract more useful information from the images of inflammatory and malignant PNs with atypical signs, showing a higher diagnostic ability. Similar to our results, Xu et al 18 also showed that the local binary pattern (LBP) 2D first-order median and square first-order interquartile range were related to the classification of benign and malignant PNs. In our study, we further classified nodule morphologies as typical or atypical and discussed the application of radiomics in the differentiation of benign and malignant PNs under different morphologies. We have supplemented these findings and developed our methods to uncover more radiomics features related to differential diagnosis.
Finally, in this study, we used LASSO logistic regression to construct a clinical model, radiomics model and nomogram model for each of the 4 groups. Between any 2 subgroups of typical or atypical inflammatory and malignant PNs, the nomogram model showed the best diagnostic efficacy (training set: AUCs range of 0.83-0.89, test set: AUC values range of 0.69-0.82), with high accuracy, sensitivity, and specificity. This result is similar to findings reported by Xu et al 19 In the case of easily diagnosed inflammatory and malignant PNs (group 1) and in the case of difficult-to-diagnose PNs (group 4), the radiomics model showed better diagnostic efficacy than the clinical model. In addition, comparison between the groups showed that the nomogram model had the highest diagnostic efficacy between inflammatory and malignant PNs with malignant characteristics (Group 3; training set: AUC = 0.83, 95% CI [0.75-0.90], and test set: AUC = 0.82, 95% CI [0.70-0.94]).
There were several advantages of this paper. Firstly, the diagnosis of the nature of PNs with atypical imaging signs has always been an urgent issue in clinical practice. At present, related radiomics studies only classify PNs into 2 groups: inflammatory and malignant, among which nodules with typical signs may lead to overestimation of diagnostic efficacy. This study is the first to further classify inflammatory and malignant PNs into typical and atypical nodules based on signs, and conduct cross group analysis, which is more in line with clinical application scenarios. Secondly, in this study, the clinical quantitative characteristics were obtained by software measurement of nodules, which reduced error due to naked eye observation by physicians. In addition, most scholars have previously extracted radiomics features based on CT images with more than 1 mm layer thickness, 20 while our study extracted 3D spatial radiomics features from lesion images with only 1 mm thickness, which improved the accuracy of the results. Finally, it is noteworthy that the results of this study found that radiomics has the highest diagnostic value in distinguishing inflammatory and malignant PNs with atypical signs.
There were also limitations of this study. Firstly, the number of patients included was small, which is a problem faced by most existing studies related to radiomics. 21 Secondly, this was a single-center study without external validation. All medical images in this study were obtained from the same acquisition equipment and scanning parameters. Additionally, this was a retrospective study and the majority of malignant nodules included in this study were adenocarcinoma, which is biased. This may limit the generalizability of models to other malignant nodule types, which were not represented. The aforementioned limitations collectively underscore the limited generalizability of this study. Future efforts will focus on expanding the sample size, incorporating multicenter data for external validation, utilizing diverse CT scanners with varying imaging parameters, and prospectively enrolling patients with heterogeneous pathological subtypes to rigorously validate our findings. Finally, manual delineation was used in this study. In order to improve the reproducibility of the results, ICCs were used to screen features, but manual depiction methods inevitably introduce human errors, resulting in poor reproducibility of radiomic features and unstable model performance. In subsequent research, we will use a variety of image segmentation methods, such as automatic and semi-automatic segmentation methods, to select more stable features and validate our conclusions. It is worth noting that radiomics itself has certain limitations. For example, radiomics models have poor generalizability, and the biological interpretability of radiomic features is weak. As a result, the clinical application of radiomics is significantly hindered and requires further development and validation.
Conclusions
In conclusion, the radiomics combined with 3D reconstruction technology can effectively distinguish inflammatory PNs from malignant PNs, which are difficult to distinguish clinically. The Nomogram model with added clinical features can further improve the diagnostic performance, especially for distinguishing inflammatory PNs with malignant signs from malignant PNs. Therefore, this nomogram model has important diagnostic value for inflammatory and malignant PNs with confusing morphological features.
Supplemental Material
sj-docx-1-bec-10.1177_11795972251371467 – Supplemental material for Computed tomography-derived radiomics models for distinguishing difficult-to-diagnose inflammatory and malignant pulmonary nodules
Supplemental material, sj-docx-1-bec-10.1177_11795972251371467 for Computed tomography-derived radiomics models for distinguishing difficult-to-diagnose inflammatory and malignant pulmonary nodules by Shaohong Wu, Xiaoyan Wang, Wenli Shan, Jiao Ren and Lili Guo in Biomedical Engineering and Computational Biology
Footnotes
Acknowledgements
Not applicable.
Consent to Participate
Patient consent was waived due to the retrospective nature of the study.
Institutional Review Board Statement
The study was conducted according to the guidelines of the Declaration of Helsinki, and approved by the ethics committee of Affiliated Huaian No. 1 People’s Hospital of Nanjing Medical University (Approval No: YX-P-2020-085-01, Date: January 2021).
Author Contributions
Conceptualization, Lili Guo; Data curation, Jiao Ren; Formal analysis, Shaohong Wu; Funding acquisition, Lili Guo; Investigation, Xiaoyan Wang; Methodology, Shaohong Wu; Project administration, Lili Guo; Resources, Lili Guo; Software, Xiaoyan Wang; Supervision, Wenli Shan; Validation, Jiao Ren; Visualization, Wenli Shan; Writing – original draft, Shaohong Wu and Xiaoyan Wang; Writing – review & editing, Lili Guo. Shaohong Wu and Xiaoyan Wang contributed equally to this work and should be considered co-first authors. All authors have read and agreed to the published version of the manuscript.
Funding
The authors disclosed receipt of the following financial support for the research, authorship, and/or publication of this article: This work was supported by the Beijing Medical Award Foundation [grant no.YXJT-2023-0866-0341].
Declaration of Conflicting Interests
The authors declared no potential conflicts of interest with respect to the research, authorship, and/or publication of this article.
Data Availability Statement
The data presented in this study are available on request from the corresponding author due to concerns regarding the protection of patient data privacy.
Supplemental Material
Supplemental material for this article is available online.
References
Supplementary Material
Please find the following supplemental material available below.
For Open Access articles published under a Creative Commons License, all supplemental material carries the same license as the article it is associated with.
For non-Open Access articles published, all supplemental material carries a non-exclusive license, and permission requests for re-use of supplemental material or any part of supplemental material shall be sent directly to the copyright owner as specified in the copyright notice associated with the article.