
Abstract
Background:
Acute pancreatitis (AP) is a common disease of acute abdominal pain, the incidence of which is increasing annually, but its pathogenesis remains incompletely understood.
Methods:
Gene expression profiles of AP were obtained from the Gene Expression Omnibus (GEO) database. R software was used to identify differentially expressed genes (DEGs) and perform functional analysis. The diagnostic value of HLA-DR-related genes was assessed by receiver operating characteristic (ROC) curves. Monocyte infiltration abundance in AP and normal groups was analyzed by Cibersort method, and the correlation between HLA-DR-related genes and monocyte abundance was analyzed. The modules highly correlated with HLA-DR-related genes were clarified by WGCNA modeling, and the core genes regulating HLA-DR were obtained by using LASSO regression. Finally, potential drugs targeting the above genes were analyzed by Enrichr database.
Result:
A Total of 3 HLA-DR-related genes (HLA-DRA, HLA-DRB1, and HLA-DRB5) were identified, which were negatively correlated with the severity of AP and had excellent disease diagnostic value (AUC = 0.761, 0.761, and 0.718), were were positively correlated with monocyte abundance. We identified 110 genes that positively regulate HLA-DR and 130 genes that negatively regulate HLA-DR. LASSO regression identified UCP2, GK, and SAMHD1 as the core nodes of the regulated genes. Compared with the normal group, UCP2 and SAMHD1 were reduced in AP, and the opposite was true for GK, and SAMHD1 had better sensitivity and specificity in diagnosing AP. Drug sensitivity analysis predicted 12 drugs acting on HLA-DRA, HLA-DRB1, and HLA-DRB5 and 8 drugs acting on UCP2, GK, and SAMHD1.
Conclusion:
We identified 3 HLA-DR-related genes (HLA-DRA, HLA-DRB1, and HLA-DRB5) and 3 coregulatory nodes (UCP2, GK, and SAMHD1), which were associated with AP severity and monocyte abundance. Based on these genes, we predicted 20 potential therapeutic agents for AP.
Introduction
AP is a common pancreatic disease, with a global increase in incidence over recent decades, particularly in developed countries.1,2 It predominantly affects individuals aged 40 to 60. 3 The causes of AP are varied, with bile duct stones and gallbladder disease being the most common, along with risk factors such as heavy alcohol use, hypertriglyceridemia, smoking, autoimmune diseases, and infections.4,5
The pathogenesis of AP is marked by the abnormal activation of pancreatic enzymes and the reflux of pancreatic fluid, leading to auto-digestion and inflammation of pancreatic tissue. This results in tissue edema, infiltration of inflammatory cells, and possible tissue necrosis, which are key features of AP. 6 Recent studies have emphasized the critical role of the immune system in the development of AP, focusing on the involvement of human leukocyte antigen-DR (HLA-DR) genes and monocytes.7 -10 HLA-DR molecules are essential for immune regulation, as they present antigens to activate T cells.11,12 In severe AP (SAP), an intense pro-inflammatory response may be quickly followed by an anti-inflammatory phase, causing a decrease in monocyte HLA-DR (mHLA-DR) expression. 13 Reduced HLA-DR expression occurs early in AP and is linked to the severity of the disease, with persistent low levels associated with late mortality in SAP patients.14,15
Research into HLA-DR gene expression and monocyte infiltration is evolving. A subtype of myeloid-derived suppressor cells (MDSCs) with low HLA-DR expression has been found to regulate excessive inflammation. 16 Yao et al identified a subpopulation of monocytes with high S100A expression and low HLA-DR expression, significantly enriched in sepsis patients, which may play an immunosuppressive role. 17 Downregulation of mHLA-DR reflects reduced monocyte responsiveness and is associated with higher risks of infection and mortality in sepsis patients. 18 HLA-DR expression is also lower in monocytes from patients with acute kidney injury (AKI) compared to sepsis patients without AKI. 19 Furthermore, low HLA-DR expression across monocyte subpopulations is independently linked to diabetes mellitus, with dyslipidemia further suppressing HLA-DR expression. 20
It is hypothesized that HLA-DR-related genes and monocytes significantly influence AP, yet their intricate relationship remains largely unexplored. Understanding the expression of individual HLA-DR genes in monocytes could offer insights into their role in AP development. Investigating these aspects could contribute to better understanding of AP pathogenesis and support the development of novel therapeutic strategies. Advances in AP management suggest that early immunomodulation may help mitigate early organ failure. 21 Therefore, this study aims to explore the mechanisms involving HLA-DR-related genes and monocytes in AP, and to identify potential therapeutic agents to improve treatment outcomes.
Materials and Methods
Data Sources
Gene expression profiles were retrieved from the GEO database (http://www.ncbi.nlm.nih.gov/geo) using “Acute pancreatitis” as the search term, with Homo sapiens selected as the species of interest. The dataset GSE194331 was obtained, comprising peripheral blood transcriptome data from 32 healthy controls and 87 patients with AP, including 57 mild, 20 moderate, and 10 severe cases. Additionally, the GSE249349 dataset, containing single-cell RNA sequencing data from peripheral blood of 3 acute pancreatitis model mice and 1 normal mouse, was included for analysis.
Differential Expression of HLA-DR-Related Genes and ROC Curve Analysis
The GSE194331 dataset was normalized using the “normalizeBetweenArrays” function in the “limma” package to ensure consistency across samples. Expression matrices for HLA-DR-related genes were extracted from both the control and AP groups. Differences in gene expression across normal, mild, moderate, and severe AP groups were assessed using One-Way ANOVA. ROC curve analysis was performed using the “pROC” package in R to evaluate the diagnostic performance of HLA-DR-related genes, and the area under the ROC curve (AUC) was calculated.
GSEA Enrichment Analysis of HLA-DR-Related Genes
Gene Set Enrichment Analysis (GSEA) was conducted to explore the potential pathways associated with HLA-DR-related genes in AP progression. The analysis was based on the c2.cp.kegg.v7.4.symbols.gmt gene set from the MsigDB database (https://www.gsea-msigdb.org/gsea/index.jsp). AP samples were divided into high and low expression groups according to the median gene expression level, and single-gene GSEA was performed. Pathways with an absolute normalized enrichment score (NES) >1 and an adjusted P-value < .05 were considered significant.
Construction of miRNA-mRNA and Transcription Factor (TF)-mRNA Networks
miRNAs targeting HLA-DR-related genes were predicted using the miRanda, miRDB, and TargetScan databases. Only miRNAs identified by all 3 databases were retained to enhance prediction accuracy. Transcription factors regulating HLA-DR-related genes were identified using the NetworkAnalyst database, an online platform for gene expression analysis and meta-analysis. Differential expression of transcription factors between normal and AP groups was analyzed using the t-test.
Analysis of Monocyte Abundance and Its Association With HLA-DR-Related Genes
Monocyte abundance in AP and control groups was quantified using the CIBERSORT algorithm, which employs linear support vector regression to estimate immune cell proportions based on gene expression data. Differences in monocyte abundance between groups were assessed using a 2-sample t-test. Spearman’s correlation analysis was employed to evaluate the association between HLA-DR-related genes and monocyte abundance, with results visualized using the “ggplot2” package.
WGCNA of HLA-DR-Related Genes
Weighted Gene Co-expression Network Analysis (WGCNA) was performed to construct a co-expression network of HLA-DR-related genes. To ensure the reliability of the analysis, genes with a Median Absolute Deviation (MAD) in the top 50% were excluded. Outlier genes and samples were identified and removed using the goodSamplesGenes function. The soft-thresholding power (β) was set to 16, which was chosen based on the scale-free topology criterion, where the value of β was determined to maintain a balance between network connectivity and independence (thresholding was chosen to achieve a fit index of around 0.9). A Topological Overlap Matrix (TOM) was constructed to measure network connectivity, and genes with similar expression profiles were clustered into modules using hierarchical clustering, with a minimum module size of 30 genes. Modules with a distance of less than 0.25 were merged, resulting in 19 modules. Module Membership (MM) and Gene Significance (GS) were calculated to identify modules highly correlated with HLA-DR-related genes.
Differential Gene Expression Analysis
Differentially expressed genes (DEGs) in the GSE194331 dataset were identified using the “Limma” package in R. DEGs were defined by an absolute log2 fold change (FC) ⩾.5 and an adjusted P-value < .05. DEGs were visualized using volcano plots generated by the “ggplot2” package.
Analysis of Differentially Expressed Genes in Groups With High and Low Monocyte Infiltration
AP samples were stratified into high and low monocyte infiltration groups based on the median monocyte abundance. DEGs between these groups were identified using the “Limma” package, with the same criteria of absolute log2 FC ⩾ 0.5 and adjusted P-value < .05. Volcano plots were used to visualize DEGs. We chose a log2 fold change threshold of 0.5 to capture a broad spectrum of differentially expressed genes, particularly in complex conditions like acute pancreatitis.
KEGG and GO Enrichment Analysis of HLA-DR-Regulated Genes
KEGG and Gene Ontology (GO) enrichment analyses were performed on HLA-DR-regulated genes, including DEGs identified in disease comparisons, genes from the WGCNA core module, and genes differentially expressed in monocyte infiltration groups. Enrichment analysis was conducted using the “clusterProfiler” package, with significance defined by an adjusted P-value < .05.
Single-Cell RNA-Seq Analysis of Mouse Peripheral Blood
Single-cell RNA sequencing data from mouse peripheral blood were subjected to rigorous quality control, retaining cells with over 500 detected features, less than 20% mitochondrial gene content, and more than 1000 RNA counts per cell. For clustering, cells were grouped based on the expression of specific marker genes, such as Ly6c for monocyte identification. The clustering resolution was determined based on the optimal separation of clusters, ensuring clear and biologically meaningful groupings. Data integration and dimensionality reduction were performed using PCA, followed by clustering at an appropriate resolution. Clusters were annotated using the SingleR package. Monocyte subpopulations were isolated for further analysis. Gene activity was assessed using the AUCell package, and pathway enrichment analysis was conducted using KEGG gene sets from the MSigDB database. Results were visualized using UMAP.
Core Node Analysis of HLA-DR-Regulated Genes
Core HLA-DR-regulated genes were identified using LASSO regression and Random Forest algorithms. LASSO analysis was performed using the “glmnet” package, and Random Forest analysis was conducted using the “randomForest” package in R. The intersection of core genes identified by both methods was determined using the “venn” package.
Differential Expression and ROC Curve Analysis of HLA-DR Core-Regulated Genes
Data from the GSE194331 dataset were standardized using “ggplot2.” Differential expression of HLA-DR core-regulated genes across AP severity groups (mild, moderate, severe) and controls was analyzed using One-Way ANOVA. ROC curves for these genes were generated using the “pROC” package, and AUC values were calculated.
Nomogram Analysis
Expression levels of disease-specific genes were extracted, and sample grouping information was retained across all 4 groups. A multivariate logistic regression model was constructed, and model parameters were used to calculate risk probabilities for each category. A nomogram was constructed using model coefficients to visually represent risk across the 4 categories.
Correlation Analysis of Core-Regulated Genes With HLA-DR Genes and Monocyte Abundance
Spearman’s correlation analysis was performed to assess the relationships between core-regulated genes, HLA-DR-related genes, and monocyte abundance. The results were visualized using the “ggplot2” package.
Drug Sensitivity Analysis
Potential small molecule drugs targeting HLA-DR-related genes were identified using the Enrichr database, which offers comprehensive gene set libraries. DSigDB was accessed via Enrichr to identify gene-related drugs. Only drugs with an adjusted P-value < .05 were considered significant, ensuring the robustness of the findings.
Results
Integrated Analysis of HLA-DR-Related Gene Expression, Diagnostic Potential, and Regulatory Networks in Acute Pancreatitis
Our study of the GSE194331 dataset identified 3 critical HLA-DR-related genes: HLA-DRA, HLA-DRB1, and HLA-DRB5. The transcription levels of these genes were significantly decreased in the AP group compared to the normal group (P < .01), with a pronounced decline correlating with disease severity (Figure 1A-C). ROC curve analysis revealed that HLA-DRA, HLA-DRB1, and HLA-DRB5 exhibit strong diagnostic sensitivity and specificity for AP, with AUC values of 0.761, 0.761, and 0.718, respectively (Figure 1D). Mechanistic exploration using single-gene GSEA demonstrated that HLA-DRA is mainly involved in pathways like PPAR, insulin signaling, Toll-like receptor, Nod-like receptor, and MAPK signaling in AP. HLA-DRB1 is primarily linked to complement and coagulation cascades, autophagy regulation, PPAR signaling, FcγR-mediated phagocytosis, and insulin signaling pathways, while HLA-DRB5 is associated with oxidative phosphorylation, PPAR signaling, carbohydrate metabolism, and ECM receptor interaction pathways (Supplemental Figures 1A-C). Additionally, miRNA-mRNA and TF-mRNA network analysis identified 18 miRNAs potentially regulating these genes, with hsa-miR-939-5p, hsa-miR-671-5p, and hsa-miR-1972 targeting both HLA-DRB1 and HLA-DRB5 (Figure 1E). Further, transcription factors such as TP53, PRDM, TEAD1, YY1, NR3C1, ESR1, and ZNF354C exhibited reduced expression levels in the AP group, while FOXC1 showed increased expression (Figure 1F).

Expression, Diagnostic Potential, and Regulatory Network of HLA-DR-Related Genes in Acute Pancreatitis. (A-C) Expression levels of HLA-DRA, HLA-DRB1, and HLA-DRB5 in AP patients compared to healthy controls, demonstrating a significant decrease with increasing disease severity. (D) ROC curve analysis showing the diagnostic performance of HLA-DRA, HLA-DRB1, and HLA-DRB5, with respective AUC values indicating their potential as biomarkers for AP. (E) mRNA-miRNA network illustrating the interaction between HLA-DRA, HLA-DRB1, and HLA-DRB5 with their respective miRNAs, highlighting shared miRNAs such as hsa-miR-939-5p, hsa-miR-671-5p, and hsa-miR-1972. (F) TF-mRNA network analysis depicting the transcription factors associated with HLA-DR-related genes in AP, including downregulated TP53, PRDM, TEAD1, and upregulated FOXC1.
Analysis of HLA-DRA, HLA-DRB1, and HLA-DRB5 and Correlation With Monocyte Abundance
Spearman correlation analysis revealed a positive relationship between the expression of HLA-DRA, HLA-DRB1, and HLA-DRB5 and monocyte abundance, with the correlation coefficients increasing in severity across mild, moderate, and severe acute pancreatitis groups (Figure 2A-C). This suggests that the expression of these HLA-DR-related genes is closely linked with monocyte levels, particularly in more severe cases of the disease.
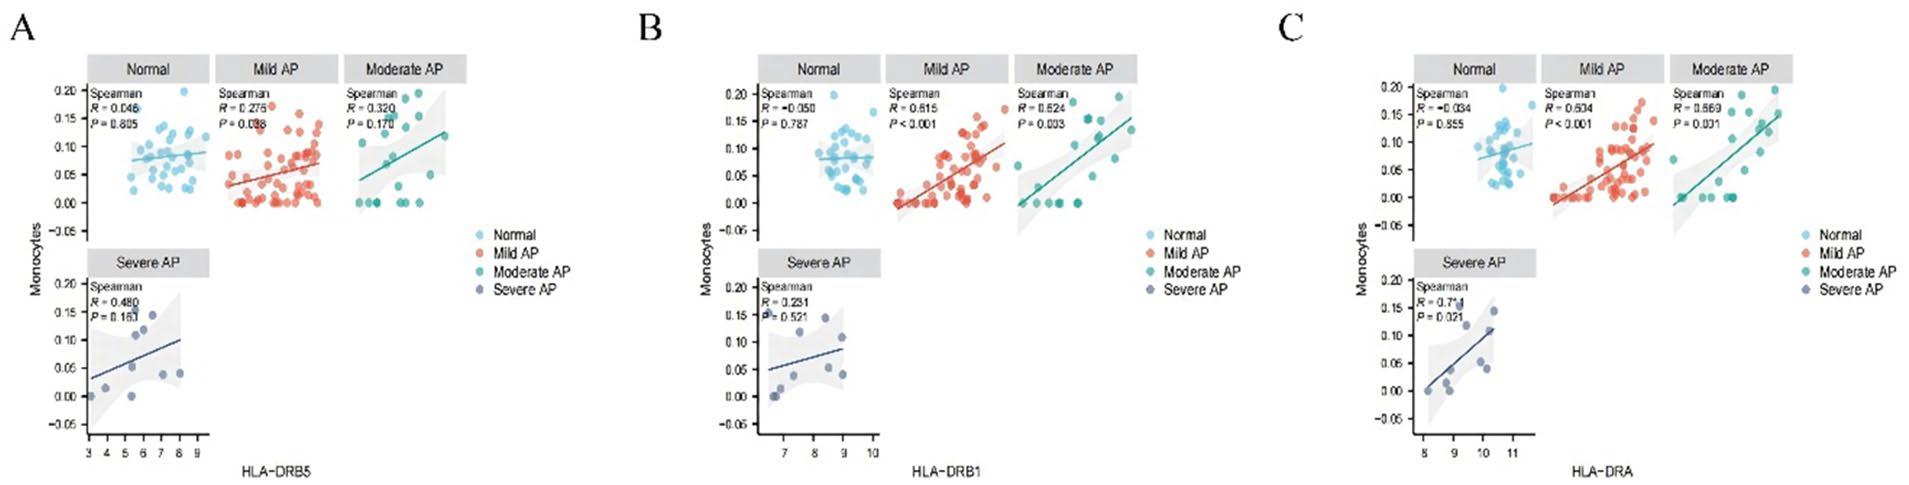
Analysis of HLA-DRA, HLA-DRB1 and HLA-DRB5 and correlation with monocyte abundance: (A) HLA-DRA, (B) HLA-DRB1, and (C) HLA-DRB5.
WGCNA Modules for HLA-DRA, HLA-DRB1, and HLA-DRB5
In the context of WGCNA for HLA-DRA, HLA-DRB1, and HLA-DRB5, our study explored the correlation dynamics between gene co-expression modules and gene phenotypes. We determined the optimal soft threshold power to be 16 (Figure 3A). The WGCNA analysis dendrogram illustrates the clustering of gene modules, highlighting the distinct module-gene relationships observed in our study (Figure 3B). Our analysis revealed a compelling negative correlation between the “darkred” module and the expression of HLA-DRA, HLA-DRB1, and HLA-DRB5, suggesting that as the expression of genes in this module increases, there is a corresponding decrease in the expression of these HLA-DR-related genes. Conversely, the “darkgreen” module showed a robust positive correlation with the expression of HLA-DRA, HLA-DRB1, and HLA-DRB5 (Figure 3C), indicating a coordinated increase in gene expression within this module alongside these genes.
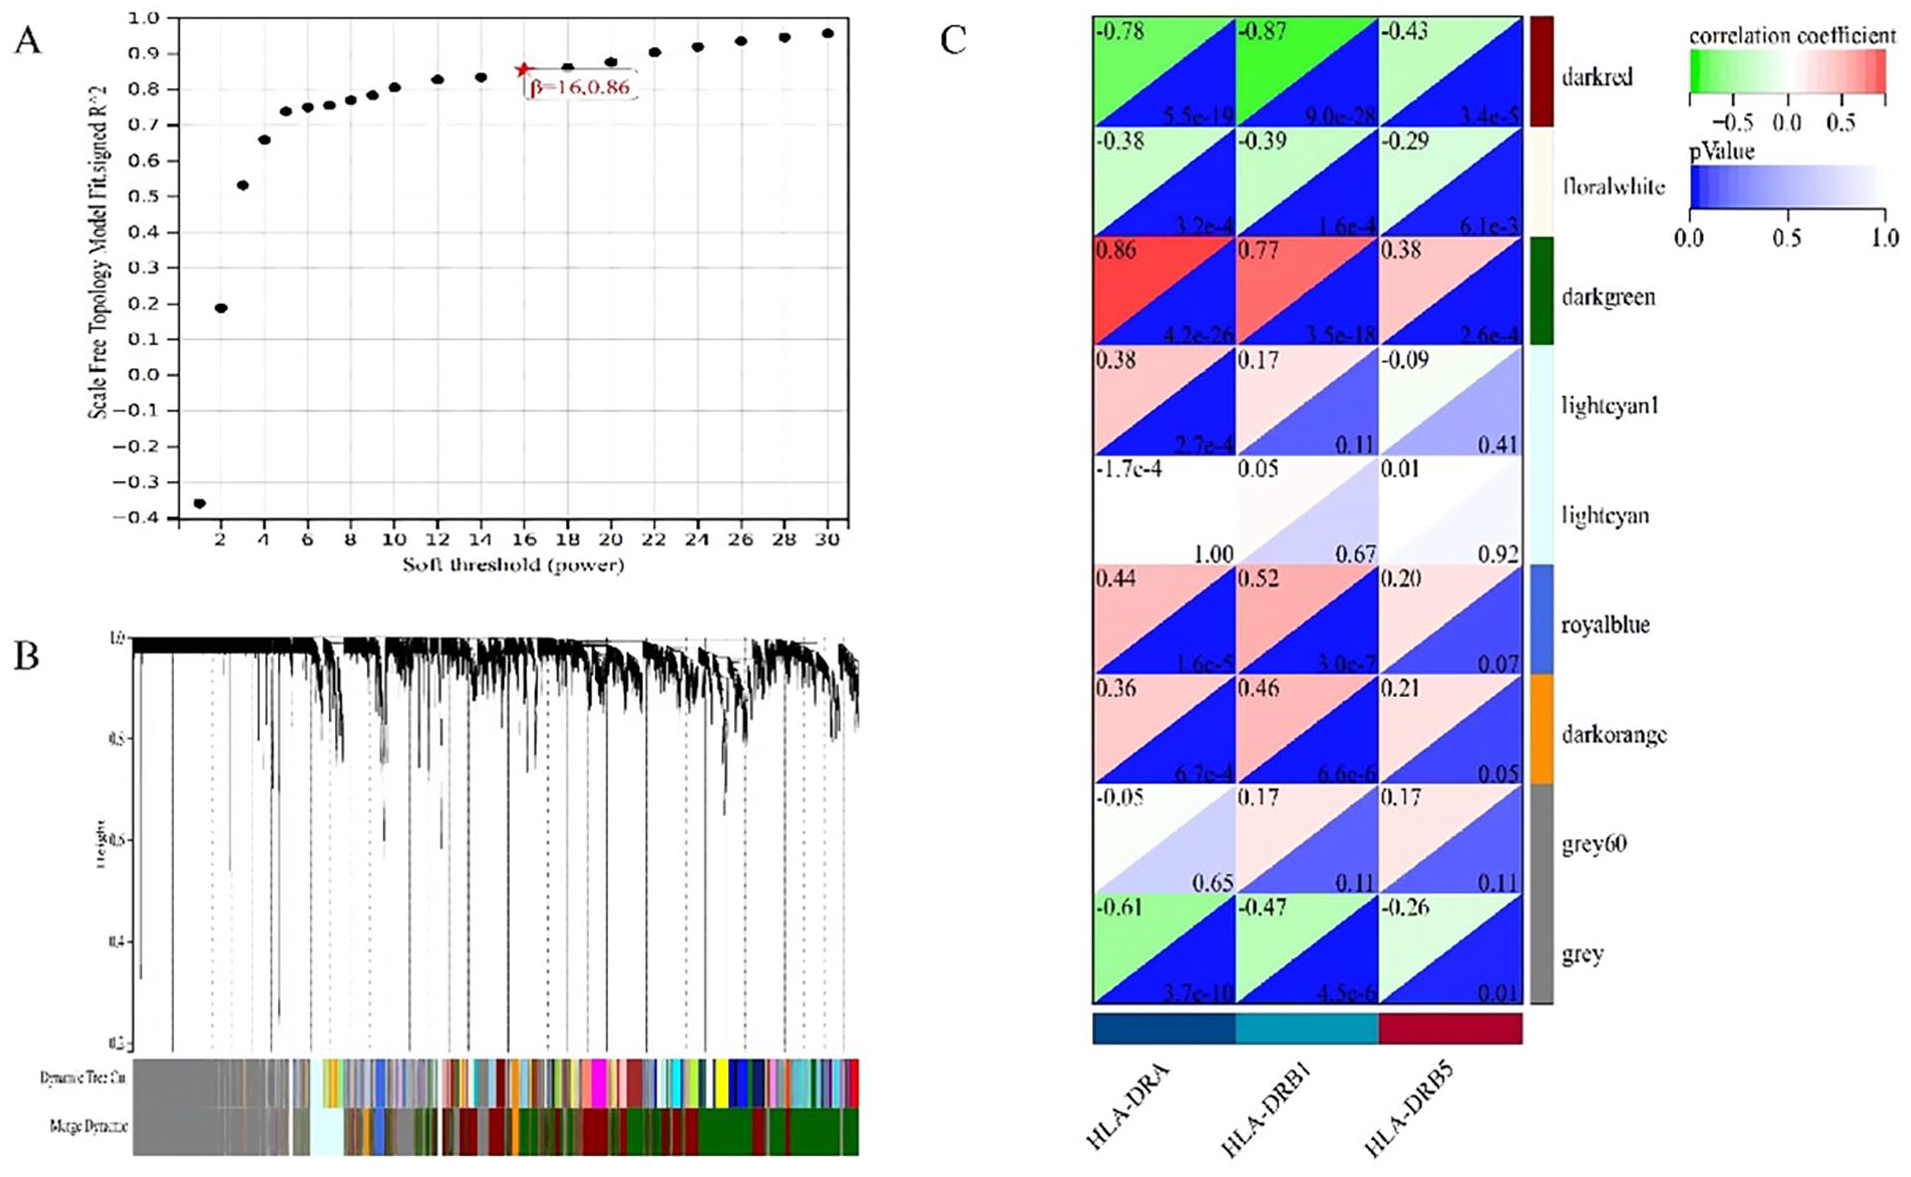
WGCNA analysis of HLA-DRA, HLA-DRB1, and HLA-DRB5 and their associated gene co-expression modules. (A)Determination of the soft threshold power, with the optimal value identified as 16 for network construction. (B) WGCNA dendrogram illustrating the clustering of genes into distinct modules. (C) Correlation analysis between gene modules and the expression of HLA-DRA, HLA-DRB1, and HLA-DRB5.
Regulatory Gene Analysis and Functional Enrichment of HLA-DRA, HLA-DRB1, and HLA-DRB5
In AP, monocyte infiltration was significantly reduced compared to the control group (P < .05, Figure 4A). Differential gene expression analysis of the GSE194331 dataset revealed 1801 differentially expressed genes (DEGs), with 982 up-regulated and 819 down-regulated genes (Figure 4B). Further analysis between groups with high and low monocyte infiltration identified 496 DEGs, including 187 up-regulated and 282 down-regulated genes (Figure 4C). Integrating the DEGs with WGCNA core modules and genes differentially expressed in monocyte infiltration groups resulted in 110 genes positively regulating HLA-DRA, HLA-DRB1, and HLA-DRB5, and 130 genes negatively regulating them (Figure 4D and E). GO and KEGG enrichment analyses revealed significant enrichment in pathways such as ribosome, hematopoietic cell lineage, Th17 cell differentiation, and the NF-kappa B signaling pathway (Figure 4F). Additionally, biological processes like cytoplasmic translation, regulation of leukocyte adhesion, and T cell activation were significantly enriched (Figure 4G).

Regulatory Gene Analysis and Functional Enrichment of HLA-DRA, HLA-DRB1, and HLA-DRB5. (A) Comparison of monocyte infiltration abundance between AP and control groups. (B) Differential gene screening results from the GSE194331 dataset, identifying up- and down-regulated genes. (C) Differential gene screening between high and low monocyte expression groups. (D and E) Integration of DEGs in AP, WGCNA core module genes, and DEGs between high and low monocyte expression groups to identify genes that positively and negatively regulate HLA-DRA, HLA-DRB1, and HLA-DRB5. (F) KEGG pathway enrichment analysis of regulatory genes associated with HLA-DRA, HLA-DRB1, and HLA-DRB5. (G) GO enrichment analysis highlighting significant biological processes linked to these regulatory genes.
Enrichment Analysis of Signaling Pathways in Monocyte Subgroups
In the AP model of mice, we employed integrated dimensionality reduction and clustering techniques to process the peripheral blood monocyte sequencing results. This approach successfully differentiated the cell populations into B cells, NK cells, T cells, monocytes, and granulocytes (Figure 5A). Subsequently, we extracted the monocytes for further dimensionality reduction and clustering. Based on the expression level of the Ly6c gene, we further divided the mouse monocytes into groups with high, medium, and low Ly6c expression (Figure 5B and C). We also performed AUC scoring in the mouse monocyte subgroups for the signaling pathways enriched by the regulatory genes related to HLA-DRA, HLA-DRB1, and HLA-DRB5. The results showed that the HEMATOPOIETIC CELL LINEAGE and CYTOKINE CYTOKINE RECEPTOR INTERACTION signaling pathways were significantly enriched mainly in the groups with high and medium Ly6c expression (Figure 5D).

Dimensionality Reduction and Clustering of Peripheral Blood Monocytes in the AP Model of Mice. (A) UMAP plot showing the annotated cell populations differentiated into B cells, NK cells, T cells, monocytes, and granulocytes. (B) UMAP plot illustrating the expression levels of the Ly6c gene in monocytes. (C) UMAP plot categorizing monocytes based on high, medium, and low Ly6c expression levels. (D) UMAP plot of AUC scoring results.
Core Node Analysis and Differential Expression of Regulatory Genes in AP
In the LASSO regression algorithm, 18 genes were identified as AP disease signature genes, while the RF algorithm identified 17 genes based on gene importance scores greater than 0.5 (Figure 6A-C). Using the Venn package to find the intersection, UCP2, GK, and SAMHD1 were identified as common to both algorithms and defined as the core nodes of the regulated genes (Figure 6D). The transcriptomic levels of UCP2 and SAMHD1 were significantly diminished in the AP group compared to the normal group (P < .01), with their expression levels decreasing as the disease severity increased (Figure 6E and G). Conversely, the transcript levels of GK were elevated in the AP group compared to the normal group (P < .01), but showed a declining trend with increasing disease severity (Figure 6F). ROC curve analysis revealed AUC values of 0.779, 0.761, and 0.844 for UCP2, GK, and SAMHD1, respectively, indicating their superior sensitivity and specificity in diagnosing AP (Figure 6H). Additionally, Figure 6I presents the nomogram analysis results for these 3 signature genes across mild, moderate, and severe AP cases.

Core Node Analysis and Differential Expression of Regulatory Genes in AP. (A)Identification of AP disease signature genes using the LASSO regression algorithm. (B and C) Identification of AP disease signature genes using the RF algorithm. (D) Venn diagram showing the intersection of genes identified by both algorithms, highlighting UCP2, GK, and SAMHD1 as core nodes. (E-G) Differential expression analysis of UCP2, GK, and SAMHD1, showing their transcriptomic levels in the AP group compared to the normal group. (H) ROC curve analysis of UCP2, GK, and SAMHD1, demonstrating their sensitivity and specificity in diagnosing AP. (I) Nomogram analysis results for UCP2, GK, and SAMHD1 across mild, moderate, and severe AP cases.
Correlation Analysis of UCP2, GK, and SAMHD1 With HLA-DRA, HLA-DRB1, and HLA-DRB5
Spearman’s correlation analysis revealed that UCP2 and SAMHD1 were negatively correlated with the expression levels of HLA-DRA, HLA-DRB1, and HLA-DRB5, as well as with monocyte abundance. In contrast, GK exhibited a positive correlation with the expression levels of HLA-DRA, HLA-DRB1, and HLA-DRB5, along with monocyte abundance (Figure 7A-I and Supplemental Figure 2).
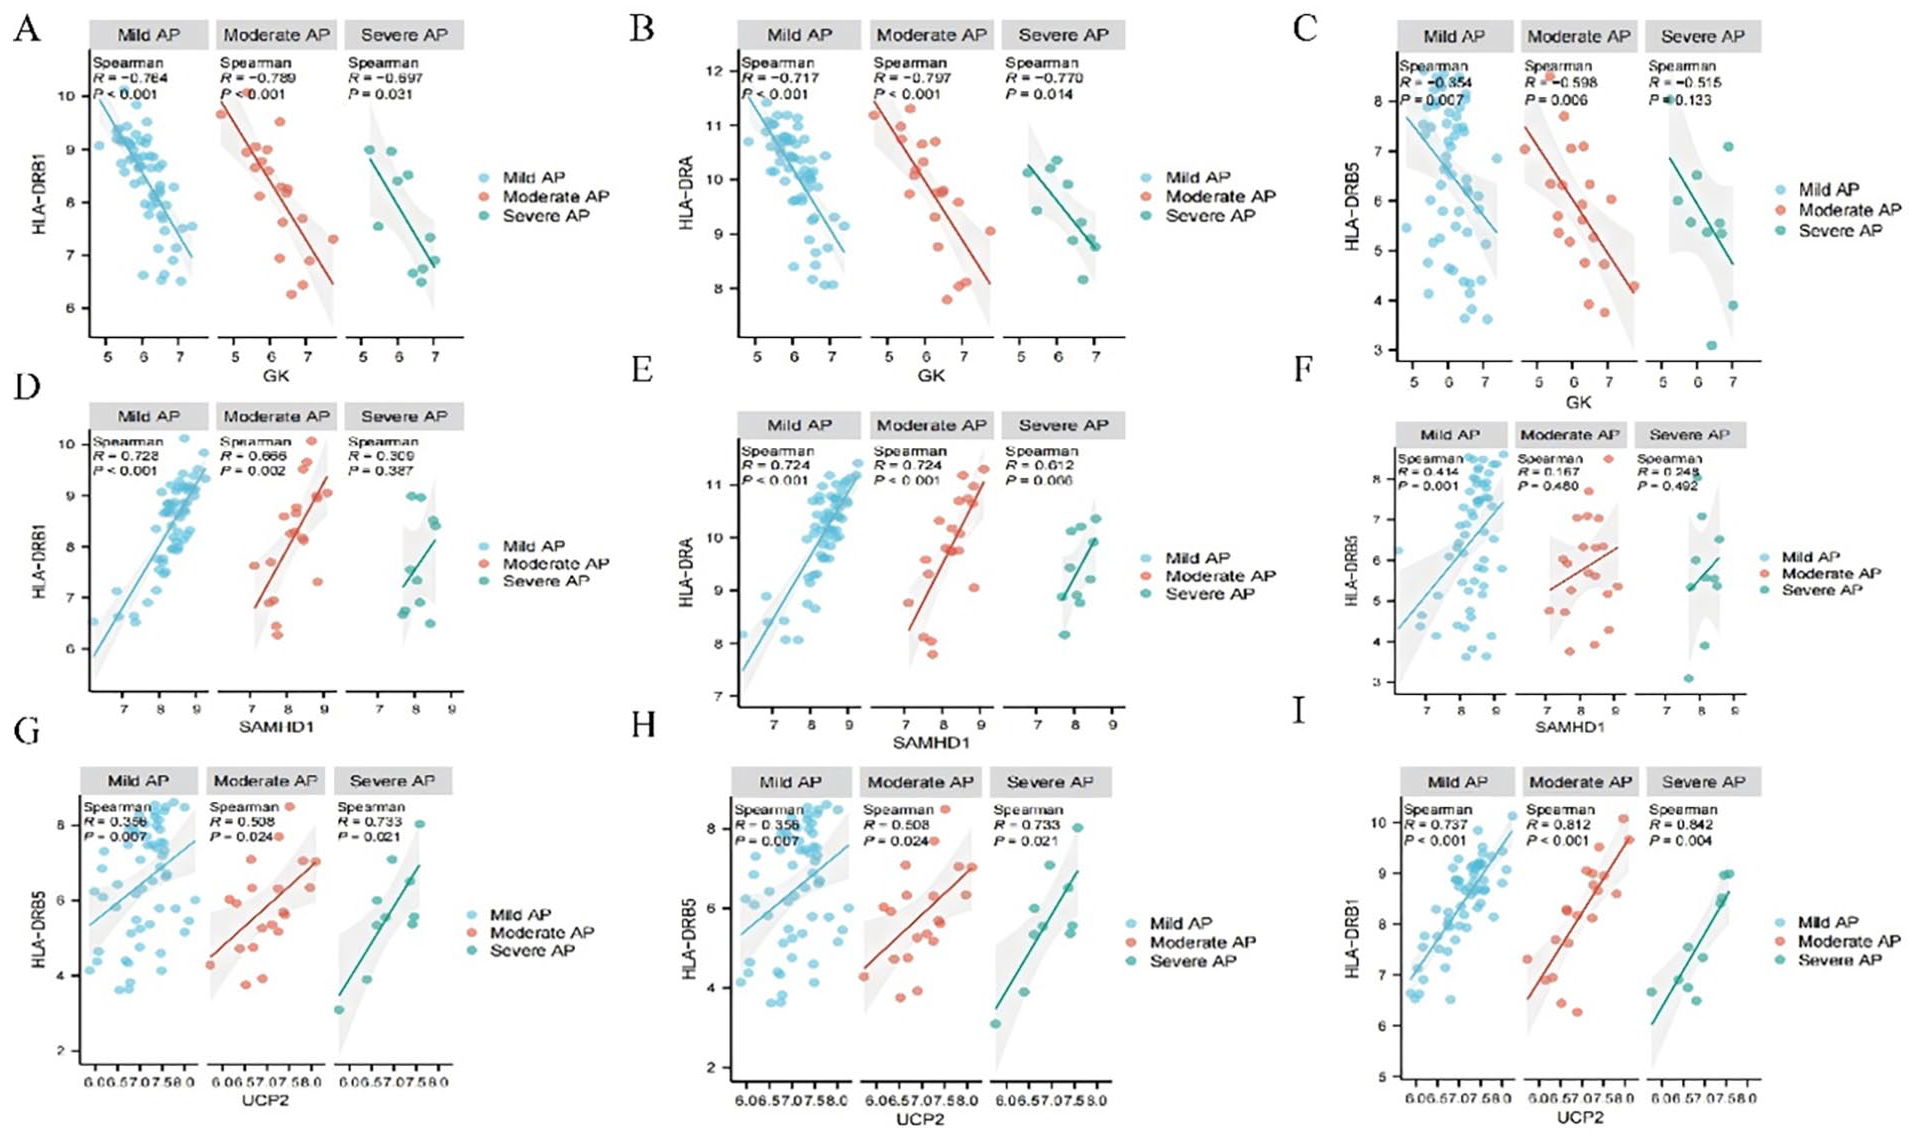
Correlation analysis of UCP2, GK, and SAMHD1 with HLA-DRA, HLA-DRB1, and HLA-DRB5. Correlation analysis of GK with HLA-DRB1 (A), HLA-DRA (B), and HLA-DRB5 (C). Correlation analysis of SAMHD1 with HLA-DRB1 (D), HLA-DRA (E), and HLA-DRB5 (F). Correlation analysis of UCP2 with HLA-DRB1 (G), HLA-DRA (H), and HLA-DRB5 (I).
Drug Sensitivity Analyses
Potential therapeutic agents targeting HLA-DRA, HLA-DRB1, and HLA-DRB5 were scrutinized utilizing the Enrichr database (Table 1). Similarly, potential drugs acting upon UCP2, GK, and SAMHD1 were analyzed based on the same Enrichr database (Table 2).
Potential drugs acting on HLA-DRA, HLA-DRB1, and HLA-DRB5 were analyzed based on the Enrichr database.

Potential drugs acting on UCP2, GK, and SAMHD1 were analyzed based on the Enrichr database.

Discussion
AP is a prevalent and severe condition characterized by acute inflammation of the pancreas. 22 It remains a leading cause of hospital admissions in developed nations, with its incidence showing an upward trend over recent years. 2 Although considerable progress has been made in understanding its pathogenesis, the disease mechanisms are still not fully elucidated. The activation of digestive enzymes within the pancreas is commonly hypothesized as a primary trigger, 6 and several factors—including alcohol consumption, a high-fat diet, cholelithiasis, certain medications, and genetic predispositions—are known to correlate with the onset of AP. 23 The disease typically presents with symptoms such as intense abdominal pain, nausea, and vomiting, and in severe cases, it can lead to multiple organ dysfunction syndrome and even mortality. 24 Currently, the therapeutic approach to AP is primarily supportive and symptomatic, with surgical intervention required in more severe cases. 25 A comprehensive study of AP is thus crucial for advancing our understanding of its pathogenesis, refining diagnostic approaches, and improving treatment outcomes.
HLA-DR, a major histocompatibility complex, encodes a protein essential for antigen presentation in the immune system. 12 The role of HLA-DR-related genes in disease susceptibility has garnered increasing attention, particularly in studies of AP. 26 For instance, it has been observed that HLA-DR expression is significantly suppressed in patients with AP and that HLA-DR levels rapidly recover following treatment in mildly affected patients. 27 Research by Mentula et al demonstrated that HLA-DR expression could reflect the severity of the anti-inflammatory response and might serve as a predictive marker for clinical outcomes in AP. 28 Further studies by Yu et al suggest that persistent suppression of HLA-DR is associated with the development of sepsis and poor outcomes in AP patients. 14 Our study examined the association between HLA-DR-related genes and AP risk, revealing that 3 specific genes—HLA-DRA, HLA-DRB1, and HLA-DRB5—were negatively associated with AP severity and exhibited good sensitivity and specificity in diagnosing the disease.
Monocytes play a crucial role in the immune system by regulating and mediating inflammatory responses. In the context of AP, changes in monocyte quantity and activity can significantly influence the disease’s progression and severity. Existing literature indicates that monocyte function is notably compromised during AP episodes. 29 Monocytes are known to secrete various inflammatory mediators, including TNF-α, IL-6, and IL-8, all of which are closely linked to the inflammatory response within pancreatic tissues. 30 Prior studies have identified that in SAP, an intense pro-inflammatory burst is often followed by compensatory anti-inflammatory response syndrome (CARS), leading to immunosuppression. 31 The onset of CARS can induce lymphocyte apoptosis, monocyte inactivation, and reduced mHLA-DR expression. 13 Ding et al found an increased proportion of myeloid-derived suppressor cells (MDSCs) in the peripheral blood of AP patients, correlating positively with disease severity. 32 In our study, we identified a significant relationship between monocyte abundance and AP progression. Monocyte abundance was notably reduced in AP patients, consistent with the expression patterns of HLA-DR-related genes. Further analysis identified UCP2, GK, and SAMHD1 as central nodes in the regulated gene network. Notably, SAMHD1 showed superior sensitivity and specificity for AP diagnosis. Experimental studies in animals confirmed that UCP2 deficiency exacerbates the severity of AP in aged mice, although the roles of GK and SAMHD1 in AP require further investigation. 33
Considering the involvement of HLA-DR-related genes and monocytes in AP, it is evident that a complex interplay exists between them. The expression of specific HLA-DR genes may influence the risk of AP pathogenesis by modulating monocyte activity. Based on our findings regarding HLA-DR-related genes and monocyte infiltration in AP, we also identified potential therapeutic agents that target these pathways. Drug sensitivity analysis revealed 20 candidate drugs, including those targeting HLA-DRA, HLA-DRB1, HLA-DRB5, UCP2, GK, and SAMHD1. For example, Tamibarotene, a synthetic retinoid, has demonstrated anti-inflammatory effects in various diseases, including acute promyelocytic leukemia (APL), Alzheimer’s disease, and sepsis-associated lung injury.34 -36 6-Mercaptopurine, an immunomodulator and steroid-sparing agent, is commonly used in the treatment of autoimmune pancreatitis to mitigate the adverse effects of long-term corticosteroid therapy. 37 Although Irinotecan hydrochloride is primarily used for treating pancreatic cancer, its effects on AP remain unexplored. 38 We hypothesize that these drugs could enhance the immune system’s ability to regulate inflammation by modulating HLA-DR expression, potentially mitigating the pathological progression of AP.
While our study provides valuable insights, several limitations must be acknowledged. Firstly, our conclusions are predominantly based on bioinformatics analyses, which require further validation through experimental and clinical studies. Secondly, the dataset used in this study has limitations in terms of sample size and the lack of demographic details, such as sex, age, and race. These factors may limit the generalizability of our findings, as they restrict our ability to assess how such variables may influence the observed patterns. Thirdly, given the multifactorial nature of AP, its pathogenesis may be influenced by various genetic and environmental factors that were not fully accounted for. Additionally, while we focused on HLA-DR-related genes and monocytes, other immune cells and molecules likely play critical roles in AP’s pathogenesis and progression, representing an avenue for future research. Lastly, we acknowledge the limitations of the algorithms used in our study, particularly the potential bias in variable selection with LASSO regression. To address this, future studies could incorporate methods like cross-validation or alternative feature selection techniques to improve the robustness and reliability of the findings.
Conclusion
In summary, our study reveals the association between HLA-DR-related genes, monocyte abundance and AP, and predicts potential drugs targeting the expression of HLA-DR molecules to alleviate or protect against pancreatitis. This study provides important clues to our in-depth understanding of the pathophysiologic process of AP and provides a theoretical basis for the development of new therapeutic strategies.
Supplemental Material
sj-docx-1-bec-10.1177_11795972251328458 – Supplemental material for Prediction of Potential Drugs Targeting Acute Pancreatitis Based on the HLA-DR-Related Gene-Monocyte Infiltration Regulatory Network
Supplemental material, sj-docx-1-bec-10.1177_11795972251328458 for Prediction of Potential Drugs Targeting Acute Pancreatitis Based on the HLA-DR-Related Gene-Monocyte Infiltration Regulatory Network by Wei Xu, Lan Hu, Shengyi Shi, Jie Gao, Jing Ye and Yiming Lu in Biomedical Engineering and Computational Biology
Footnotes
References
Supplementary Material
Please find the following supplemental material available below.
For Open Access articles published under a Creative Commons License, all supplemental material carries the same license as the article it is associated with.
For non-Open Access articles published, all supplemental material carries a non-exclusive license, and permission requests for re-use of supplemental material or any part of supplemental material shall be sent directly to the copyright owner as specified in the copyright notice associated with the article.