
Abstract
Background:
Colorectal cancer (CRC) remains a significant health burden globally, necessitating a deeper understanding of its molecular landscape and prognostic markers. This study characterized ferroptosis-related genes (FRGs) to construct models for predicting overall survival (OS) across various CRC datasets.
Methods:
In TCGA-COAD dataset, differentially expressed genes (DEGs) were identified between tumor and normal tissues using DESeq2 package. Prognostic genes were identified associated with OS, disease-specific survival, and progression-free interval using survival package. Additionally, FRGs were downloaded from FerrDb website, categorized into unclassified, marker, and driver genes. Finally, multiple models (Coxboost, Elastic Net, Gradient Boosting Machine, LASSO Regression, Partial Least Squares Regression for Cox Regression, Ridge Regression, Random Survival Forest [RSF], stepwise Cox Regression, Supervised Principal Components analysis, and Support Vector Machines) were employed to predict OS across multiple datasets (TCGA-COAD, GSE103479, GSE106584, GSE17536, GSE17537, GSE29621, GSE39084, GSE39582, and GSE72970) using intersection genes across DEGs, OS, disease-specific survival, and progression-free interval, and FRG categories.
Results:
Six intersection genes (ASNS, TIMP1, H19, CDKN2A, HOTAIR, and ASMTL-AS1) were identified, upregulated in tumor tissues, and associated with poor survival outcomes. In the TCGA-COAD dataset, the RSF model demonstrated the highest concordance index. Kaplan-Meier analysis revealed significantly lower OS probabilities in high-risk groups identified by the RSF model. The RSF model exhibited high accuracy with AUC values of 0.978, 0.985, and 0.965 for 1-, 3-, and 5-year survival predictions, respectively. Calibration curves demonstrated excellent agreement between predicted and observed survival probabilities. Decision curve analysis confirmed the clinical utility of the RSF model. Additionally, the model’s performances were validated in GSE29621 dataset.
Conclusions:
The study underscores the prognostic relevance of 6 intersection genes in CRC, providing insights into potential therapeutic targets and biomarkers for patient stratification. The RSF model demonstrates robust predictive performance, suggesting its utility in clinical risk assessment and personalized treatment strategies.
Introduction
Colorectal cancer (CRC) stands as one of the leading causes of cancer-related mortality worldwide, with its incidence and mortality rates showing considerable geographic variation. 1 Despite advances in screening and treatment strategies, the prognosis for CRC patients remains variable, underscoring the necessity for improved prognostic markers and personalized treatment approaches. 2 Recent research has increasingly focused on the molecular characteristics of CRC, aiming to elucidate the complex interactions between genetic alterations and cancer progression. 3 Among the molecular mechanisms under investigation, ferroptosis, a form of regulated cell death characterized by iron-dependent lipid peroxidation, has emerged as a significant area of interest. 4 Ferroptosis-related genes (FRGs) have been implicated in cancer biology, offering new insights into tumor suppression, drug resistance, and prognostic markers.5,6
Prior studies have explored the role of FRGs in various cancers, including CRC, highlighting their potential as therapeutic targets and prognostic indicators.7,8 The identification of differentially expressed genes (DEGs) between tumor and normal tissues has been a fundamental approach to understanding cancer’s molecular basis.9,10 Tools such as the DESeq2 package have enabled researchers to systematically analyze these differences, laying the groundwork for identifying prognostic genes associated with overall survival (OS), disease-specific survival (DSS), and progression-free interval (PFI). 11 The integration of survival analysis with the molecular characterization of cancer has led to the development of predictive models capable of forecasting patient outcomes with greater accuracy.
The prognostic significance of FRGs in CRC has been corroborated by various studies. For instance, research utilizing The Cancer Genome Atlas (TCGA) and other datasets has identified specific FRGs that correlate with survival outcomes, offering a molecular basis for risk stratification. 12 These studies have employed a range of statistical and machine learning models, including Cox regression, 13 LASSO regression, 14 and Random Survival Forest (RSF), 15 to analyze the prognostic potential of FRGs. The RSF model, in particular, has gained attention for its ability to handle high-dimensional data and its robust performance in survival prediction. 16
However, despite these advancements, challenges remain in the comprehensive understanding of FRGs’ role in CRC prognosis. The variability in model performance across different datasets and the complexity of integrating molecular data with clinical outcomes call for further research to optimize predictive models for clinical application. 17 In this context, our study aims to bridge these gaps by characterizing FRGs and constructing predictive models for OS across multiple CRC datasets. By analyzing intersection genes across DEGs, OS, DSS, and PFI, and FRGs, we seek to refine the predictive accuracy of 10 models and contribute to the personalized treatment of CRC.
Methods
Data collection and preprocessing
This study primarily utilized the TCGA-Colon Adenocarcinoma (TCGA-COAD) dataset for initial analysis, with further validation across multiple external datasets including GSE103479, 18 GSE106584, 19 GSE17536, 20 GSE17537, 20 GSE29621, 21 GSE39084, 22 GSE39582, 23 and GSE72970. 24 These datasets were chosen for their comprehensive coverage of CRC cases and downloaded from GEO database. GSE103479 comprised a cohort of 363 stage II and III CRC patients from 4 European centers. RNA and DNA were extracted from 194 samples with ⩾50% tumor content, and high-quality transcriptomic data were obtained from 156 samples using the Almac Xcel array. GSE106584 involved whole transcriptome gene expression profiling of 156 CRC patient samples (Stage I-IV) using the HTA platform. GSE17536 and GSE17537 included gene expression data from mouse colon cancer cell lines and were refined using data from patient samples (55 VMC and 177 Moffitt samples) to develop a metastasis gene expression profile. GSE29621 analyzed mRNA extracted from colon tissues through microarray techniques. GSE39084 involved 70 patients categorized by age and mismatch repair status, with key gene mutations assessed and gene expression profiles obtained using Affymetrix GeneChip. GSE39582 included 598 colon cancer samples analyzed for mRNA expression using the Affymetrix U133plus2 chip. This dataset was a part of the Cartes d’Identité des Tumeurs (CIT) program, with DNA alteration profiles available for 463 samples. GSE72970 was derived from the COSIVAL cohort, a retrospective study involving 68 patients from multiple French hospitals and cancer centers. The RNAseq data processed through the STAR pipeline for the TCGA-COAD project was obtained from the TCGA database. Additionally, we employed the Variance Stabilizing Transformations method provided by the DESeq2 (version 1.36.0) package to normalize the raw count matrix. 25 Prognostic information was sourced from the study conducted by Jianfang Liu et al. 26 The TCGA-COAD dataset comprises 41 normal samples and 478 tumor samples.
Identification of DEGs
The DESeq2 package in R was employed to identify DEGs between tumor and normal tissues within the TCGA-COAD dataset. DEGs were determined based on adjusted P-values (<.05) using the Benjamini-Hochberg procedure to control the false discovery rate (FDR), and a log2 fold change threshold was set to identify significant DEGs.
Survival analysis
We utilized the survival package (version 3.3.1) in R to identify prognostic genes associated with OS, DSS, and PFI. Initially, we conducted univariate Cox regression analyses to assess the relationship between the expression of each gene and survival outcomes. Genes with a P-value <.05 were deemed statistically significant and chosen for further analysis. Subsequently, to validate the Cox regression analysis, we assessed the proportional hazards assumption using the survival package.
FRG categorization
We retrieved FRGs from FerrDb V2, a meticulously curated database containing ferroptosis regulators and their associations with diseases, sourced from published journal articles. 27 These genes were categorized into 3 groups: unclassified, markers, and drivers, based on their known functions and roles in ferroptosis.
Model construction and validation
To construct predictive models for OS, 10 different statistical and machine learning methods were employed: Coxboost, Elastic Net (Enet), Gradient Boosting Machine (GBM), LASSO Regression, Partial Least Squares Regression for Cox Regression (plsRcox), Ridge Regression, RSF, stepwise Cox Regression (stepCox), Supervised Principal Components analysis (SuperPC), and Support Vector Machines (SVM). These models were chosen for their ability to handle high-dimensional data and their application in survival analysis. Each model was trained using 6 intersection genes identified across DEGs, survival analysis, and FRG categories.
The models were initially trained and validated within the TCGA-COAD dataset using a cross-validation approach to optimize model parameters and avoid overfitting. This dataset was chosen for its comprehensive transcriptomic and clinical data specific to colorectal cancer. Subsequently, the models were externally validated across the aforementioned datasets. These datasets in GEO database were selected based on criteria such as data quality and availability of survival outcomes. This step was crucial to assess the generalizability of the models across different patient populations. For each model, specific tuning methods were applied to enhance performance. For the RSF model, we fine-tuned specific parameters to optimize performance. We set the nodesize parameter to 5 to control the minimum size of terminal nodes, the nsplit parameter to 10 to determine the number of random splits to consider for each node, and utilized the logrank splitrule for node splitting to enhance the model’s focus on survival differences. For the Coxboost model, tuning included setting the “Coxboost type” to “verweij.” For the Enet model, the “alpha” parameter was set to 0.5, and the “lambda” rule was designated as “lambda.min” for optimal shrinkage. For the GBM model, the “nodesize” parameter was set to 5. For the LASSO Regression model, the “lambda” rule was set to “lambda.min.” For the plsRcox model, the “lambda” rule was “lambda.min.” For the Ridge Regression model, we used the “lambda” rule “lambda.min.” For the stepCox model, the “direction” parameter was set to “both” for variable selection. For the SuperPC model, the “ncomponents” parameter was set to 1. For the SVM model, we utilized “type” as “vanbelle1,” “diffmeth” as “makediff1,” “optmeth” as “quadprog,” and “kernel” as “add_kernel.” Model performance was evaluated based on the concordance index (C-index), area under the receiver operating characteristic curve (AUC), calibration curves, and decision curve analysis (DCA) to assess their predictive accuracy and clinical usefulness.
Statistical analysis
All statistical analyses were performed using R software (version 4.2.1). Statistical comparisons between 2 independent groups were conducted using the Wilcoxon rank sum test, while comparisons between paired samples employed the Wilcoxon signed rank test. Normality was assessed using the Shapiro-Wilk test, and homogeneity of variances was tested using Levene’s test. Log-rank tests were used to compare survival distributions. Visualization of the data was performed using the ggplot2 package (version 3.3.6).
Results
Identification of ferroptosis-related intersection genes in CRC
In an initial exploration of the TCGA-COAD dataset, our analysis focused on understanding the landscape of DEGs and their prognostic implications in CRC. Employing stringent selection criteria (log2 fold change ⩾ 1 and adjusted P-value < .05), we identified a set of 11 115 DEGs between tumor and normal tissues. Furthermore, we categorized genes based on their association with OS, DSS, and PFI, and classified FRGs into 3 categories: unclassified genes (genes associated with ferroptosis, but whose regulatory roles are unclear), markers (genes that indicate the occurrence of ferroptosis), and drivers (genes that promote ferroptosis) based on their roles in ferroptosis. An upset plot highlighted the intersection among these categories, revealing 6 key genes—ASNS, TIMP1, H19, CDKN2A, HOTAIR, and ASMTL-AS1—that were not only differentially expressed but also held prognostic significance across OS, DSS, PFI, and were related to ferroptosis (Figure 1A).

Comprehensive Analysis of Gene Expression and Prognostic Significance in TCGA-COAD Dataset. (A) An upset plot illustrating the intersections among differentially expressed genes (DEGs) in tumor versus normal tissues, three categories of prognostic genes associated with overall survival (OS), disease-specific survival (DSS), and progression-free interval (PFI), along with three types of ferroptosis-related genes (FRGs): unclassified genes (those associated with ferroptosis whose regulatory roles are not yet defined), markers (genes indicating the occurrence of ferroptosis), and drivers (genes promoting ferroptosis). DEGs were selected based on criteria of a log2 fold change ⩾ 1 and an adjusted P-value (Padj) <.05. Prognostic genes for poor OS, DSS, and PFI were identified with hazard ratios > 1 and P-values < .05. The analysis identified six intersection genes—ASNS, TIMP1, H19, CDKN2A, HOTAIR, and ASMTL-AS1—that concurrently appear across DEGs, OS, DSS, PFI, and FRG categories. (B) The expression levels of the six intersection genes in unpaired tumor versus normal tissues within the TCGA-COAD dataset. These 6 genes were all upregulated in tumor tissues. (C) The expression levels of the six intersection genes in paired tumor versus normal tissues within the TCGA-COAD dataset. These 6 genes were all upregulated in paired tumor tissues.
Expression patterns of intersection genes
Subsequent analysis of expression levels in the TCGA-COAD dataset demonstrated that these 6 intersection genes were consistently upregulated in tumor tissues compared to normal tissues. This pattern was observed both in unpaired (Figure 1B) and paired sample analyses (Figure 1C), underscoring the potential role of these genes in tumorigenesis and their association with ferroptosis in CRC.
Prognostic impact of ferroptosis-related intersection genes
Further investigation into the prognostic significance of the 6 intersection genes was conducted through survival analysis. A forest plot was constructed to visually represent the hazard ratios for OS, DSS, and PFI associated with each of the 6 genes. The analysis illuminated the considerable prognostic impact these genes possess, with all 6 showing significant associations with survival outcomes in the TCGA-COAD dataset (Figure 2). This evidence strongly suggests that the dysregulation of these FRGs plays a critical role in the prognosis of CRC patients, highlighting their potential as biomarkers for disease progression and treatment response.

Prognostic Impact of Intersection Genes on Survival Outcomes in TCGA-COAD Dataset. A forest plot displaying the prognostic significance of the six intersection genes in relation to OS, DSS, and PFI within the TCGA-COAD dataset.
Multi-model prognostic prediction analysis across diverse datasets
Our comprehensive assessment extended to evaluating the efficacy of various statistical and machine learning models for predicting OS in CRC across multiple datasets. We employed a wide array of modeling techniques, including Coxboost, Elastic Net (Enet), Gradient Boosting Machine (GBM), LASSO Regression, Partial Least Squares Regression for Cox Regression (plsRcox), Ridge Regression, Random Survival Forest (RSF), stepwise Cox Regression (stepCox), Supervised Principal Components analysis (SuperPC), and Support Vector Machines (SVM). These models were applied to datasets from TCGA-COAD and 8 additional studies (GSE103479, GSE106584, GSE17536, GSE17537, GSE29621, GSE39084, GSE39582, and GSE72970) to derive risk scores, hazard ratios, and concordance indexes (C-indexes), crucial for evaluating the predictive accuracy of each model.
The analysis revealed significant variability in model performance across the different datasets. Notably, in the TCGA-COAD dataset, the RSF model emerged as the top performer, boasting the highest C-index among the evaluated models (Figures 3 and 4). This finding underscores the RSF model’s superior ability to handle the complex nature of transcriptomic data, capturing intricate interactions between genes and their prognostic significance in CRC.
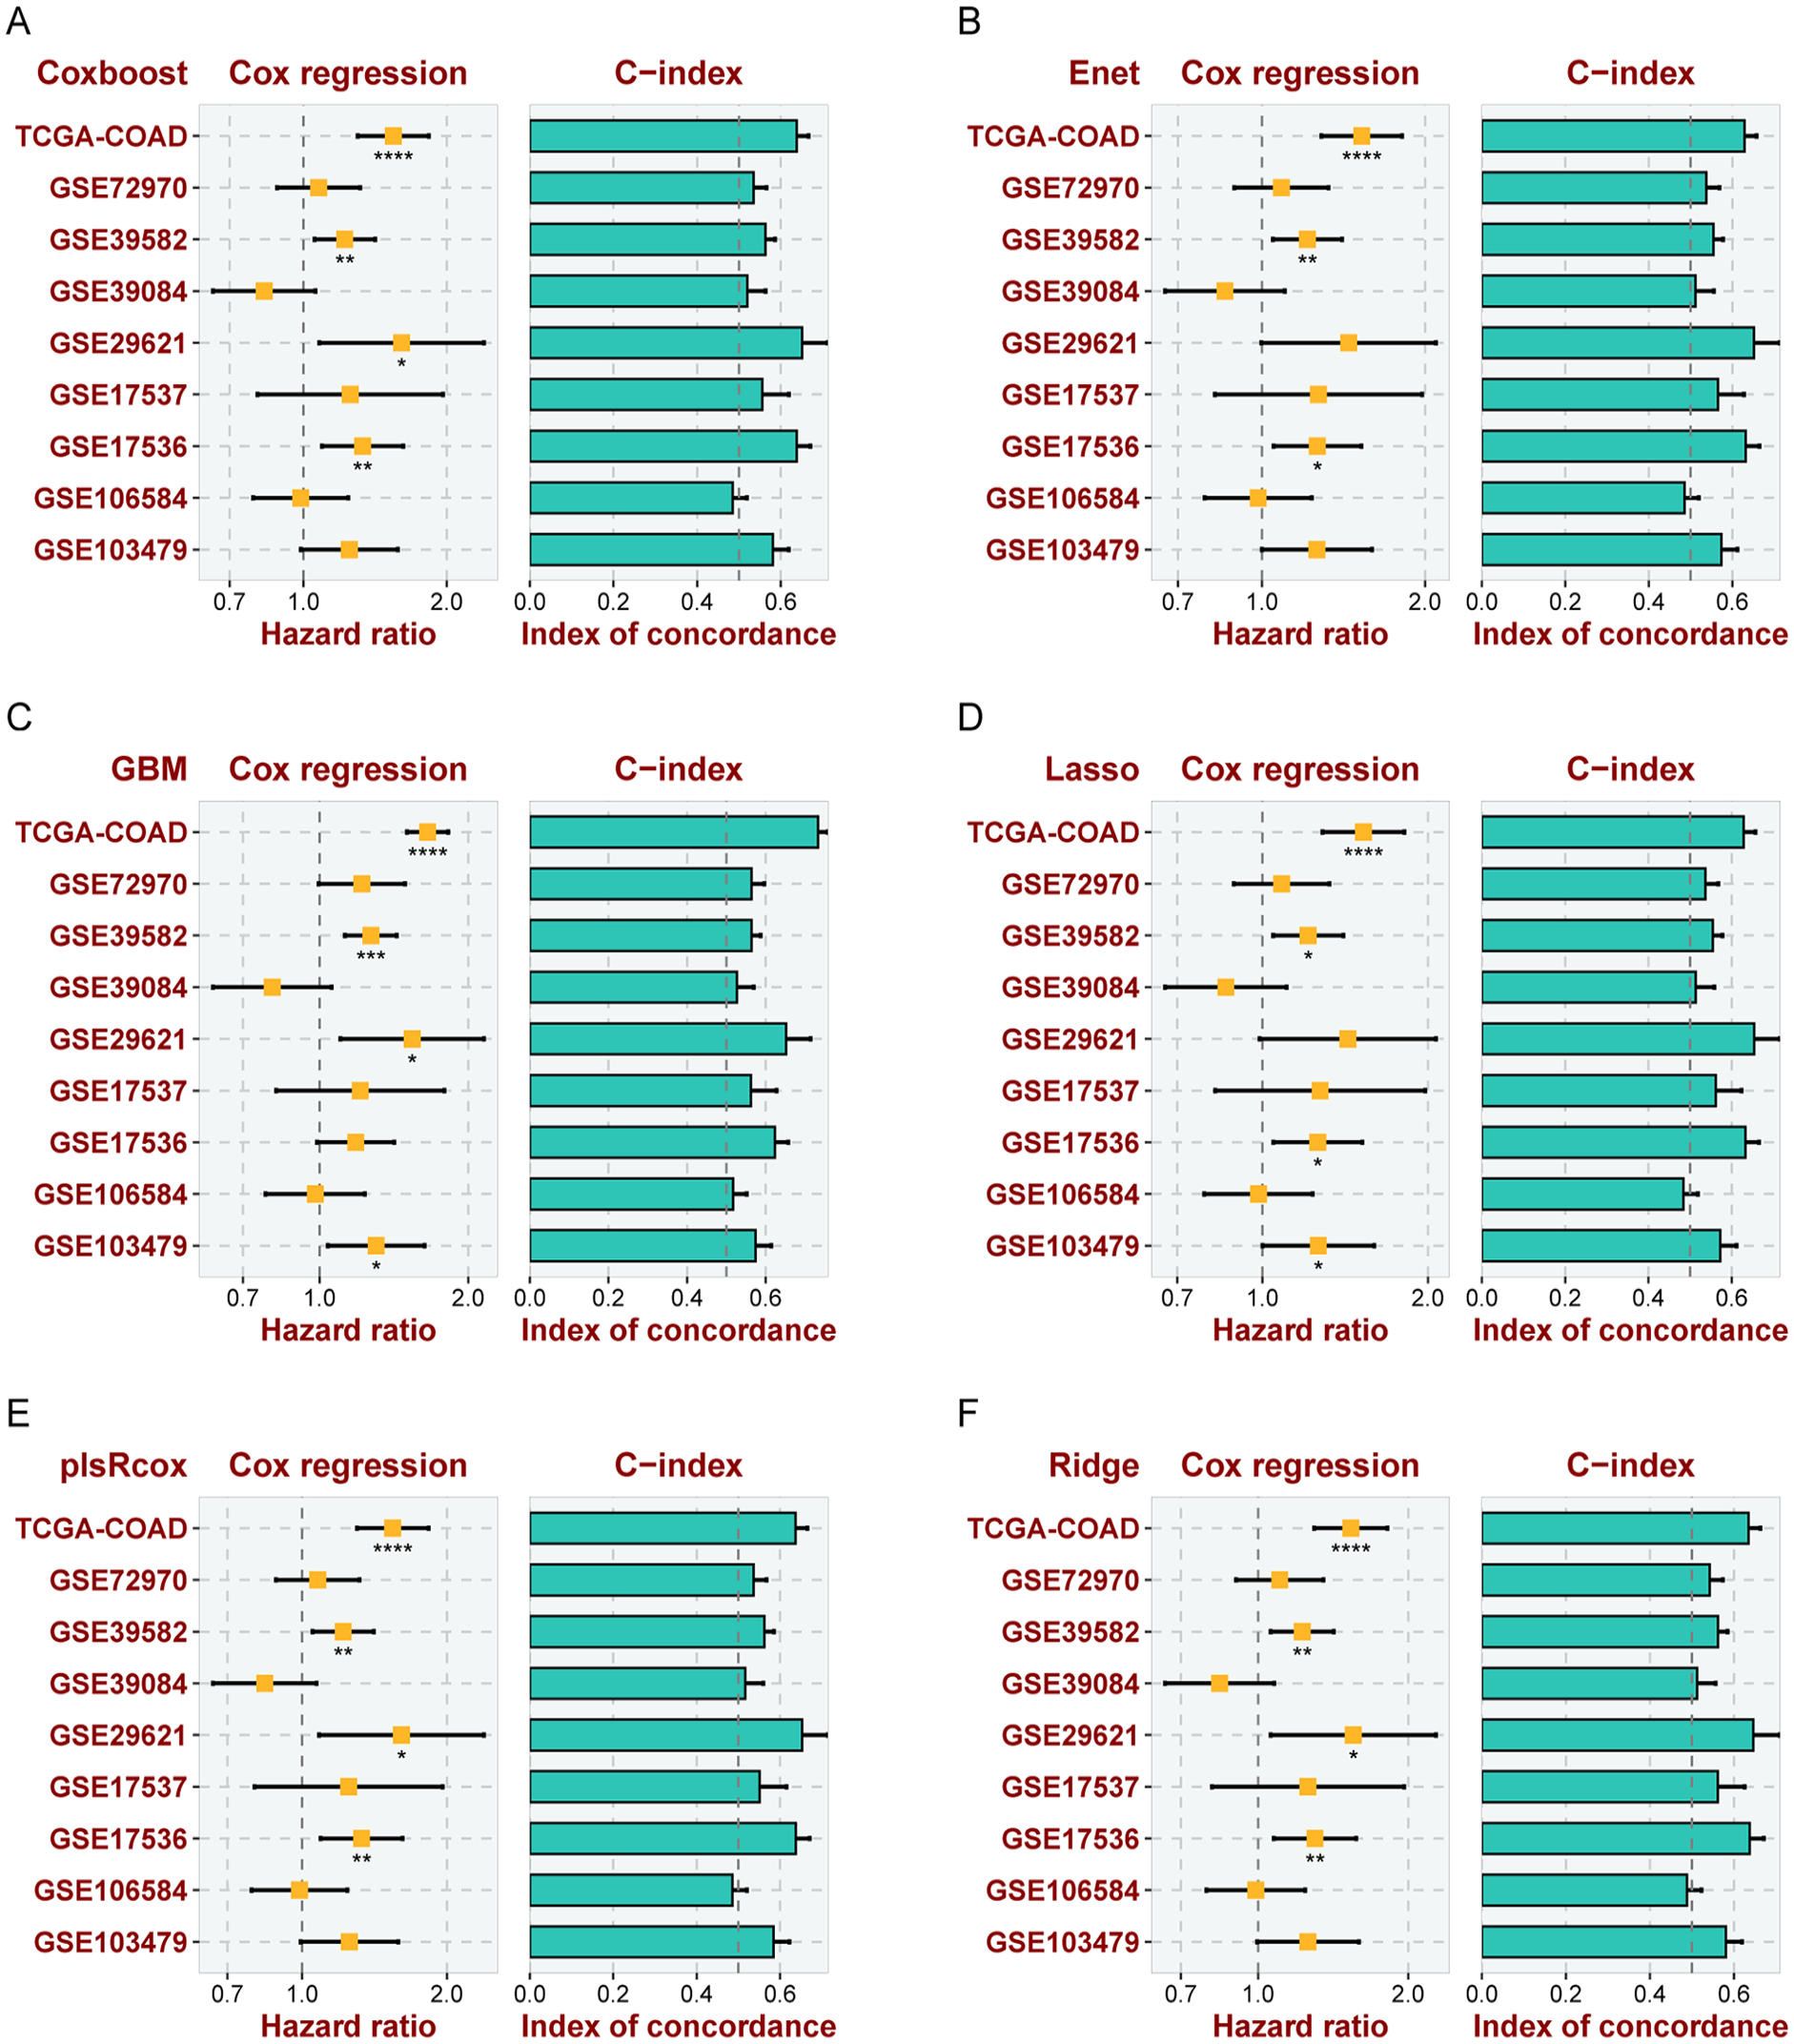
Multiple Modeling for Predicting OS Across Various Datasets. The hazard ratios and concordance indexes (C-indexes) of risk scores derived from Coxboost (A), Elastic Net (Enet) (B), Gradient Boosting Machine (GBM) (C), LASSO Regression (D), Partial Least Squares Regression for Cox Regression (plsRcox) (E), and Ridge Regression (F) across multiple datasets: TCGA-COAD, GSE103479, GSE106584, GSE17536, GSE17537, GSE29621, GSE39084, GSE39582, and GSE72970. These measures reflect the prognostic accuracy and discriminatory capabilities of these multivariable models in the context of CRC.

Various Models for Predicting OS Across Multiple Datasets. The hazard ratios and concordance indexes (C-indexes) of risk scores derived from Random Survival Forest (RSF) (A), stepwise Cox Regression (stepCox) (B), Supervised Principal Components analysis (SuperPC) (C), and Support Vector Machines (SVM) (D) across the datasets TCGA-COAD, GSE103479, GSE106584, GSE17536, GSE17537, GSE29621, GSE39084, GSE39582, and GSE72970. In TCGA-COAD dataset, the RSF model showed the highest C-index, highlighting the predictive and discriminatory strengths within the scope of CRC.
Detailed assessment of the RSF model’s predictive efficacy in diverse datasets
The RSF model’s capabilities were thoroughly examined within the TCGA-COAD dataset. Kaplan-Meier survival curves distinctly categorized patients into high-risk and low-risk groups based on the median risk score calculated by the RSF model (Figure 5A). Notably, the high-risk group exhibited a markedly reduced OS compared to their low-risk counterparts. This stark differentiation underscores the model’s proficiency in discerning between varying survival probabilities, thereby reinforcing its clinical utility in prognosis. The model’s predictive performance was quantitatively assessed using the AUC for 1-, 3-, and 5-year survival predictions (Figure 5B). Exceptionally high AUC values of 0.978, 0.985, and 0.965, respectively, indicated outstanding model accuracy over these timeframes, reflecting its robustness in short-term and long-term survival predictions. Calibration curves for 1-, 3-, and 5-year survival predictions (Figure 5C) closely aligned with the 45° reference line. This close proximity indicated an excellent agreement between the predicted survival probabilities by the RSF model and the actual observed outcomes, signifying the model’s reliability. DCA for 1-year (Figure 5D), 3-year (Figure 5E), and 5-year (Figure 5F) timeframes illustrated the clinical usefulness of the RSF model. The analysis demonstrated that using the RSF model to guide clinical decision-making results in a net benefit across these intervals, emphasizing its practical applicability in patient care strategies.

Comprehensive Assessment of a RSF Model for Predicting OS in the TCGA-COAD Dataset. (A) Kaplan-Meier curves demonstrate the OS of COAD patient cohorts, stratified by the median risk score into high-risk and low-risk groups. Notably, the high-risk group shows significantly lower OS probabilities than the low-risk group, underlining the model’s proficiency in effectively discriminating between varying risk levels. (B) The area under the time-dependent Receiver Operating Characteristic (ROC) curve (AUC) for 1-year, 3-year, and 5-year survival predictions are 0.978, 0.985, and 0.965, respectively, showcasing the model’s high accuracy in prognostic assessments over these time frames. (C) Calibration curves for 1-, 3-, and 5-year predictions are plotted against observed outcomes. The curves’ proximity to the 45° reference line across all evaluated time points signifies an excellent agreement between the model’s predicted survival probabilities and the actual observations, confirming the model’s reliable calibration. (D-F) Decision Curve Analysis (DCA) at 1-year (D), 3-year (E), and 5-year (F) intervals, aimed at quantifying the clinical benefit derived from using the RSF model in decision-making processes. The analysis provides insights into the trade-offs between the benefits of true-positive predictions and the costs of false-positive predictions, emphasizing the model’s utility in clinical settings.
The performance of the RSF model was further evaluated using the GSE29621 dataset, which encompasses a different cohort of colon cancer patients. Kaplan-Meier curves for the GSE29621 dataset (Figure 6A) similarly stratified patients into high-risk and low-risk groups. The AUC values for 1-year, 3-year, and 5-year survival predictions (Figure 6B) were 0.671, 0.589, and 0.649, respectively. These values, although lower than those observed in the TCGA-COAD dataset, still demonstrated the model’s capability to distinguish between different survival outcomes, albeit with reduced accuracy. The calibration curves for the GSE29621 dataset (Figure 6C) were assessed against observed outcomes, providing insights into the model’s performance consistency. Decision Curve Analysis for 1-year, 3-year, and 5-year intervals (Figure 6D-F) was conducted to evaluate the clinical net benefit of using the RSF model in this dataset.

Comprehensive Assessment of a RSF Model for Predicting OS in the GSE29621 Dataset. (A) Kaplan-Meier curves demonstrate the OS of colon patient cohorts, stratified by the median risk score into high-risk and low-risk groups. Notably, the high-risk group shows lower OS probabilities than the low-risk group, underlining the model’s proficiency in effectively discriminating between varying risk levels. (B) The AUC for 1-year, 3-year, and 5-year survival predictions are 0.671, 0.589, and 0.649, respectively. (C) Calibration curves for 1-, 3-, and 5-year predictions are plotted against observed outcomes. The curves’ proximity to the 45° reference line across all evaluated time points signifies an excellent agreement between the model’s predicted survival probabilities and the actual observations, confirming the model’s reliable calibration. (D-F) DCA at 1-year (D), 3-year (E), and 5-year (F) intervals, aimed at quantifying the clinical benefit derived from using the RSF model in decision-making processes.
Discussion
CRC continues to pose a significant global health challenge, necessitating a comprehensive exploration of its underlying molecular intricacies and identification of robust prognostic markers. 28 This study represents a comprehensive effort to elucidate the prognostic significance of FRGs in CRC by leveraging large-scale transcriptomic datasets. By integrating DEGs analysis with survival outcomes, our research has identified 6 key genes (ASNS, TIMP1, H19, CDKN2A, HOTAIR, and ASMTL-AS1) that are significantly upregulated in CRC tissues and correlated with poorer survival rates. The robustness of these findings is further underscored by the application of various predictive models, among which the RSF model emerged as the most accurate in forecasting OS.
The identification of these 6 intersection genes aligns with and extends the findings of previous studies. For instance, ASNS can catalyze asparagine to support cancer cell growth under conditions of stress and malnutrition, and emerging research has found that ASNS is a key rescuer of KRAS MT CRC growth when glutamine availability in the tumor microenvironment is restricted. 29 The role of H19 and HOTAIR, both of which are long non-coding RNAs, in cancer progression and metastasis has been well-documented across various cancer types, including CRC.30-33 Similarly, the involvement of TIMP1 and CDKN2A in tumor growth and cell cycle regulation, respectively, has been noted in the context of CRC.34,35 The association of these genes with ferroptosis, a form of regulated cell death pivotal in cancer biology, highlights their potential as therapeutic targets and prognostic markers in CRC.
The RSF model’s superior performance in our study is noteworthy. RSF, an ensemble method that combines multiple decision trees for survival analysis, has been recognized for its ability to handle high-dimensional data and account for complex interactions between variables. The high C-index and AUC values achieved by the RSF model in predicting 1-, 3-, and 5-year OS substantiate its efficacy in clinical prognostication. This is in line with previous research that has validated the utility of RSF in various oncological settings. 36
The comprehensive evaluation of the RSF model across the TCGA-COAD and GSE29621 datasets highlights its strengths and limitations in predicting OS in CRC. While demonstrating high accuracy and reliability in the TCGA-COAD dataset, its performance in the GSE29621 dataset indicates the need for cautious interpretation when applying the model to different patient cohorts. These findings underscore the importance of dataset-specific model calibration and validation in the predictive modeling of cancer prognosis. Moreover, while the RSF model showed exemplary performance in the TCGA-COAD dataset, the relative performance of different models varied across other datasets, suggesting that no single model uniformly outperforms others in every context. This variability emphasizes the necessity for tailored model selection in prognostic studies, taking into account the unique features and challenges presented by each dataset. Additionally, the study acknowledges several limitations, including limited generalizability due to variability in patient demographics, tumor heterogeneity, and sequencing technologies, as well as the need for external validation in larger, more diverse cohorts to enhance the robustness and applicability of the findings. Moreover, the inherent constraints of retrospective analyses highlight the need for prospective studies to validate these results. While the research offers valuable insights into the prognostic landscape of CRC, the biological mechanisms linking the identified FRGs to CRC progression require further investigation. Although FRGs were the focus, the broader ferroptosis pathways were not extensively explored. A deeper understanding of how these genes interact within these pathways could provide further clarity on their roles in CRC progression and identify potential therapeutic targets.
Conclusion
In conclusion, our study elucidates the prognostic relevance of FRGs in CRC, with the RSF model showcasing remarkable predictive accuracy. The 6 intersection genes identified offer promising avenues for future research and potential therapeutic interventions. As the field of cancer genomics evolves, studies like ours pave the way for more nuanced and personalized approaches to cancer prognostication and treatment.
Footnotes
Funding:
The author(s) disclosed receipt of the following financial support for the research, authorship, and/or publication of this article: This work was supported by Guangxi Zhuang Autonomous Region Clinical Key Specialty Program and Key Research and Development Projects of Guangxi Science and Technology Plan (NO.AB23026016).
Declaration Of Conflicting Interests:
The author(s) declared no potential conflicts of interest with respect to the research, authorship, and/or publication of this article.
Author Contributions
(I) Conception and design: Z Hu and T Gan; (II) Administrative support: None; (III) Provision of study materials or patients: Z Hu and X Wei; (IV) Collection and assembly of data: T Gan and X Wei; (V) Data analysis and interpretation: Z Hu and Y Xing; (VI) Manuscript writing: All authors (VII) Final approval of manuscript: All authors.
Data Availability
Ethical Statement
The authors are accountable for all aspects of the work in ensuring that questions related to the accuracy or integrity of any part of the work are appropriately investigated and resolved. The study was conducted in accordance with the Declaration of Helsinki (as revised in 2013).