
Abstract
Cancer-associated fibroblasts (CAFs) play critical roles in the metastasis and therapeutic response of high-grade serous ovarian cancer (HGSC). Our study intended to select HGSC patients with unfavorable prognoses and therapeutic responses based on CAF-enriched prognostic genes. The bulk RNA and single-cell RNA sequencing (scRNA-seq) data of tumor tissues were collected from the TCGA and GEO databases. The infiltrated levels of immune and stromal cells were estimated by multiple immune deconvolution algorithms and verified through immunohistochemical analysis. The univariate Cox regression analyses were used to identify prognostic genes. Gene Set Enrichment Analysis (GSEA) was conducted to annotate enriched gene sets. The Genomics of Drug Sensitivity in Cancer (GDSC) database was used to explore potential alternative drugs. We found the infiltered levels of CAFs were remarkedly elevated in advanced and metastatic HGSC tissues and identified hundreds of genes specifically enriched in CAFs. Then we selected 6 CAF-enriched prognostic genes based on which HGSC patients were reclassified into 2 subclusters with discrepancy prognoses. Further analysis revealed that the HGSC patients in cluster-2 tended to undergo poor responses to traditional chemotherapy and immunotherapy. Subsequently, we selected 24 novel potential therapeutic drugs for cluster-2 HGSC patients. Moreover, we discovered a positive correlation of infiltrated levels between CAFs and monocytes/macrophages in HGSC tissues. Collectively, our study successfully reclassified HGSC patients into 2 different subgroups that have discrepancy prognoses and responses to current therapeutic methods.
Introduction
High-grade serous ovarian carcinoma (HGSC) accounts for approximately 70% of ovarian cancer (OC) which ranks the highest mortality rate among gynecological malignancies.1,2 Deep in the pelvic cavity, ovarian lesions are often without specific clinical symptoms in the early stage. Whereas when symptoms appear, 70% of tumors are already in the late stage with peritoneal metastasis.3,4 Although the therapeutic methods develop, the overall survival of metastatic HGSC patients remains poor due to the acquired drug resistance and release. 5 Therefore, it is necessary to search for novel therapeutic strategies for HGSC patients.
Cancer cells live in a complex tumor microenvironment (TME) containing stromal cells, immune cells, and extracellular matrix (ECM). 6 Cancer-associated fibroblasts (CAFs), a critical component of TME, are significantly associated with the malignancy progression of OC. 7 For example, CAFs release SLPI (Secretory Leukocyte Peptidase Inhibitor) protein to promote OC metastasis via activating the PI3K/AKT signaling pathway. 8 Emerging evidence has proved that CAFs can shape an immunosuppressive TME by increasing the proportions of immunosuppressive cells and restricting the recruitment of immune effector cells that enable cancer cells to evade immune surveillance. 9 For example, CAFs promote M2 polarization of macrophages to enhance pancreatic tumor progression. 10 CAFs are also associated with the therapeutic response of OC, such as resistance to platinum and anti-angiogenic drugs.11-13 Recently, emerging studies have deciphered the implications of CAFs on clinical outcome prediction of OC patients. 14 However, it remained unclear whether CAF-enriched genes can be directly implemented to select OC patients who may undergo unfavorable prognoses and be resistant to current therapeutic methods.
In this study, we successfully reclassified HGSC patients into different subgroups with distinct prognoses and discrepancy responses to traditional chemotherapy and immunotherapy based on CAF-enriched genes. Besides, we successfully selected twenty-four drug compounds as the potential alternative to traditional treatment of HGSC patients and verified the cooperative relationship between CAFs and macrophages in HGSC progression.
Materials and Methods
Bulk RNA-seq data analysis
The RNA sequencing data of HGSC tissues were obtained from the TCGA OC cohort (https://portal.gdc.cancer.gov) and Three GEO datasets (GSE133296, GSE26193, and GSE30161).15-17 The expression values of each gene were normalized. The R “limma” package was used to identify differentially expressed genes (DEGs) based on a criterion of |log2FC| ⩾ 1 and P < .05. The GSE133296 dataset consisted of 10 primary HGSC tissues and 20 metastatic HGSC tissues (omental and intraperitoneal metastasis). The GSE30161 dataset included 23 chemotherapy-resistant serous OC tissues and 33 chemotherapy-sensitive serous OC tissues, and the GSE26193 dataset included 107 HGSC patients with follow-up times. Lastly, the TCGA HGSC cohort included 303 patients with exact overall survival times regardless of the TP53 mutation status. The information on the demographics of patients in the datasets was listed in Table 1.
The information on the demographics of patients in the datasets.

ScRNA-seq data analysis
The scRNA-sequencing data of metastatic HGSC tissues deposited in the GSE151214 dataset 18 were analyzed by the Tumor Immune Single-cell Hub (TISCH) database (http://tisch.comp-genomics.org/home/). 19 The GSE151214 dataset contains 59 446 cells from 8 HGSC tissues and was sequenced using the 10×Genomics platform. The single-cell level expression matrix values were normalized via the “Seurat” package to scale the raw counts in each cell to 10 000. Quality control, cell clustering, and type annotation were performed using the MAESTRO algorithm.
Functional enrichment analysis
The biological process (BP), molecular function (MF), and cellular component (CC) categories of Gene Ontology (GO) analysis were conducted in the DAVID database (https://david.ncifcrf.gov). The results were visualized using OmicShare (http://www.omicshare.com/tools). In addition, GSEA analysis was performed based on the MSigDB database (http://www.gsea-msigdb.org/gsea/msigdb/index.jsp). The significantly enriched gene sets were selected with criteria of |NES| > 1, NOM P-value < .05, and FDR value < 0.25. Enrichment analysis was conducted using GSEA 4.3.0 software.
Evaluating the infiltrated levels of CAFs and immune cells
We used the TIMER2 website (http://timer.cistrome.org) to estimate the infiltrated levels of stromal and immune cells in ovarian carcinoma tissues using multiple immune deconvolution methods, including the MCPCOUNTER, EPIC, and XCELL algorithms.
Immunohistochemistry (IHC)
Xylene and alcohol were first used to deparaffinize HGSC tissue sections (2 µm thick). Then antigen retrieval was completed by using sodium citrate buffer (pH 6.0). Next, tissue sections were incubated with mouse monoclonal antibody to a-SMA (1:200, ab7817, Abcam, USA) and rabbit monoclonal antibody to CD68 (1:100, ab283654, Abcam, USA) overnight at 4°C. Subsequently, sections were washed with PBS thrice and further incubated with corresponding biotin-labeled secondary antibodies for 40 minutes at room temperature. Finally, diaminobenzidine tetrahydrochloride was implemented to detect signals. According to the intensity of cell staining, negative staining is 0 point, light yellow staining is 1 point, brown-yellow staining is 2 points, and brown staining is 3 points; According to the percentage of positive cells, 1 point is calculated for ⩽25%, 2 points are calculated for 26% to 50%, 3 points are calculated for 51% to 75%, and 4 points are calculated for >75%. The final IHC score is obtained by multiplying the two scores. A total of 21 HGSC patients were enrolled in this study after the informed consent was signed. This study was approved by the ethics committee of Nanjing Women and Children’s Healthcare Hospital (No. NFKSL-105).
Selecting potential therapeutic drugs
To identify potential therapeutic drugs for HGSC patients, the “oncoPredict” R package was used to calculate the correlations between gene expression and the IC50 values of 199 small molecules deposited in the Genomics of Drug Sensitivity in Cancer (GDSC) database (www.cancerRxgene.org).
Statistical analysis
Statistical analyses were carried out by using GraphPad Prism 8.0 (GraphPad, United States) and R 4.3.0 software. The Wilcoxon test was used to analyze the statistical difference between the 2 groups. The Kaplan-Meier curves with log-rank tests were used to compare the overall survivals of patients between 2 subgroups. The Pearson correlation analysis was applied to calculate the correlations of genes or cell infiltration levels. A P-value < .05 was considered statistically significant.
Results
Identify CAF-enriched genes based on scRNA-seq data
We first evaluated the infiltration levels of CAFs in HGSC tissues. The TCGA OC cohort showed that the infiltration levels of CAF were significantly higher in advanced HGSC tumors compared to early ones (Figure 1A). GSE133296 dataset analysis showed that the infiltration levels of CAF were significantly higher in metastatic HGSC compared to primary HGSC (Figure 1B). Consistently, IHC analysis proved that compared to that of HGSC tissues without distant metastasis, the infiltration levels of CAF were significantly elevated in HGSC tissues with distant metastasis (Figure 1C). Subsequently, based on the GSE151214 scRNA-seq dataset, we identified 9 cell types in HGSC tissues, including CAFs (Figure 1D). The presentative markers of each cell type were listed (Figure 1E). Interestingly, the biological process analysis showed that these CAF-enriched genes were significantly associated with cell adhesion, extracellular matrix organization, and positive regulation of cell migration (Figure 1F). The molecular function analysis showed that these genes primarily regulated extracellular matrix structural constituents, fibronectin binding, collagen binding, and integrin binding (Figure 1F). Moreover, the cellular component analysis revealed that the proteins encoded by CAF-enriched genes mainly distributed in the extracellular matrix, extracellular space, and extracellular region (Figure 1F).

Identify CAF-enriched genes based on scRNA-seq analysis: (A) the infiltrated levels of CAFs in advanced and early ovarian carcinoma tissues based on TCGA HGSC cohort, (B) the infiltrated levels of CAFs in primary and metastatic ovarian cancer tissues based on the GSE133296 dataset, (C) IHC analysis of CAFs’ infiltrating levels in HGSC tissues with and without distant metastasis, (D) the cell types identified by scRNA-seq based on the GSE151214 dataset, (E) the represented marker genes of each cell type, and (F) GO analysis of genes that were specifically upregulated in CAFs.
Select CAF-enriched prognostic genes
Subsequently, we selected 42 and 46 CAF-enriched genes that were significantly associated with the patient’s prognosis based on the GSE26193 dataset and TCGA HGSC cohort, respectively (Figure 2A and B). Then we overlapped these CAF-enriched prognostic genes and screened 7 common ones, including TIMP3, AXL, MFAP4, DPT, JUN, SFRP2, and ASPN (Figure 2C). The distribution of these 7 genes in each cell type was shown in Figure 2D. In addition to JUN which was widely expressed in various cell types, the other 6 genes were specifically enriched in CAFs of HGSC tissues. Moreover, CCLE dataset analysis verified that the expression levels of TIMP3, AXL, MFAP4, DPT, JUN, SFRP2, and ASPN were significantly upregulated in fibroblasts compared to OC cells (Figure 2E). To further validate the specific distribution of TIMP3, AXL, MFAP4, DPT, JUN, SFRP2, and ASPN in CAFs of HGSC tissues, we tested the correlations between their expression levels and CAF infiltrating levels. Based on MCPCOUNTER and EPIC algorithms, analyses of the TCGA HGSC cohort and GSE26193 dataset demonstrated that the infiltration levels of CAF were positively correlated with the expression levels of TIMP3, AXL, MFAP4, DPT, JUN, SFRP2, and ASPN (Figure 2F and G). Meanwhile, except for JUN, the expression levels of TIMP3, AXL, MFAP4, DPT, SFRP2, and ASPN were negatively correlated with tumor purity (Figure 2H).
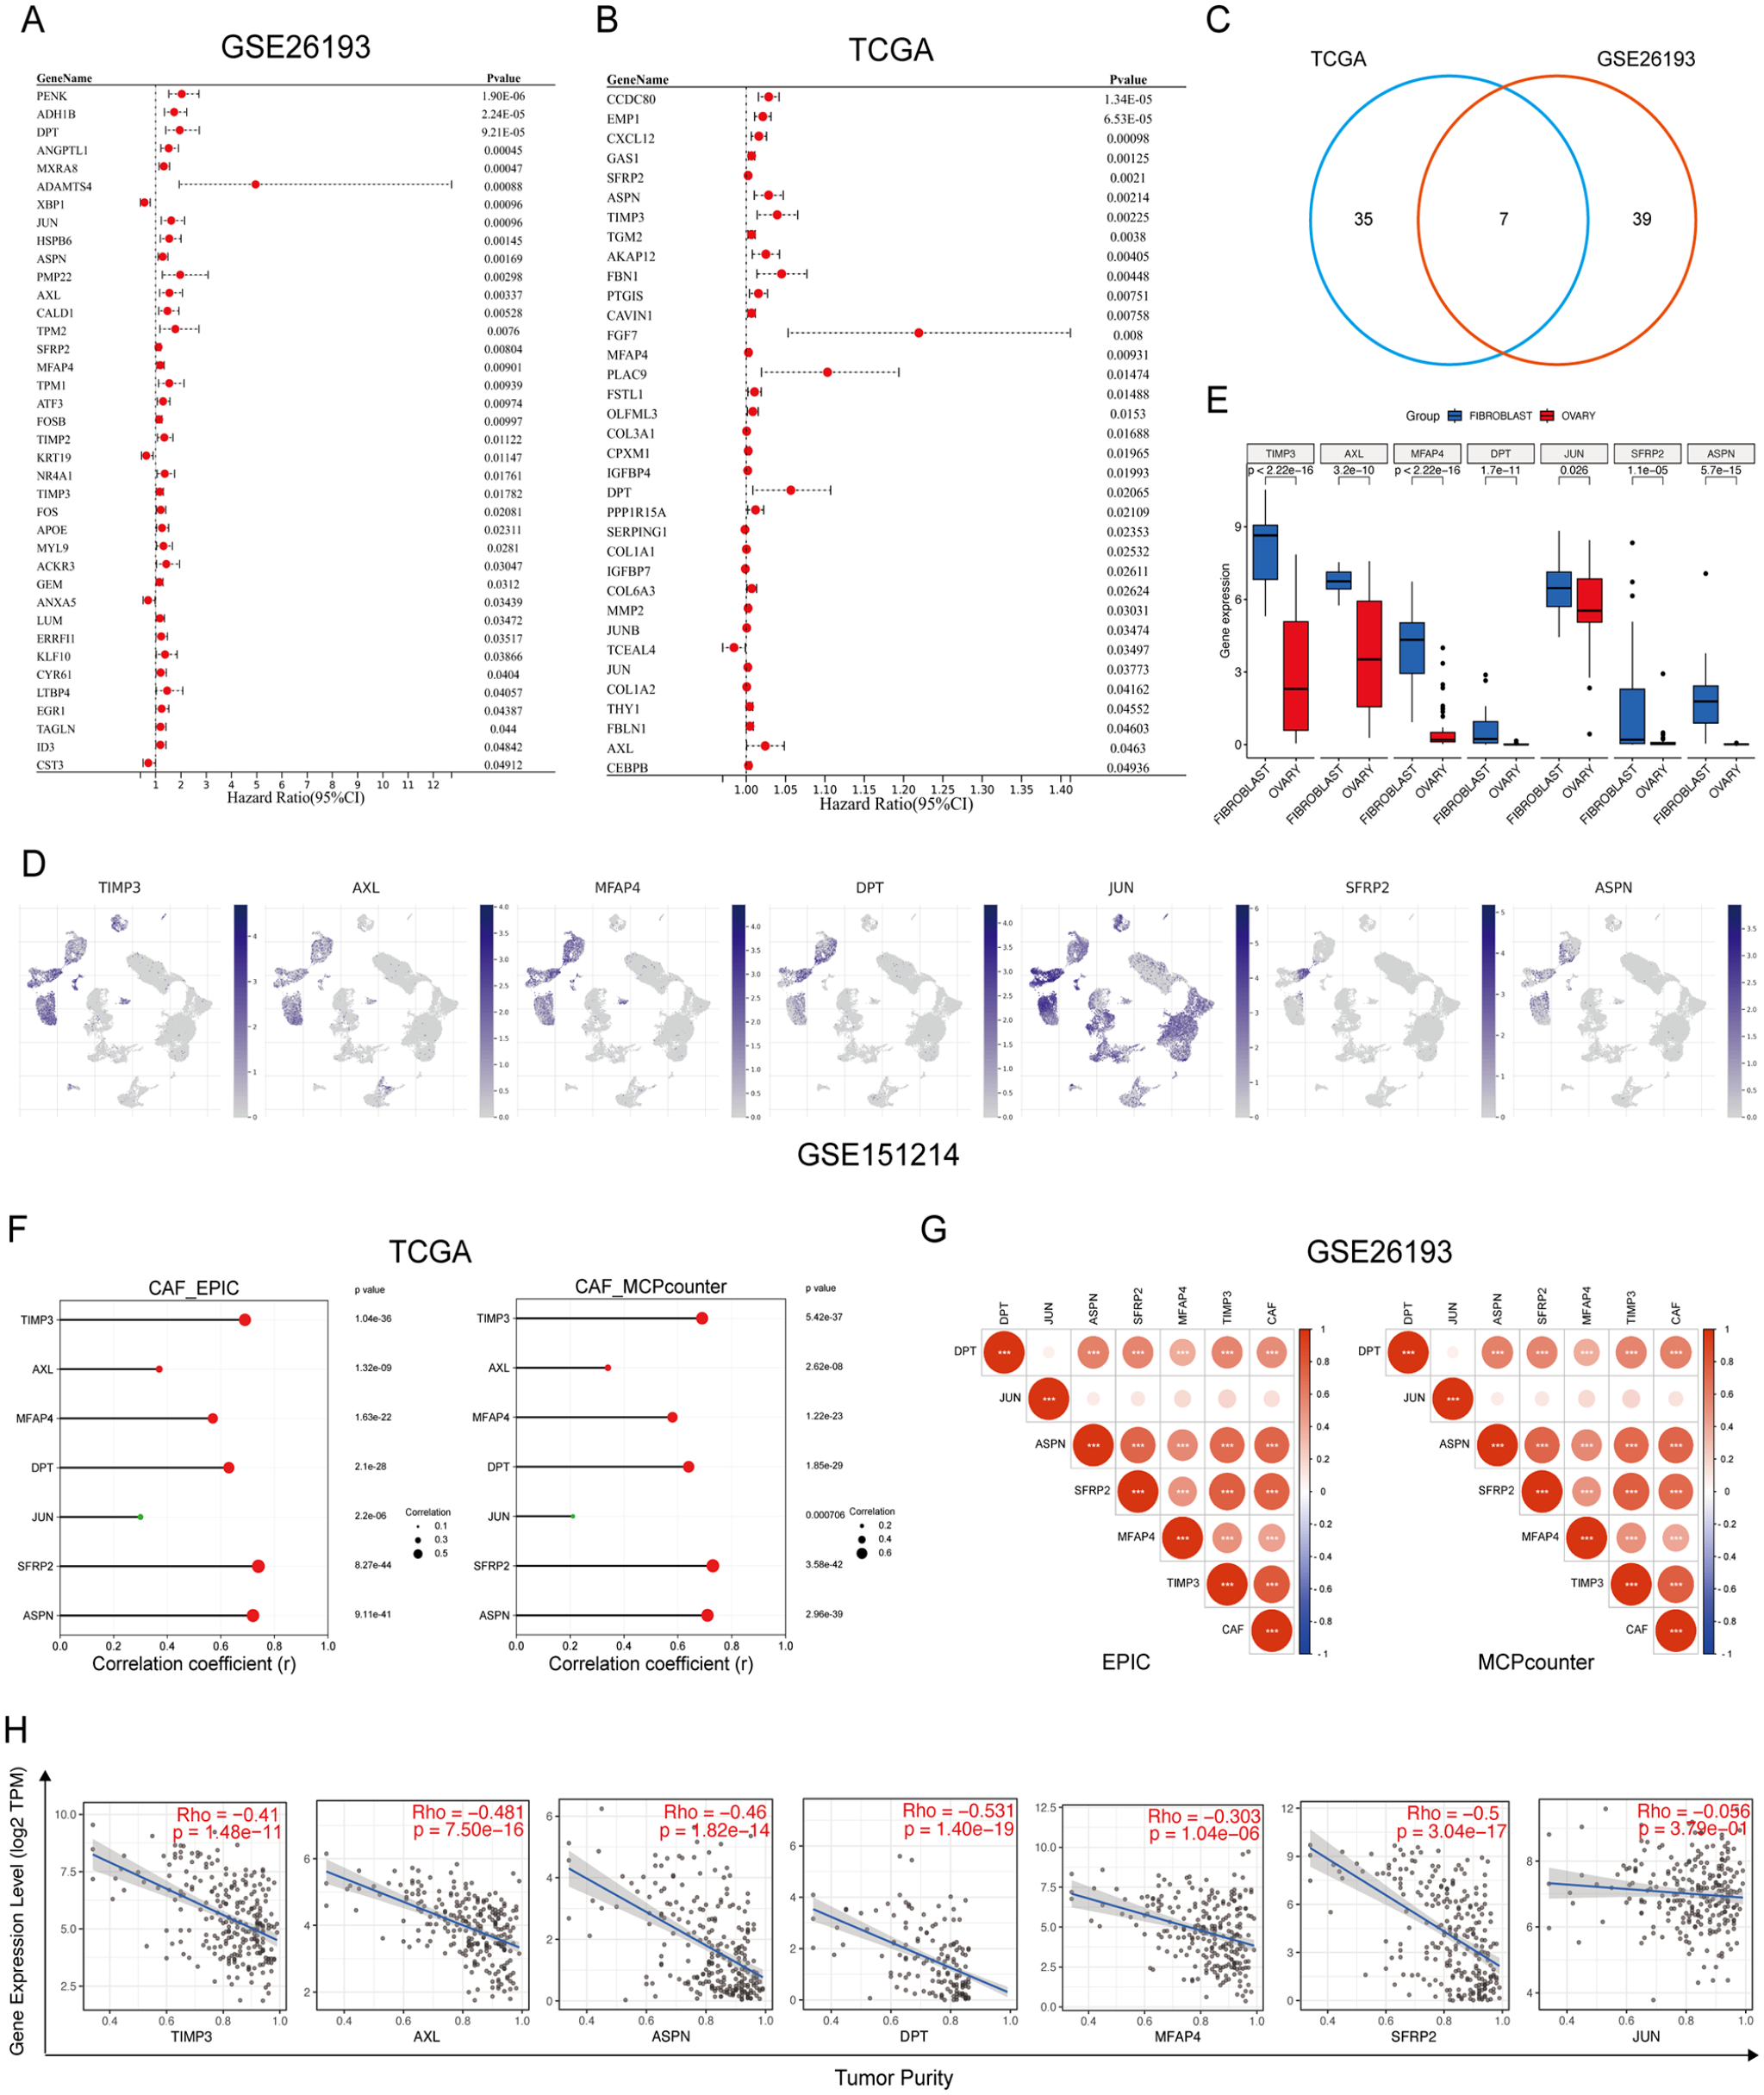
Select CAF-enriched prognostic genes: (A) the frost plot of CAF-enriched prognostic genes identified by univariate Cox analysis based on the GSE26193 dataset, (B) the frost plot of CAF-enriched prognostic genes identified by univariate Cox analysis based on the TCGA HGSC cohort, (C) the common CAF-enriched prognostic genes between the GSE26193 dataset and the TCGA HGSC cohort, (D) the distribution of common prognostic CAF-enriched genes in each cell type of HGSC tissues based on the GSE151214 dataset, (E) the expression levels of common prognostic CAF-enriched genes in fibroblasts and ovarian cancer cells based on the CCLE database, (F) the correlations between CAF infiltrating levels and expression levels of TIMP3, AXL, MFAP4, DPT, JUN, SFRP2, and ASPN based on the TCGA HGSC cohort, (G) the correlations between CAF infiltrating levels and expression levels of TIMP3, AXL, MFAP4, DPT, JUN, SFRP2, and ASPN based on the GSE26193 dataset, and (H) the correlations between tumor purity and expression levels of TIMP3, AXL, MFAP4, DPT, JUN, SFRP2, and ASPN based on the TCGA HGSC cohort.
Reclassify HGSC patients into distinct subclusters based on CAF-enriched prognostic genes
Subsequently, we reclassified HGSC patients in the GSE26193 dataset into two distinct subclusters based on these CAF-enriched prognostic genes (TIMP3, AXL, MFAP4, DPT, SFRP2, and ASPN) by using the Consensus ClusterPlus algorithm (Figure 3A and B). As expected, the stromal scores and CAF infiltrating levels significantly increased in cluster-2 tumor tissues (Figure 3C and D). Besides, the Kaplan-Meier curve analysis showed that HGSC patients in cluster-2 suffered from worse overall survival compared to those in cluster-1 (HR = 2.14, 95% CI: 1.17-3.90, P = .0016) (Figure 3E). Moreover, unsupervised clustering analysis of the TCGA HGSC cohort also suggested that HGSC patients were well divided into 2 subclusters (Figure 3F and G). Consistently, the stromal scores and CAF infiltrating levels significantly increased in cluster-2 tumor tissues Figure 3H and I) and HGSC patients in cluster-2 undergo worse clinical outcomes when compared to cluster-1 HGSC patients (HR = 1.76, 95% CI: 1.14-2.74, P < .001) (Figure 3J). Moreover, the Chi-square test and Fisher exact test determined that there is no difference in clinicopathological characteristics between cluster-1 patients and cluster-2 patients (Table 2).
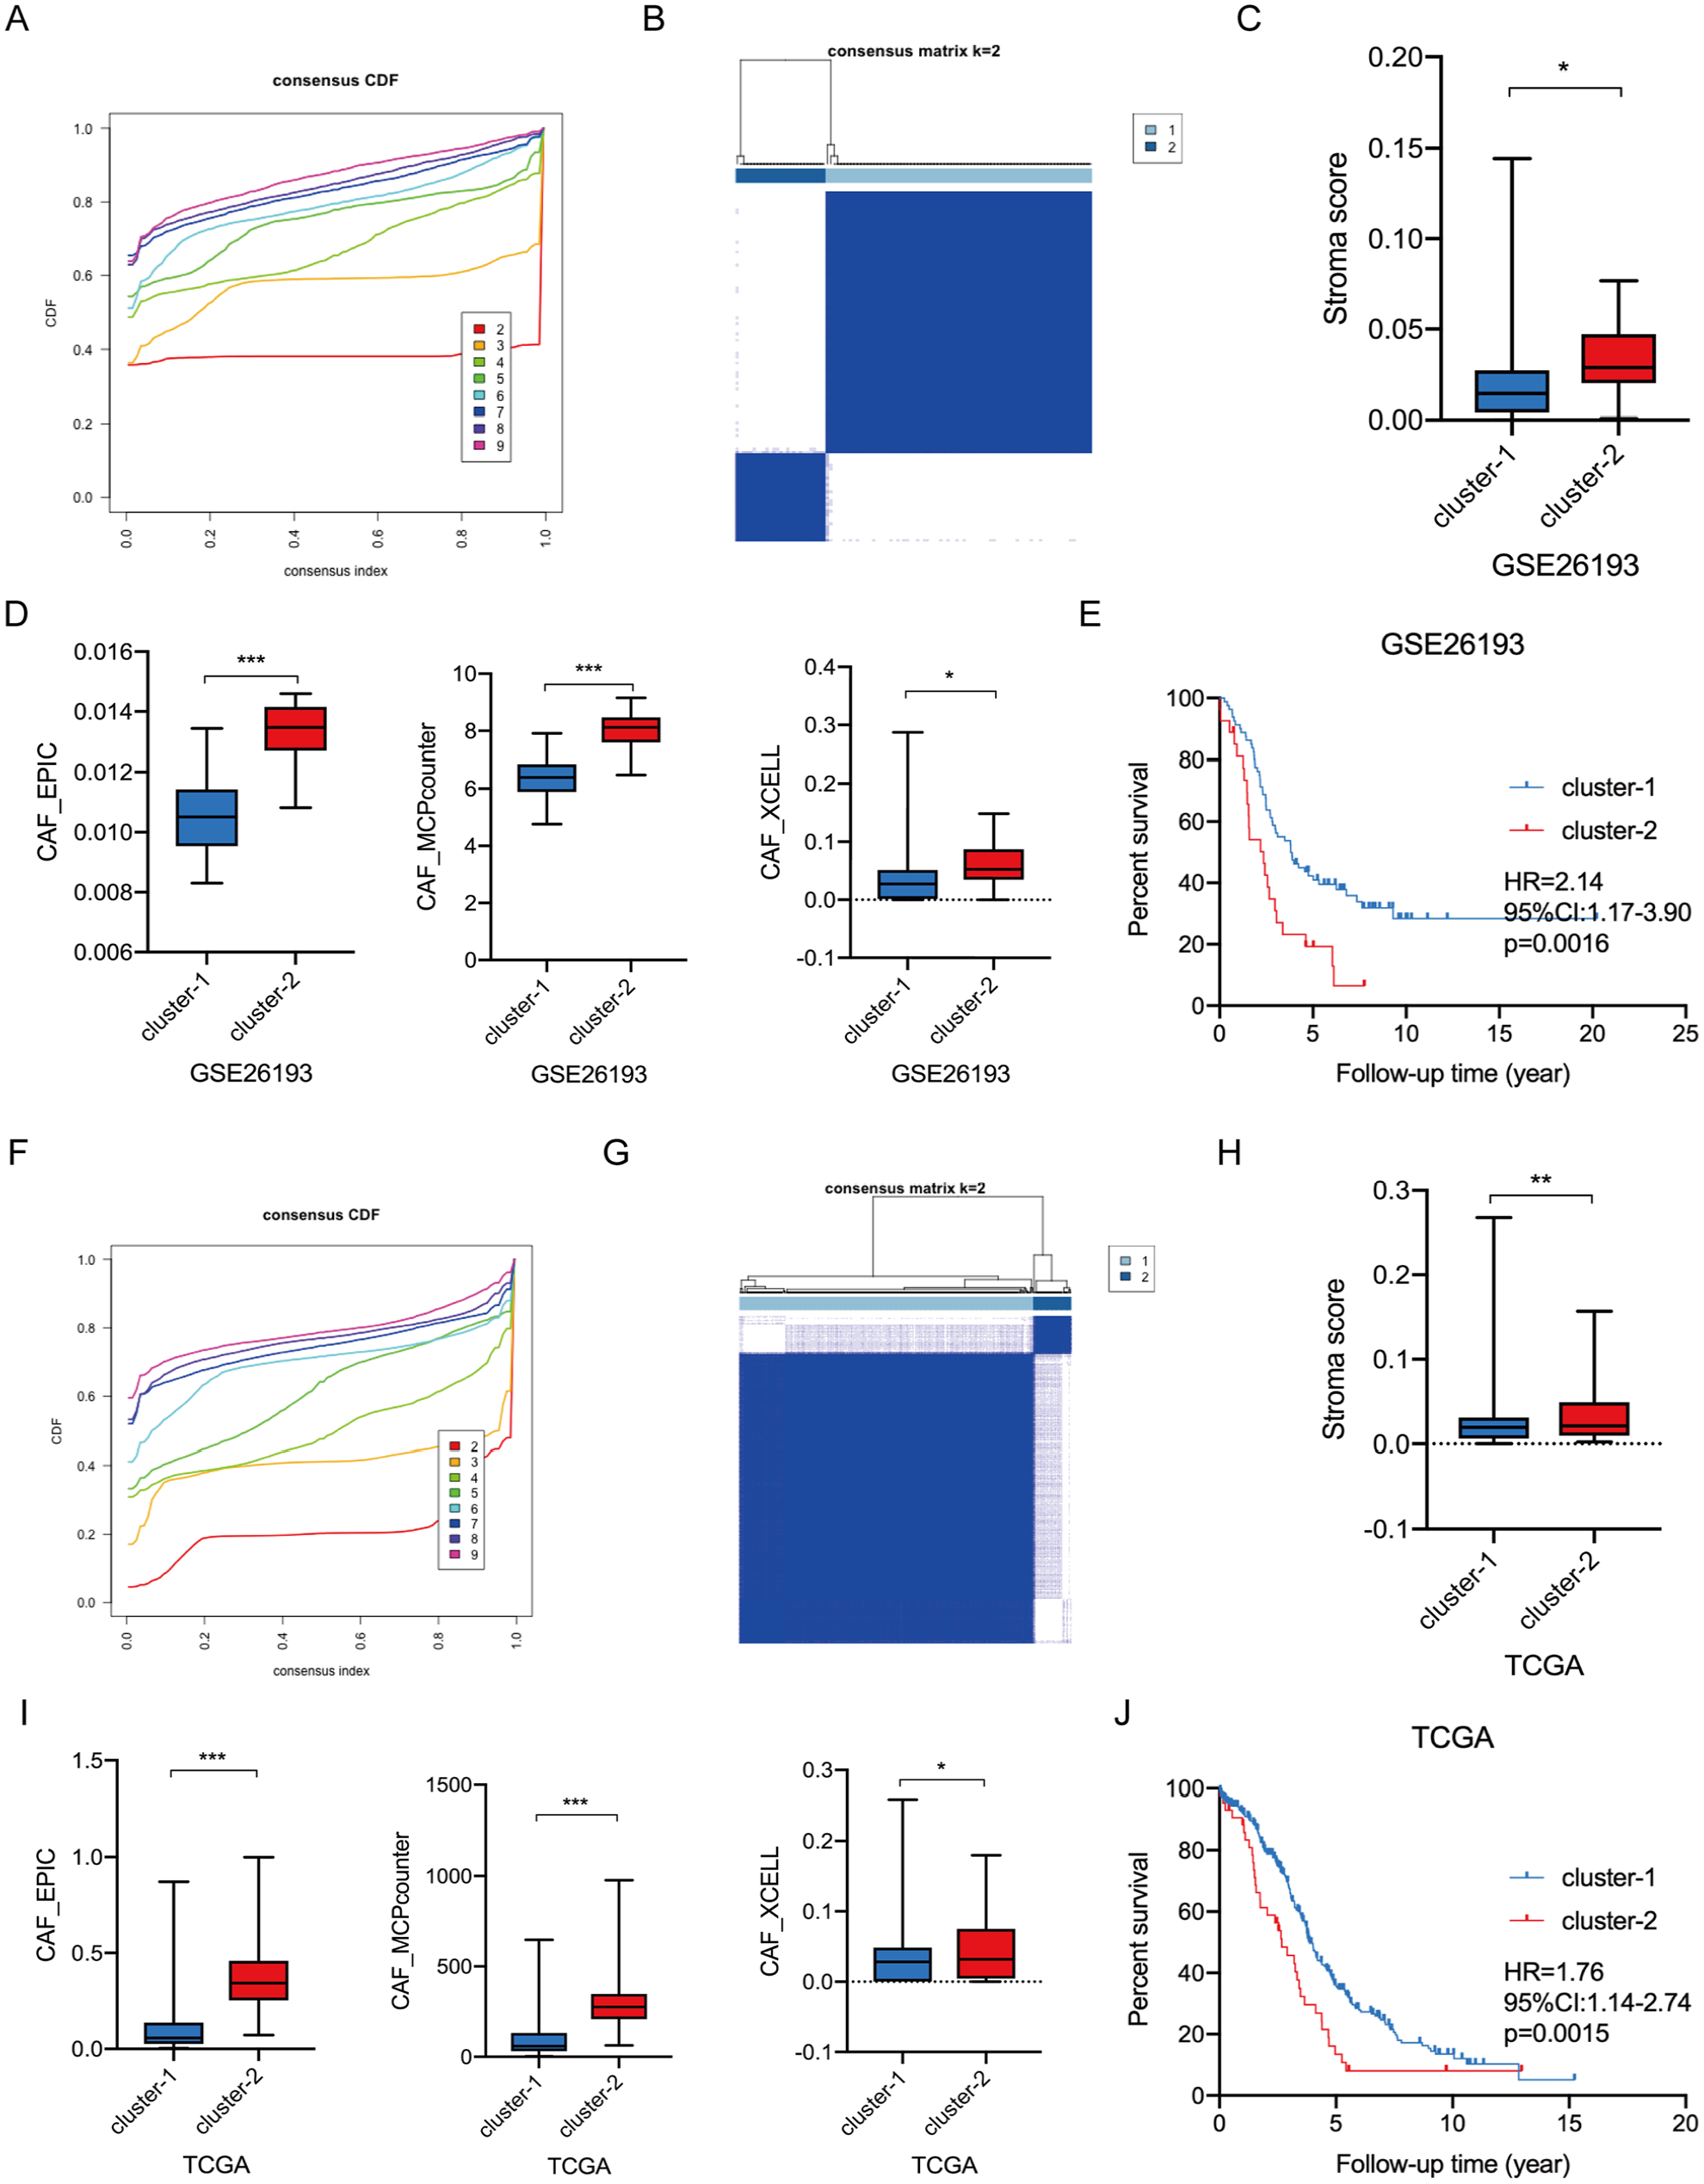
Reclassifying HGSC patients into different molecular subtypes based on CAF-enriched prognostic genes: (A) the optimal number of clusters according to the consensus index based on the GSE26193 dataset, (B) consensus clustering analysis of patients according to the consensus index based on the GSE26193 dataset, (C) the stromal scores of cluster-1 and cluster-2 HGSC tissues, (D) the infiltration levels of CAFs between cluster-1 and cluster-2 HGSC tissues, (E) the Kaplan-Meier plot curves of OC patients in cluster-1 and cluster-2 based on the GSE26193 dataset, (F) the optimal number of clusters according to the consensus index based on the GSE26193 dataset, (G) consensus clustering analysis of patients according to the consensus index based on the GSE26193 dataset, (H) the stromal scores of cluster-1 and cluster-2 HGSC tissues, (I) the infiltration levels of CAFs between cluster-1 and cluster-2 HGSC tissues, and (J) the Kaplan-Meier plot curves of OC patients in cluster-1 and cluster-2 based on the GSE26193 dataset.
The clinicopathological characteristics of HGSC patients between cluster-1 and cluster-2.

The discrepant immunotherapeutic responses of HGSC patients between cluster-1 and cluster-2
CAFs closely interact with immune cells in the TME. 9 We then investigated the differences in tumor immune microenvironments between cluster-1 and cluster-2 HGSC tissues. Analyses of the TCGA HGSC cohort and GSE26193 dataset demonstrated that the TME and immune scores of cluster-2 tumor tissues were significantly upregulated when compared to those of cluster-1 tumor tissues (Figure 4A and B). In detail, XCELL algorithm analysis revealed that the infiltrated levels of various immune cells, such as macrophage, myeloid dendritic cell activated, monocyte, and CD8+ T cell, significantly increased in cluster-2 HGSC tissues (Figure 4C and D). However, the Tumor Immune Dysfunction and Exclusion (TIDE) scores of cluster-2 tumor tissues were markedly elevated compared to cluster-1 tumor tissues (Figure 4E), indicating that patients in cluster-2 may have difficulty benefiting from immunotherapy. Consistently, the immunophenoscore (IPS) scores further proved that these HGSC patients in cluster-2 were less sensitive to CTLA4 and PD-1 blocker treatment (Figure 4F). Mounting evidence has proved that tumors with higher microsatellite instability (MSI) are more suitable for immunotherapy. 20 Analyses of the TCGA HGSC cohort and GSE26193 dataset both showed that the MSI expression signatures were significantly downregulated in cluster-2 HGSC tissues compared to cluster-1 HGSC tissues (Figure 4G). Moreover, cluster-2 tumor tissues expressed higher immune checkpoint genes (Figure 4H and I). Overall, these data suggested that although cluster-2 HGSC tissues are “hot” tumors, they are unsuitable for immunotherapy, such as ICI treatment.

The discrepant immunotherapeutic responses of HGSC patients between cluster-1 and cluster-2: (A) the TME scores and immune scores between cluster-1 and cluster-2 based on the TCGA HGSC cohort, (B) the TME scores and immune scores between cluster-1 and cluster-2 based on the GSE26193 dataset, (C) the differentially infiltrated immune cells between cluster-1 and cluster-2 based on the TCGA HGSC cohort, (D) the differentially infiltrated immune cells between cluster-1 and cluster-2 based on the GSE26193 dataset, (E) the TIDE scores between cluster-1 and cluster-2 based on the TCGA HGSC cohort and GSE26193 dataset, (F) the IPS between cluster-1 and cluster-2 based on the TCGA HGSC cohort, (G) the MSI expression signature between cluster-1 and cluster-2 based on the TCGA HGSC cohort and GSE26193 dataset, (H) the differentially expressed immune checkpoint genes between cluster-1 and cluster-2 based on the TCGA HGSC cohort, and (I) the differentially expressed immune checkpoint genes between cluster-1 and cluster-2 based on the GSE26193 dataset.
The distinct chemotherapeutic responses of HGSC patients between cluster-1 and cluster-2
At the clinic, platinum and paclitaxel were the typical first-line chemotherapy agents for HGSC patients. To investigate any differences in chemotherapy response between cluster-1 and cluster-2 HGSC, the GSE30161 dataset was analyzed. Based on identified CAF-enriched prognostic genes (TIMP3, AXL, MFAP4, DPT, SFRP2, and ASPN), ovarian adenocarcinomas in this dataset were divided into two subclusters using unsupervised clustering analysis (Figure 5A and B). The MCPCOUNTER and EPIC algorithms, as opposed to the XCELL algorithm, showed that the infiltration levels of CAFs were significantly higher in cluster-2 tumor tissues compared to cluster-1 tumor tissues (Figure 5C). Besides, the Chi-square test indicated that cluster-1 tumor tissues were more likely to be sensitive to adjuvant chemotherapy (Figure 5D). Subsequently, we analyzed 199 compounds to explore potential alternative drugs for cluster-2 tumors based on the GDSC database. Both the TCGA HGSC cohort and GSE26193 dataset results revealed that cluster-2 tumor tissues were more responsive to 24 drug compounds, such as Entospletinib, Cediranib, and Staurosporine (Figure 5E and F).

Searching for alternative drugs for cluster-2 HGSC patients: (A) the optimal number of clusters according to the consensus index based on the GSE30161 dataset, (B) consensus clustering analysis of patients according to the consensus index based on the GSE30161 dataset, (C) the infiltrated levels of CAFs between cluster-1 and cluster-2, (D) the different response to adjuvant chemotherapy between cluster-1 and cluster-2 revealed by Chi-square test, (E) the alternative drugs for cluster-2 patients based on the TCGA HGSC cohort, and (F) the alternative drugs for cluster-2 HGSC patients based on the GSE26193 dataset.
The specifically enriched gene sets in cluster-2 HGSC tissues
To explore the molecular difference between cluster-1 and cluster-2 tumor tissues, we conducted a GSEA analysis. GSEA analysis of the TCGA HGSC cohort revealed that the gene sets of EPITHELIAL_MESENCHYMAL_TRANSITION, ANGIOGENESIS, COAGULATION, INFLAMMATORY_RESPONSE, TGF_BETA_SIGNALING, IL2_STAT5_SIGNALING, TNFA_SIGNALING_VIA_NFKB, COMPLEMENT, HYPOXIA, and APOPTOSIS were significantly enriched in cluster-2 tumor tissues (Figure 6A). The same trend was observed in the GSE26193 dataset (Figure 6B). To further identify gene sets that were specifically enriched in CAFs, we conducted a single-cell GSEA analysis based on the GSE151214 scRNA-seq dataset. We found that two gene sets (EPITHELIAL_MESENCHYMAL_TRANSITION and TGF_BETA_SIGNALING) were specifically enriched in CAFs (Figure 6C). However, the gene sets of TNFA_SIGNALING_VIA_NFKB, INFLAMMATORY_RESPONSE, COMPLEMENT, APOPTOSIS, and ANGIOGENESIS were significantly enriched in monocytes/macrophages (Mono/Macro) (Figure 6C). The above results suggested a positive correlation between CAF and Mono/Macro infiltrating levels in HGSC tissues.

The specifically enriched gene sets in cluster-2 tumor tissues: (A) the enriched gene sets of cluster-2 based on the TCGA HGSC cohort, (B) the enriched gene sets of cluster-2 based on the GSE26193 dataset, (C) the specific enriched gene sets in each cell type of HGSC tissues revealed by single-cell GSEA analysis of the GSE151214 dataset, (D) the correlations between CAF markers and Mono/Macro markers based on the TCGA HGSC cohort, (E) the correlations between CAF markers and Mono/Macro markers based on the GSE26193 dataset, and (F) the correlations between CAF infiltrating levels and Mono/Macro infiltrating levels based on IHC analysis of HGSC tissues.
To validate our hypothesis, we analyzed the correlations between CAF markers (ACTA2, FAP, COL1A1, and FN1) and Mono/Macro markers (CD68, CD163, CD80, and MRC1).21,22 The results showed that the expression levels of CAF markers were positively correlated with that of Mono/Macro markers in HGSC tissues (Figure 6D and E). Moreover, IHC analysis directly revealed a positive correlation between CAF and Mono/Macro infiltration levels in HGSC tissues (Figure 6F).
Discussion
The cancer-related mortality is mainly attributed to metastasis in ovarian carcinoma. 3 It has been proved that CAFs can promote tumor metastasis by secreting cytokines, chemokines, extracellular vesicles, metabolites, and remodeling ECM. 23 For example, CAFs inhibit the function of immune cells such as T cells and NK cells by secreting programed cell death 1 (PD-1), programed cell death 2 (PD-2), and prostaglandin E2 (PGE2) to facilitate the migration of cancer cells. 24 Consistently, our analysis results revealed that CAFs were significantly elevated in metastatic ovarian carcinoma tissues and were mainly responsible for the reconstruction of surrounding ECM.
The association between patients’ prognosis and CAFs infiltration has been widely reported. 25 For instance, CAFs are independent prognostic factors for the survival of non-small cell lung cancer patients. 26 Currently, CAF-associated genes have been applied to predict the prognosis of OC patients.27,28 Instead, we directly selected HGSC patients with distinct prognoses based on CAF-enriched prognostic genes that were identified by scRNA-seq analysis. We found that TIMP3, AXL, MFAP4, DPT, SFRP2, and ASPN were specifically expressed in CAFs of metastatic HGSC tissues and were significantly associated with the overall survival of patients. TIMP3 is a prognostic oncogene in OC whose function has been revealed in various cancers.29,30 Bi et al 31 reported that the MSI1-TIMP3-MMP9 cascade accelerates breast carcinoma metastasis by regulating extracellular matrix degradation. AXL is an essential therapeutic target for metastatic OC. 32 Mullen et al 33 reported that inhibiting AXL enhances the sensitivity of ovarian carcinoma to chemotherapy and PARP inhibition treatment. MFAP4 affects elastic fiber homeostasis, integrin signaling, and cancer progression. 34 High MFAP4 expression could predict platinum-based chemoresistance in serous OC patients. 35 DPT was reported to play an anti-proliferative role in breast cancer. 36 However, its role in ovarian cancer has not been investigated. Our results revealed that DPT was specifically enriched in CAFs and inversely correlated with the prognosis of HGSC patients. Therefore, we hypothesized that DPT + CAFs may promote HGSC malignancy progression. SFRP2 is an upstream antagonist of canonical Wnt/β-catenin signaling and promotes the epithelial-mesenchymal transition of OC cells. 37 Our data identified that ASPN was specifically distributed in CAFs of HGSC tissues. Consistently, an ASPNhigh CAF population that is located at the distal invading front was identified in gastric carcinoma. 38 JUN is a transcription factor that recognizes and binds to the AP-1 consensus motif. 39 The oncogenic role of JUN has been validated in OC. 40 However, our scRNA-seq analysis results showed that all types of cells express JUN in HGSC tissues, which indicated that JUN is essential for cell survival. We had to admit that this is an in silico study and the expression and function of these genes ought to be experimentally validated in subsequent studies.
Accumulating investigations found that tumor-associated macrophages are the most prominent immune cells in the vicinity of CAF-populated areas, indicating a tight interaction between these 2 cell types. 41 In the present study, we discovered that the infiltrated levels of CAFs are positively correlated with that of monocytes/macrophages in ovarian cancer tissues. Many studies have proved that CAFs enhance the recruitment and M2-type differentiation of macrophages (pro-tumorigenic subsets) to impair responses from effector T cells and induce immune suppression microenvironment. 42 In the present study, we uncovered that HGSC tissues in cluster-2 with higher infiltrated CAFs owned more infiltrated immune cells, but responded worse to immunotherapy, such as CTLA4 blocker and PD-1 blocker. TGF-β1 + CAFs were reported to determine the efficacy of immunotherapy 43 and targeting CAF differentiation could overcome immunotherapy resistance. 44 Consistently, our GSEA analysis results demonstrated that the gene set of TGF-β signaling was significantly enriched in CAFs whose infiltration levels were markedly upregulated in cluster-2 HGSC tissues. In addition, our study discovered that these HGSC patients in cluster-2 were also more likely to be resistant to traditional chemotherapy. Deying et al 11 reported that CAF-derived HGF promotes ovarian carcinoma cell proliferation and drug resistance via the c-Met/PI3K/AKT and GRP78 signal. What is noteworthiness is that, with the development of scRNA-seq technology, CAFs were found to consist of various subtypes. Therefore, targeting CAF subtypes responsible for specific tumor phenotypes is a promising therapeutic strategy for OC patients. Furthermore, we selected 24 drug compounds, such as Entospletinib and Cediranib, as the potential alternative to traditional treatment of ovarian carcinoma patients. Currently, the combination of Entospletinib and traditional chemotherapy has been investigated in chronic and acute lymphocytic leukemia.45,46 Cediranib has been widely used in OC as monotherapy and in combination with chemotherapy, PARP inhibitors, and immunotherapy. 47 For example, compared with chemotherapy, a combination of olaparib/cediranib improves the progression-free survival of OC patients with a germline BRCA mutation and results in reduced patient-reported outcomes. 48 TP53, BRCA1, and BECN1 are 3 tumor suppressor genes that are frequently deleted, silenced, or mutated in OC and are significantly associated with drug-resistance. 49 Therefore, the combination of TP53, BRCA1, and BECN1 status and CAFs-enriched genes may improve the predictive ability of therapeutic response.
In conclusion, our study reclassified HGSC patients into 2 molecular subtypes with distinct prognoses and discrepant responses to chemotherapy and immunotherapy based on CAF-enriched prognostic genes. In addition, we further verified the close cross-talk between CAFs and macrophages in TME.
Footnotes
Author Contributions
All authors contributed to the study’s conception and design. Material preparation, data collection, and analysis were performed by Xiangxiang Liu, Guoqiang Ping, and Dongze Ji. The first draft of the manuscript was written by Zhifa Wen and Yajun Chen commented on previous versions of the manuscript. All authors read and approved the final manuscript.
Data Availability Statement
The datasets generated during and/or analyzed during the current study are available from the corresponding author upon reasonable request.
Declaration Of Conflicting Interests:
The author(s) declared no potential conflicts of interest with respect to the research, authorship, and/or publication of this article.
Funding:
The author(s) received no financial support for the research, authorship, and/or publication of this article.
Ethics Approval
This study was performed in line with the principles of the World Medical Association Declaration of Helsinki. Approval was granted by the Ethics Committee of Women’s Hospital of Nanjing Medical University (No. NFKSL-105).