
Abstract
Improving the quality of care for hip arthroplasty (replacement) patients requires the systematic evaluation of clinical performance of implants and the identification of “outlier” devices that have an especially high risk of reoperation (“revision”). Postmarket surveillance of arthroplasty implants, which rests on the analysis of large patient registries, has been effective in identifying outlier implants such as the ASR metal-on-metal hip resurfacing device that was recalled. Although identifying an implant as an outlier implies a causal relationship between the implant and revision risk, traditional signal detection methods use classical biostatistical methods. The field of probabilistic graphical modeling of causal relationships has developed tools for rigorous analysis of causal relationships in observational data. The purpose of this study was to evaluate one causal discovery algorithm (PC) to determine its suitability for hip arthroplasty implant signal detection. Simulated data were generated using distributions of patient and implant characteristics, and causal discovery was performed using the TETRAD software package. Two sizes of registries were simulated: (1) a statewide registry in Michigan and (2) a nationwide registry in the United Kingdom. The results showed that the algorithm performed better for the simulation of a large national registry. The conclusion is that the causal discovery algorithm used in this study may be a useful tool for implant signal detection for large arthroplasty registries; regional registries may only be able to only detect implants that perform especially poorly.
Introduction
Arthroplasty (joint replacement) is a very common and effective treatment for end-stage osteoarthritis of the hip. There were more than 370 000 primary total hip arthroplasty procedures performed during 2015 in the United States, and the number is projected to increase to more than 510 000 annually by 2020. 1 Unfortunately, there is wide variation in the risk of reoperation to replace prosthetic components (“revision”) across implants: for uncemented implant designs the risk of revision at 10 years postoperatively ranges from 2.6% to 66.5%. 2 Because industry-sponsored studies are known to have bias,3,4 regional and national patient registries are the best source of revision risk data. These registries are used to conduct postmarketing surveillance of implants. 5 For example, the ASR metal-on-metal hip implant was withdrawn from the market after it was shown to have an increased risk of revision by national arthroplasty registries.6,7
Arthroplasty registries seek to properly identify poorly performing implants (“signal detection”) using classical biostatistical techniques. 5 Registry analyses of implant revision risk typically use revision as an end point and time to first revision (TTR) as the measure and then Kaplan-Meier estimates are computed. 6 To account for confounding that could occur by patient-level variables, Cox proportional hazards modeling is employed, including sex, age, and body mass index (BMI).
However, arthroplasty registries consist of observational data, and it is well known that analyses of observational data using classical statistical methods can produce misleading results. 7 This is a central problem because postmarketing surveillance implicitly seeks to identify a causal relationship between the choice of implant and revision risk. Although novel statistical methods8–10 and multiregistry data sharing models 11 have recently been developed for orthopedic implant device postmarket surveillance, they do not address the causal inference problem that arises from the existence of confounding variables.
Statistical techniques for using directed acyclic graphs (DAGs) to model causal relationships have been developed in fields ranging from epidemiology12–14 to artificial intelligence. 15 One thread of DAG modeling of causality has been casual discovery, which consists of algorithms to construct DAGs from empirical data that indicate causal relationships. 16 The TETRAD software package has been developed at Carnegie Mellon University for casual discovery17,18 and it is freely available in open source format.
The purpose of this project was to test the ability of a causal discovery tool to properly identify causal relationships in arthroplasty registry data. The approach was to generate simulated data sets having known domain knowledge-based causal structure and apply the TETRAD software package to them. Two registry sizes were simulated to evaluate the effectiveness of TETRAD in national and regional registry settings.
Methods
To evaluate the performance of TETRAD, simulated data sets with a known causal structure were first generated. Each simulation consists of a number of cases, which represent a single patient along with its randomly generated sex, implant type, and TTR.
The PC causal discovery algorithm of Spirtes et al 16 was used to construct DAGs, which are graphs indicating causal structure, from the simulated data. Each node is a variable, and for each pair of nodes (A, B) there are 5 options for connection: (1) no edge indicating that there is no direct causal relationship, (2) a directed edge from A to B indicating that A directly causes B, (3) a directed edge from B to A indicating that B directly causes A, (4) an undirected edge indicating that there is a causal relationship between A and B but the direction cannot be determined from the data available, and (5) there may be a latent variable—or variables—confounding the relationship between A and B. Note that if there is a directed path from A to B, then A can be an indirect cause of B. Figure 1 illustrates the PC algorithm (a causal discovery algorithm named after its authors, Peter and Clark 16 ) on a 4-node hypothetical DAG. Conceptually, the PC algorithm evaluates patterns in the data to determine whether they are consistent with hypothetical DAGs representing possible causal structures.

Example of causal discovery algorithm PC using 4 variables, x1, x3, x3, and x4, assuming that x1 and x2 are independent, x1 and x4 are conditionally independent given x3, x2, and x4 are conditionally independent given x3, x1 is a cause of x3, x2 is a cause of x3, and x3 is a cause of x4. This is illustrated as a DAG in (A). The algorithm has 3 steps. Step 1 consists of constructing a fully connected undirected graph (B). Step 2 consists of removing all edges where the data do not support a direct cause between 2 nodes. The edge between x1 and x2 is removed because they are independent. The edge between x1 and x4 is removed because x1 and x4 are conditionally independent given x3. This means that if x3 is fixed, any change in x1 does not cause a change in x4. Similarly, the edge between x2 and x4 is removed, resulting in the DAG shown in (C). Step 3 determines the direction of the edges remaining at the end of step 2. Directed edges from x1 to x3 and from x2 to x3 are determined because x3 must be a collider node due to x1 and x2 being independent (the “collider test” for edge direction), resulting in (D). The “from collider test” is used to determine that the edge from x3 to x4 is directed from x3 to x4 (E). Observe that the PC algorithm reconstructed (E) from the statistical independence assumptions implied by the DAG in (A). DAG indicates directed acyclic graph.
The causal structure used for the simulations (Figure 2) contained 3 variables: implant, sex, and TTR. The model represents the clinical situation where there is one implant of interest being analyzed (compared with cases performed with all implants other than the one of interest), and that implant affects TTR. In these simulations, the causal model also includes sex, which affects the selection of implant and TTR. This model was chosen as a simple example of a possible causal relationship between implant and TTR with a measured confounding variable (sex) that is a direct causal factor for both implant and TTR.
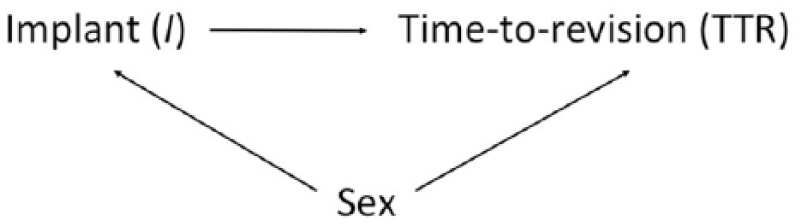
Causal diagram for simulated data. The simulation included 3 variables: (1) implant, (2) sex, and (3) time to first revision (TTR). Causal relationships are indicated by directed edges between nodes.
Simulated data sets were constructed using distributions from the Apache Commons Mathematics Library version 3.6.1,
19
using the included Mersenne Twister algorithm
20
seeded with the system time as a source of pseudo-randomness. The variables were generated in sequence according to the topologic ordering of the DAG that represents the relationship between the variables. In this situation, the order was sex, implant type, and then TTR. The sex variable was a Boolean variable where 0 represented female and 1 represented male. Sex was generated from a simple Bernoulli distribution with parameter,
The simulations were run on a machine with a 3.3-GHz AMD Ryzen 5 1400 Quad-Core Processor at a rate of approximately 10.6 simulations per second. We verified that the numerical simulations converge over multiple runs. The generated simulations were analyzed using the open source TETRAD (version 6.4.0) software package implemented in Java. We used the PC algorithm and the χ2 independence test with a significance level of .05 to reconstruct the causal graphs from the simulation data. For each set of simulations, we calculated the proportion of graphs that contained each edge. We also calculated the proportion of those edges that were undirected, directed correctly, and directed incorrectly.
Data from the Michigan Arthroplasty Registry Collaborative Quality Initiative (MARCQI) were used to estimate baseline model parameters. The MARCQI is a consortium of 61 hospitals working to improve the quality of care for hip and knee arthroplasty patients in Michigan. 21 It collects data on devices implanted in patients as well as the dates of primary and revision cases. Therefore, TTR data were available. A total of 47 664 total hip arthroplasty cases were used to estimate parameters using SAS version 9.4 (SAS Institute, Cary, NC, USA).
The choice of parameters used in the simulation was based on data from MARCQI. The proportion of males
The simulations were run with the number of cases
TETRAD and traditional Cox proportional hazards modeling were applied to real patient-level data from MARCQI. An implant was selected for analysis that appeared—based on inspection of the raw Kaplan-Meier curve—to have an increased risk of revision at 3 years following surgery. 23 There were 1452 primary cases out of 47 599 using this implant combination in the MARCQI database. Cox modeling was performed using TTR as an outcome, and implant (of interest or not of interest), sex, age, and BMI were included as predictors.
Results
With a data set size representative of smaller regional registries such as MARCQI (~800 revised cases), TETRAD was only able to consistently identify an edge between implant and TTR (TTR) when the effect size was large, and even with a large effect size of 4.0 and a
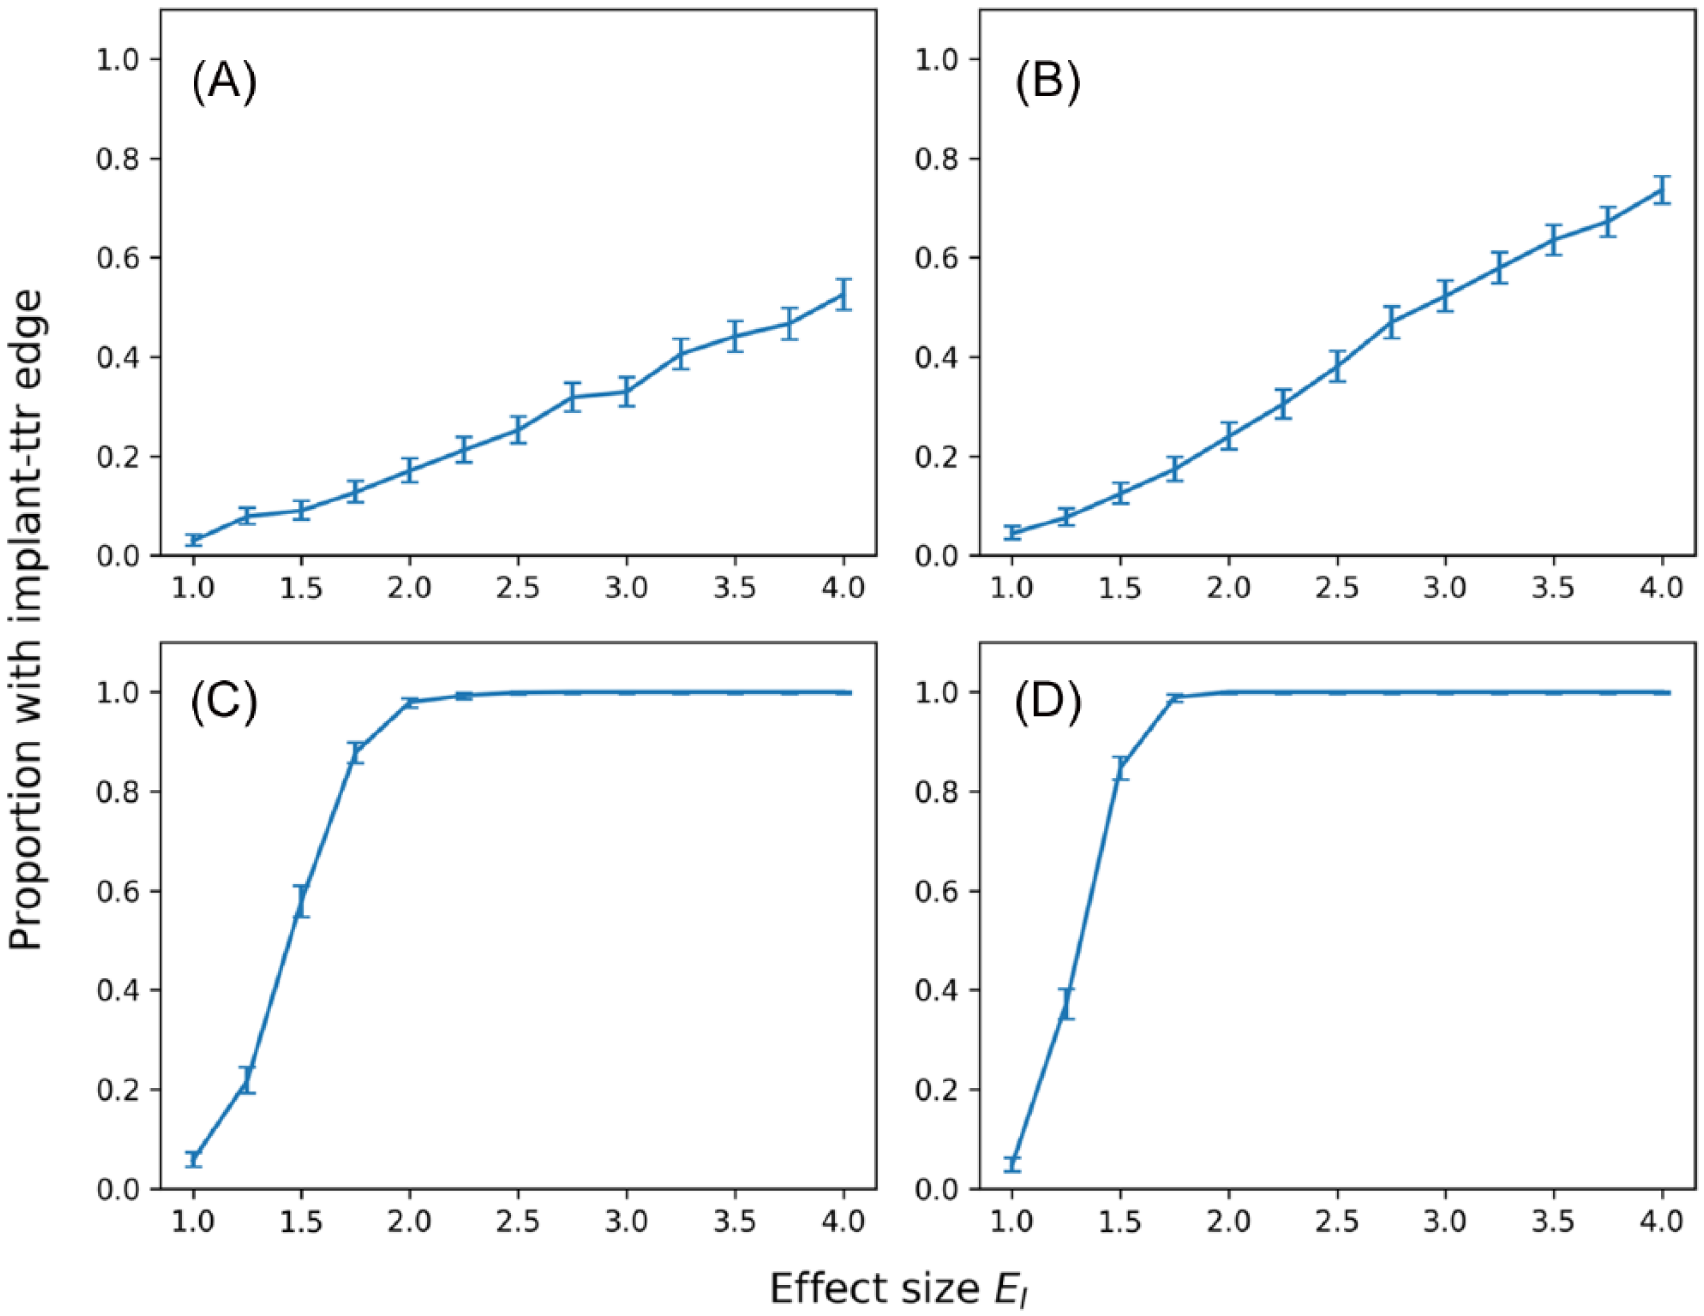
Proportion of reconstructed graphs with an edge between implant and TTR for a given effect size. Figure panels 3A and B use a registry size of 799 revised cases, and figure panels 3C and D use a registry size of 20 800 revised cases. Figure panels 3A and 3C use a
Rates of detection of the arc between implant and time to first revision for a range of both effect size and proportion of cases that use the implant of interest.

Abbreviation: NA, not applicable.
FPR is only applicable when the effect size is 1.
TPR is only applicable when the effect size is greater than 1.
To detect a causal relationship in 95% of the reconstructed graphs, 19 500 revised cases were needed for an effect size of 2.0 with

Proportion of reconstructed graphs with an edge between implant and TTR for a given number of revised cases. Both panels use an effect size
The algorithm was sensitive to changes in

Proportion of reconstructed graphs with an edge between implant and TTR for a given

Proportion of reconstructed graphs with an edge between implant and TTR for a given
The ability of the algorithm to detect direction was inconsistent and highly sensitive to errors in connectivity. When the reconstructed graph was fully connected, no directionality was inferred. In the simulations where one of the edges was undetected, the algorithm attributed a causal direction to the other edges, but often in the incorrect orientation. Specifically, when attempting to establish a causal relationship between implant and TTR, the performance is highly variable, and even a large effect size and a high usage of the implant of interest do little to improve the performance (Table 2).
Rates of detection and direction for an arc between implant and TTR for a range of both effect size and proportion of cases that use the implant of interest.

Abbreviation: TTR, time to first revision.
Proportion of simulations that identified an arc between implant and TTR.
Simulations that identified an arc, proportion that identified a direction to the arc.
Simulations that identified a direction, proportion that identified the direction in the correct orientation.
Analysis of real patient data from MARCQI showed that the PC algorithm found an edge between implant of interest and TTR, whereas the Cox model did not indicate a statistically significant association between these 2 variables.
Discussion
This study aimed to provide a preliminary evaluation of the viability of using the TETRAD software package to aid in identifying causal relationships in arthroplasty registry data. The software performed well with data sets on the scale of large, national registries, but its ability to identify relationships was notably reduced when using data set sizes representative of regional registries such as MARCQI. The ability of PC algorithm implemented in TETRAD to determine direction of causation was unreliable and highly sensitive to any errors in the identified graph structure for simulations of both regional- and national-sized registries. Consequently, domain knowledge is required during postprocessing to produce the correct direction of the edge connecting implant to TTR.
The primary objective of study for this article was the identification of a properly directed edge between implant and TTR because that is necessary for postmarket surveillance outlier detection. The other edges were explored, but they performed as expected and were not included in the results for 3 reasons: (1) they did not display interesting variation between simulations, (2) the parameters that would cause interesting variation if changed do not vary considerably in our data set, and (3) they are not of primary interest to arthroplasty registry signal detection activities. The simulation parameters varied were chosen because they have some effect on the ability of the algorithm to detect the implant to TTR edge, and we wished to determine at what ranges of parameters this algorithm perform satisfactorily. The analysis was done based on an effect size of 2.0 based on the outlier detection methods used by the Australian Orthopaedic Association National Joint Replacement Registry.
5
The performance of the algorithm was dependent on the size of each group of cases being analyzed. If there are too few cases that use the implant of interest, the independence tests will be unable to detect an effect on TTR even if the effect size is large. The number of cases that use the implant of interest depends on
Although the inability to consistently determine the direction of the edge between implant and TTR is concerning, it does not disqualify TETRAD as a possible tool for causal discovery in arthroplasty because the directionality of the edge can be determined in postprocessing using logic. The PC algorithm prunes the fully connected DAG using statistical independence tests, and the result for a large registry is that the resulting undirected graph very likely has the implant-to-TTR edge correctly identified. The absence of direction is a result of the later steps in the PC algorithm that rely on analysis of 3-node chains as colliders or noncolliders (Figure 1). The very small DAG used for these simulations, which only had 3 nodes, will not provide the chains necessary for the edge directing portions of the PC algorithm. Larger DAGs that include age, BMI, surgeon volume, etc, are likely to provide DAGs that provide better directionality of edges. This should be an area of further investigation. However, even for the small DAGs analyzed here, the final step of causal inference can be done manually, making the method useful in practical settings. This is done by recognizing that TTR cannot cause implant because the choice of implant is made prior to the primary surgery, which is by definition prior to the revision event represented by the TTR variable. If the PC algorithm implemented in TETRAD returns an edge between implant and TTR, then the only logical direction can be from implant to TTR. Unfortunately, this domain knowledge cannot be implemented as a constraint in the PC algorithm; specifying the direction of this edge must be done as postprocessing following application of the PC algorithm.
With a large data set, the algorithm has the potential to be a useful tool in identifying a causal relationship between implant and TTR, but for smaller data sets such as MARCQI, there are too few revised cases to reliably detect an effect. For an
However, with a large data set, the algorithm reliably detects an edge down to an effect size of 2.0, even with a small
The ASR metal-on-metal implant experience was used to motivate this study, so it is reasonable to ask whether the PC algorithm would be able to identify an edge for an implant having the same clinical outcomes as the ASR at the time it was recalled from the market. That is, could the PC algorithm have identified it as an outlier device in 2010? That year was when data from the NJR prompted the voluntary recall of the device after several years of data from Australia suggesting the same. 24 At that time, the 5-year revision risk of the ASR was 13% according to the NJR. For comparison, the overall revision risk at 5 years reported in the NJR 2010 annual report was 2.9%. 25 This results in a ratio of ASR revision risk to overall revision risk of 4.5 (because the 2.9% value includes ASRs, the actual ratio of ASR to non-ASR devices is likely larger than 4.5). Our simulation results indicate that both large national registry and smaller regional registry would have a high likelihood of detecting an edge between implant and TTR, provided the device was highly used in the regional registry. Using the knowledge that implant choice precedes revision can direct the edge; therefore, the causal connection between the ASR and revision could likely have been determined using the PC algorithm. This supports the possible utility of the PC algorithm in implant postmarket surveillance.
The most obvious comparison is with methods conventionally used for postmarketing surveillance of medical devices. More specifically, this method should be evaluated in the context of methods used for postmarketing surveillance of hip replacement implants. The Australian Orthopaedic Association National Joint Replacement Registry, which first identified the ASR resurfacing hip as an outlier, 24 uses a rigorous process of postmarketing surveillance and outlier detection. 5 That process begins with computing revision risks. A device that has twice the risk compared with all others in the class is selected for additional Cox proportional hazards modeling to adjust for age and sex. Ranstam et al6,26,27 have made recommendations on statistical methods for analyzing implant data in arthroplasty registries, and they also focus on Cox models. Although these existing methods have been very useful, they lack the theoretical power of graphical causal model analysis for assessing causal relationship between implant and revision risk. Published analyses of revision risks associated with implant design features typically use multivariate modeling without reference to graphical methods for rigorously analyzing the problem causal inference, even though the ultimate purpose is to draw causal inference conclusions about the relationship between implant design and revision risk.28–39 Many of these studies use extensive and careful modeling and propensity score matching to mitigate bias,31,34,40 but they differ from this study because they do not describe formally employing concepts of d-separation and casual inference. 15 This is concerning because it has been shown by analysis of empirical data 7 and computer simulation 16 that regression modeling methods can produce results inconsistent with known causality.
The primary strength of this study was that it used a combination of real-world arthroplasty registry data and computer simulation. The simulation paradigm allowed for the causal discovery method to be evaluated against known causal relationships and effect magnitudes. Having known relationships enabled an analysis of whether the method could accurately determine the true causal relationship. Moreover, the statistical distributions and parameters used for the simulations were obtained by fitting models to data obtained from the MARCQI. Use of actual distributions strengthens the simulation results. Finally, a strength of this study was that it grew organically out of the work of the MARCQI device committee, which conducts statistical evaluations of revision risk by implant. Therefore, the selection of variables and the range to simulate over were based on actual postmarketing surveillance activities of hip replacement implants in the United States.
This study had 4 primary limitations: (1) it focuses on TTR outcome, (2) it used a simplified model of TTR, (3) it examined a limited number of causal relationships, and (4) no censoring was included. Joint replacement patients have many outcomes, including pain, range of motion, and avoidance of negative adverse events (death, revision, venous thromboembolism, etc). Revision is only one end point, and this is a limitation of the analysis. However, revision is the clinical end point that is virtually universally used in hip and knee arthroplasty registries. Because of the ubiquity of this outcome in the analysis of large arthroplasty registry quality improvement data sets, it makes sense to focus on revision. This study simplified revision to a random number assigned to each case. In actual registry data, not every patient has an associated TTR due to study length and censorship. This allowed us to run the simulation data directly through the causal discovery algorithm without interpolating missing values, but it also made the simulation data more poorly represent the registry data. Because implant selection is a comparatively easy factor to modify, quality improvement in hip and knee arthroplasty needs methods for determining causal relationships between implant and TTR. Conceptually, there are many factors that may confound statistical associations found between implant and TTR, including age, BMI, surgeon volume, hospital volume, etc. Although the focus on sex is well justified in the literature, it is only a first step in understanding the utility of causal discovery in hip arthroplasty implant analysis. The no censoring limitation likely has the biggest impact on registries that have not been around for a very long time because revisions often occur years after the primary surgery. Thus, it is more likely to affect a new registry such as MARCQI than an established registry such as the Australian Orthopaedic Association National Joint Replacement Registry.
We applied the PC algorithm to MARCQI data for a single hip stem/cup combination and found that the PC algorithm and Cox model produced different results regarding an association between implant and TTR. When the MARCQI data including age and BMI was used, the PC algorithm identified a number of relationships, including a directed arc from TTR to BMI. When we applied the PC algorithm to MARCQI data with only the 3 variables used in the simulations, the unused variables act as unmeasured noise variables as we previously found that there are relationships between them. As expected, the PC algorithm still identified an arc between implant and TTR. However, the Cox model did not indicate a statistically significant association between implant and TTR. Because we do not know the true causal relationship for this implant combination and TTR, we cannot conclude that the PC algorithm led to a false positive or the Cox model produced a false negative. However, this result does suggest that it is possible that the PC algorithm may detect outlier devices with higher sensitivity than Cox modeling.
This work prompts additional study into using causal discovery algorithms for arthroplasty registries. One potential area of further research includes improved modeling of TTR data. One of the limitations of this study is its simplified model of revision. Future work may implement a more complex model of TTR, such as semiparametric Bayesian survival analysis. 41 Additional work needs to be conducted to investigate other relevant clinical variables and the sensitivity of the results to unmeasured or noise variables. A potential future investigation may include the analysis of the MARCQI data set with the FCI (Fast Causal Inference) algorithm, which does not operate under the assumption that all variables are measured, which would be useful in a case as described above with MARCQI.
In conclusion, this study introduced and evaluated a novel tool for use in postmarketing surveillance of hip replacement implants conducted by large patient registries. The innovation lies in the fact that causal discovery algorithms have not—to our knowledge—been employed to analyze orthopedic implant data. The results indicated that it may be useful to identify edges in a DAG representing causality, but it is not nearly as good at identifying the causal direction of the edge. The method should continue to be investigated to determine how it performs in the presence of additional clinical variables. Finally, predictive modeling of implant revision risk is a long-term goal of this research. The identification of causal relationships is an important part of such modeling. Therefore, this work serves as a first step toward predictive analytics in arthroplasty.
Footnotes
Appendix 1
Acknowledgements
Although Blue Cross Blue Shield of Michigan and the Michigan Arthroplasty Registry Collaborative Quality Initiative work collaboratively, the opinions, beliefs, and viewpoints expressed by the author do not necessarily reflect the opinions, beliefs, and viewpoints of BCBSM or any of its employees.
Funding:
The author(s) disclosed receipt of the following financial support for the research, authorship, and/or publication of this article: Support for the Michigan Arthroplasty Registry Collaborative Quality Initiative is provided by Blue Cross and Blue Shield of Michigan and Blue Care Network as part of the BCBSM Value Partnerships program.
Declaration of conflicting interests:
The author(s) declared no potential conflicts of interest with respect to the research, authorship, and/or publication of this article.
Author Contributions
CC conducted computer simulations and wrote draft of manuscript; HZ analyzed MARCQI data and provided statistical insight to reporting error rates; BH gave clinical input on causal model to simulate; RH conceptualized, designed, and interpreted the study. All co-authors contributed to the writing of the manuscript and approved it.