
Abstract
A closed-form integro-differential equation (IDE) model of plasma dilution (PD) has been derived which represents both the intravenous (IV) infusion of crystalloid and the postinfusion period. Specifically, PD is mathematically represented using a combination of constant ratio, differential, and integral components. Furthermore, this model has successfully been applied to preexisting data, from a prior human study, in which crystalloid was infused for a period of 30 minutes at the beginning of thyroid surgery. Using Euler’s formula and a Laplace transform solution to the IDE, patients could be divided into two distinct groups based on their response to PD during the infusion period. Explicitly, Group 1 patients had an infusion-based PD response which was modeled using an exponentially decaying hyperbolic sine function, whereas Group 2 patients had an infusion-based PD response which was modeled using an exponentially decaying trigonometric sine function. Both Group 1 and Group 2 patients had postinfusion PD responses which were modeled using the same combination of hyperbolic sine and hyperbolic cosine functions. Statistically significant differences, between Groups 1 and 2, were noted with respect to the area under their PD curves during both the infusion and postinfusion periods. Specifically, Group 2 patients exhibited a response to PD which was most likely consistent with a preoperative hypovolemia. Overall, this IDE model of PD appears to be highly “adaptable” and successfully fits clinically-obtained human data on a patient-specific basis, during both the infusion and postinfusion periods. In addition, patient-specific IDE modeling of PD may be a useful adjunct in perioperative fluid management and in assessing clinical volume kinetics, of crystalloid solutions, in real time.
Introduction
Volume kinetics (VK) is the study of the physiologic response to the intravenous (IV) infusion of fluids. Its utility is virtually ubiquitous within the practice of anesthesia and related medical disciplines. Fundamentally, VK is therefore the analysis of the pharmacokinetics of clinically used IV resuscitation agents: crystalloids and colloids. The basis for this is sequential measurements of hemoglobin (Hb) and the calculation of plasma dilution (PD) as a function of time. 1
Both hypervolemia and hypovolemia are known risk factors which can increase hospital-based length of stay and postoperative morbidity and mortality.2,3 Multiple clinical techniques are available to assess volume status in high-risk surgical patients. However, these may be invasive as they require central venous or arterial access.4,5 Minimally-invasive technologies, such as the esophageal Doppler monitor (EDM), have been developed and may also be used to evaluate patient volume status as well as other hemodynamic parameters. 6
Fluid resuscitation is universally employed during clinical hospital-based patient management but is complicated by both the choice and quantity of agent. Specifically, these drugs are divided into two primary categories: crystalloids and colloids. Although a considerable clinical controversy has historically existed when comparing them, there is a growing body of evidence to suggest that colloid-based resuscitation may be advantageous, particularly in hypovolemic shock states.7,8
The assessment of PD allows for the clinical measurement of the pharmacokinetic effects, of either of these agents, to be quantitated. In addition, the ability to noninvasively estimate Hb concentration has recently emerged. Consequently, PD may be rapidly and safely assessed in real time. 9
This article develops and examines the clinical application of a mathematical representation of PD using an IV-administered crystalloid solution. Note that a single model is developed which represents both the infusion period and the postinfusion period and is based on a first-order linear integro-differential equation (IDE) with constant coefficients. A closed-form solution is obtained using the Laplace transform technique. 10 Furthermore, this model has been successfully applied to preexisting clinical data, which used invasive measurements of Hb, on humans undergoing either IV or inhalational anesthesia during thyroid surgery. 11
Applying Euler’s formula, 12 retrospective examination of the patient data yielded two mathematically unique expressions from the Laplace-based solution to the IDE during the infusion period. This resulted in the separation of the patients into two distinct groups.
Specifically, Group 1 patients’ infusion-based PD responses could be modeled using an exponentially decaying hyperbolic sine function, whereas Group 2 patients had infusion-based PD responses which were modeled using an exponentially decaying trigonometric sine function. In addition, the area under the PD curve (AUC) during the infusion period was statistically greater for Group 2 patients. This implies that Group 2 patients had a significantly decreased initial volume status in comparison with that of Group 1. Furthermore, Group 2 patients continued to have a statistically greater AUC during the postinfusion period.
Thus, IDE modeling of PD may be potentially useful, as an adjunct clinical tool, in identifying, managing, and assessing patient-specific responses to the administration of IV fluid. This model also illustrates that the generation of edema and the recruitment of edema may occur simultaneously. Furthermore, the rate of the recruitment of edema may also occur in a manner which is both directly and indirectly dependent on PD status.
Development of a linear first-order IDE model of PD during infusion
The fundamental concept employed in VK analysis is that of a time-dependent PD function, pd(t). Specifically, plasma volume as a function of time is denoted as V(t), whereas a time-dependent change in V(t) is represented as ∆

Note that the term μ is a dimensionless “dummy variable,” whereas
Clinically,
Thus, the PD function is typically examined using serial measurements of a patient’s Hb:

Note that each time interval ti is associated with a measured Hb value of Hbi. Therefore,

The net flow rate of plasma volume,

Therefore, when
The volume of IV fluid infused into the patient is defined as:

where Ri represents a constant flow rate, typically of a crystalloid-based IV fluid, and is usually expressed in terms of milliliter per minute. Furthermore,
Thus, Ri is independent of the PD status during the infusion period, whereas Ri appears to be indirectly dependent on the PD status during the postinfusion period (see “Results”).
For the purposes of this model, the volume “cleared” from the plasma, as a function of time, is defined as follows (significant evaporation and/or blood loss can potentially result in changes in PD. However, these effects are neglected within this analysis):

Where
Furthermore,

Conceptual diagram which illustrates pd(t) as well as its single and double indefinite integrals during the infusion process. When combined using coefficients Cl and A, these integrals model the volume of plasma cleared. Note how they mathematically “behave” relative to each other and to the plasma dilution function, pd(t). Furthermore, their respective flow rates can be subsequently represented, using their first derivatives with respect to time, as demonstrated in Figure 2.
The physiologic foundation for equation (6) is based on clinical observations of both urine output and patient weight gain during IV infusions.14–16 However, neither the single integral term nor the double integral term is specific for either of these physiological phenomena. Rather, the volume of edema and urine formed are “lumped together” and modeled as having quantities which would result from a combination of both the single and double integration processes. Figure 1 illustrates this heuristic approach.
It should also be appreciated that endocrine-based hormones such as renin, angiotensin, aldosterone, atrial natriuretic factor, and antidiuretic hormone (ADH) all affect PD both directly and indirectly 17 (see “Discussion”).
Finally, using the first derivatives with respect to time of equations (5) and (6), the flow, both into and out of the plasma, can be described. This is illustrated in Figure 2. Using equation (6),

Illustration of the flow rate into the plasma, Ri, and the two flow rates out of the plasma. Note that one flow rate out of the plasma is proportional to the plasma dilution function, pd(t), whereas another is proportional to its indefinite integral. Furthermore, Cl and/or A could have negative values which would represent additional flow, into the plasma, from both the direct and indirect recruitment of edema.
the flow out of the plasma,
In addition to urine,
In addition, this model allows for the simultaneous representation of both the creation of edema and the recruitment of edema. This occurs during both the infusion and the postinfusion periods. As stated, the recruitment of edema results from lymphatic drainage as well as direct transcapillary reflux. These can be modeled with Cl and/or A as negative values during the infusion period (see “Results”).
As previously stated, during the postinfusion period, Ri continues to have a positive value which subsequently represents the recruitment of edema, at a constant rate, which is indirectly dependent on PD status. This is in contradistinction to the value of Ri during the infusion period in which it represents the constant flow rate of IV fluid into the plasma. Furthermore, during the postinfusion period, coefficients Cl and/or A can also take on different values, irrespective of the value either had been during the infusion period.
Moreover, at t = 0 during the infusion period,

In addition, as illustrated in Figure 2,

Plasma volume, as a function of time, is:

Consequently, the change in plasma volume as a function of time is:

Substitution yields the following:


Whereas

Using the time rate change of volume, the subsequent net flow,

By substitution,

Therefore,

Note that Q(t) represents the net flow of fluid into and out of the plasma.
Development of the principle equation
The principle equation represents the overall characterization of PD and the associated physiologic properties which regulate it. This applies during both the infusion and postinfusion periods.
Dividing both sides of equation (11) by

Applying equation (4) and differentiating:

Therefore, using equation (17):

Rearranging equation (19) and solving for pd(t) yields the principle equation:
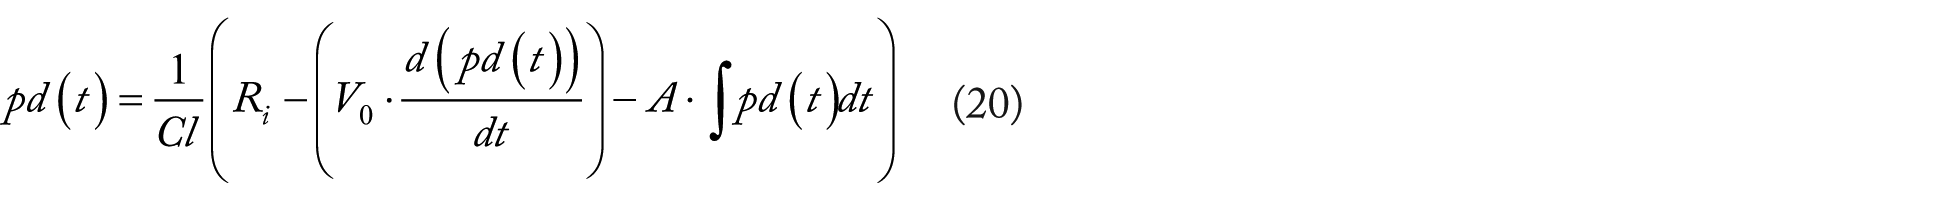
Using the principle equation, pd(t) can be represented as a linear first-order IDE having constant coefficients as well as three distinct components: constant ratio, differential, and integral:

Algebraic rearrangement demonstrates that when pd(t) is added, to both the differential and integral components, the result is equal to the constant ratio component:

Equation (22) further demonstrates the physiological process of autoregulation of PD, whereas Figure 3 illustrates the principle equation using a component-based block diagram.

The principle equation can be represented as a combination of three components which control or regulate pd(t): constant ratio, differential, and integral. This applies to both the infusion period and the postinfusion period. Positive influence. Negative influence. Feedback. Indirect influence. Result. Note that the indirect influence of pd(t) on Ri applies only during the postinfusion period.
The solution for the above principle equation, which represents

Where
Application of Euler’s formula
It should be noted that in the special case of

Applying Euler’s formula, as demonstrated in Appendix 2, the above equation can then be represented as follows: 12

Thus,

Note that
Development of a linear IDE model of PD during the postinfusion period
During the postinfusion period, the volume removed from the plasma can be defined in a likewise manner to that of the infusion period. Note that R, Cl, and A have the same physical dimensions during both the initial infusion and the postinfusion periods. However, their numerical values generally differ. For the purposes of this model, the postinfusion equilibration period “re-starts” at t = 0. Vout(t) is therefore:

The PD function, pd(t), is also derived using a similar method as that of the infusion period. Subsequently, an identical principle equation, as the one used for the infusion period, can be applied:

Therefore, a “three-component” model is again used. Note that during the postinfusion period,
The Laplace transform of equation (28) is thus indistinguishable, in form, to that of the infusion period: 10

Solving for PD(s) with algebraic rearrangement yields (see Appendix 4):

Thus, it becomes obvious that the postinfusion solution is a combination incorporating that of an infusion component with a nonzero initial condition component. Equation (30) also demonstrates that both components share a common denominator, within the Laplace domain.
As previously stated, the initial condition component is equal to zero during the infusion period (during the postinfusion equilibration period,
Thus, the inverse Laplace transform 10 of equation (30) can be thought of as the general solution for both the infusion and the postinfusion periods (see Appendix 4):

where
PD as a two-component model using a biexponential equation
Equation (31) for

The following dimensionless coefficients can then be defined:

Substitution and rearrangement yields:

With further rearrangement, a biexponential function results:

Note that this biexponential equation (35) can also be thought of as having a component structure. Using its straightforward form, it can be easily employed to numerically verify the curve fitting process, the principle equation, and the Laplace-based solution to the principle equation. These can be readily accomplished, using equation (35), by determining both the first derivative and the indefinite integral of pd(t):

and

where

Unlike traditional biexponential pharmacologic models,
Finally, based on the clinical data of this study, K1 can have either a nonzero real or imaginary value, whereas
Materials and Methods
Retrospective data acquisition
Data for this analysis were obtained retrospectively from an institutional review board (IRB)–approved previously published study. 11 Additional IRB approval was further obtained at each authors’ institution for the analysis presented in this article. The authors have no direct or indirect financial interest in any product or business entity mentioned in this study. Furthermore, the specific details of the initial study are public domain and can be readily obtained.
To summarize the data collection process, 30 patients who had given their informed consent were randomized to receive either an IV hypnotic (propofol) or an inhalational anesthetic (isoflurane). Both techniques were supplemented with an opiate (fentanyl) and a muscle relaxant (rocuronium). All patients were scheduled for elective thyroid surgery. One patient, within the IV anesthetic group, was removed from the analysis due to excessive intraoperative blood loss. Table 1 summarizes the available demographic data for the study.
Demographic data for all patients.

“Iso” refers to the inhalational general anesthetic agent isoflurane, whereas “TIVA” refers to total intravenous anesthesia. Where appropriate, values are expressed as a mean with their associated standard deviations in parenthesis.
Following the induction of general endotracheal anesthesia, patients received 25 mg/kg of IV crystalloid (Ringer’s acetate solution) over 30 minutes. No additional IV fluid was administered while the patients were anesthetized. Furthermore, separate IV access was used to obtain and assess each patient’s sequential Hb measurements. This was done to avoid “false hemodilution” which could occur from obtaining the blood samples using the same site as that of the administered IV fluid. Moreover, each sample consisted of 2.5 mL of blood.
Data Analysis
Each patient’s predicted plasma volume was determined using standard well-established formulas.
18
This value,


where BSA is the body surface area in square meters:

Specifically,
After measuring sequential Hb values and each patient’s initial hematocrit
Curve fitting was subsequently performed using a “sum of the square error” Levenberg-Marquardt algorithm with Mathcad (PTC Corp., Needham, MA, USA) to determine patient-specific values for Cl and A during the infusion period. 20 Equation (23) was used for this. Note that during the infusion period, the value used for Ri corresponded to each patient’s infusion rate of IV fluid in mL/min.
Using equation (31), this same curve fitting algorithm was also employed to determine separate patient-specific values for Ri, Cl, and A during the postinfusion period. Note that pd(0) during the postinfusion period corresponded to each patient’s pd(30) value during their respective infusion period.
For curve fitting the postinfusion data, the “seed values” for both Cl and A used their respective patient-specific values which were obtained from the prior analysis of each individual’s infusion period.
A seed value for Ri of 25 mL/min was also used for curve fitting during the postinfusion period. However, a trial of different seed values for Ri subsequently yielded different values for both Cl and A. Nonetheless, the mathematical processes which were used resulted in realistic group-based mean values for Ri, Cl, and A and uniformly low patient-specific errors during the postinfusion period (see “Discussion”).
Consequently, a, b, and w were then determined, for both periods, from calculations which incorporated V0, Ri, Cl, and A (see Appendices 3 and 4).
Following the curve fitting processes for each patient, the AUC was determined using numerical integration with Mathcad. As before, this process was done separately for each individual’s infusion and postinfusion periods. Note that AUC has dimensions of time (minutes).
Preliminary statistical assessment and charting used Excel (Microsoft Corp., Redmond, WA, USA). Where appropriate, a two-tailed Wilcoxon rank sum test was employed for the analysis of unpaired data, whereas a two-tailed Wilcoxon signed rank test was used for the examination of paired data. Fisher’s exact test was also used for the analysis of categorical data. These additional statistical analyses were accomplished using XLSTAT (Addinsoft, New York, USA). Note that the Wilcoxon tests are nonparametric and are appropriate for this analysis, given the small sample size and that the data are not normally distributed.
Statistical significance was defined as P < .05. In addition, it should be noted that several comparisons approached statistical significance such that
Results
Examination of clinically-obtained human data
Figures 4 and 5 illustrate the average PD response, for all patients, at each point in time. The start of an obvious ceiling or saturation-like effect can be noticed during the latter aspect of the infusion period. This occurred at a mean PD value corresponding to approximately 0.3 or 30%. Following the cessation of the infusion, the mean PD quickly decreased to a value of roughly 0.15 or 15%. Note that the postinfusion period is characterized by an initial rapid diminution in PD which is subsequently followed by a slower rate. Pharmacologically, these would correspond to distribution and elimination phases, respectively.

Infusion and postinfusion periods were sequential events. Specifically, the infusion period occurred during the first 30 minutes of surgery. Subsequently, the postinfusion period was from 30 minutes until 150 minutes. Data points represent the mean values, at each point in time, for the entire 29 patients.
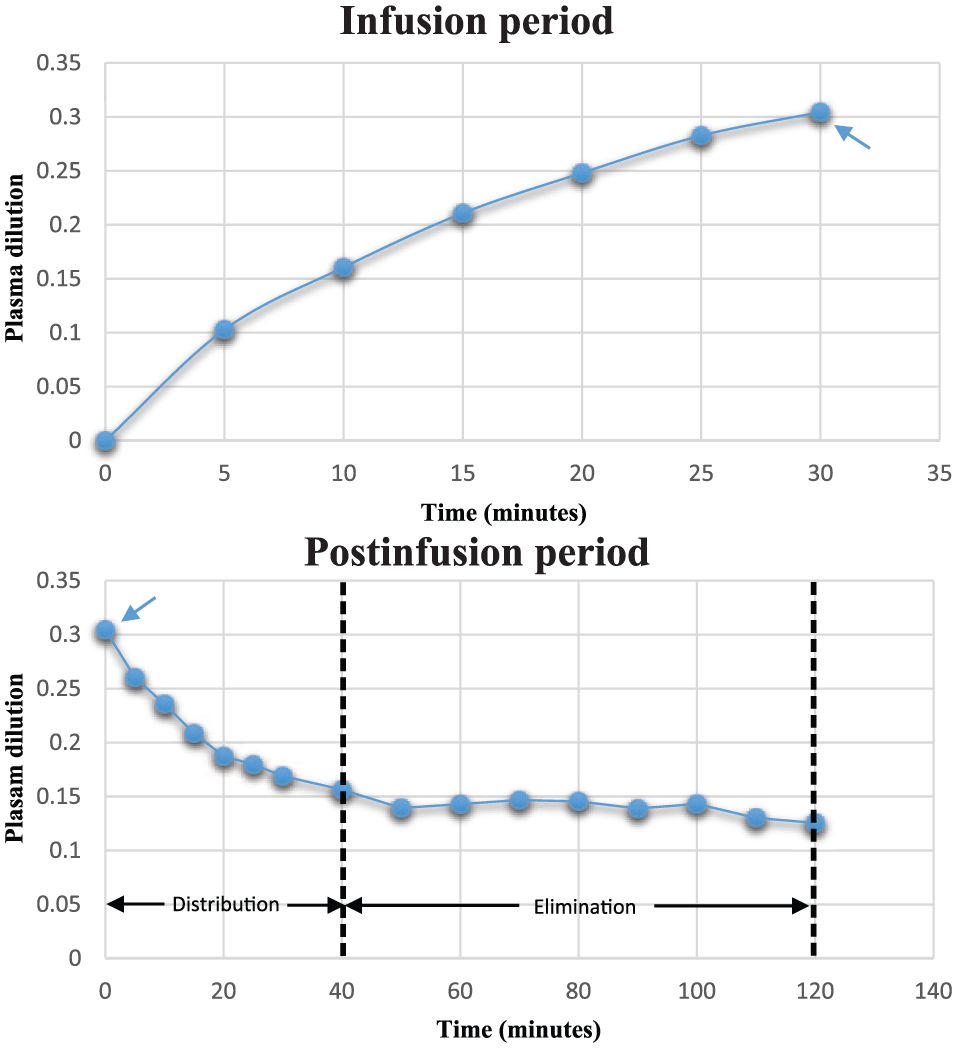
For modeling purposes, the infusion and postinfusion periods were separated into two distinct time-based entities. Note that pd(0) = 0 for the infusion period, whereas pd(0), for the postinfusion period, corresponded to the final value, pd(30), of the infusion period (note the blue arrows). Furthermore, the start of a saturation-like effect can be observed during the infusion period, whereas distribution and elimination phases are visible during postinfusion.
Properties of Group 1 and Group 2 patients
After curve fitting each individual’s PD values during the infusion period, patients were subsequently categorized into two distinct groups: Group 1 patients had values such that
Group 1 and Group 2 are distinguished based on the values of coefficients b and w being either both real or both imaginary during the infusion period.

The form of the solution to the principle equation, for Group 2 during the infusion period, employs Euler’s formula and results in an exponentially decaying trigonometric sine function.

This is in contradistinction to an exponentially decaying hyperbolic sine function which is used for the solution to the principle equation for Group 1 during the infusion period (see Appendix 2). Nonetheless, both groups have solutions, which are similar in mathematical form, for their postinfusion periods.
Table 2 therefore illustrates the how Group 1 and Group 2 are distinguished on the basis of coefficients b and w being either both real or both imaginary during the infusion period. This resulted in Group 2 having a different form, of the solution to the principle equation, during the infusion period (see Table 3 and Appendix 2).
Table 4 separates the original demographic data, from Table 1, based on each patient’s respective group. Note that Group 1 patients had heights which were taller and associated BSAs which were also greater. Consequently, predicted plasma volumes were larger as well. However, these differences only approached statistical significance. It should also be noted that body mass index (BMI) was similar between both groups. Where BMI is defined: 21
Analysis of demographic data following Group 1 and Group 2 patient categorization.

Abbreviations: BMI, body mass index; BSA, body surface area; Iso, isoflurane; TIVA, total intravenous anesthesia.
Where appropriate, values are expressed as a mean with their associated standard deviations in parenthesis.
Values approached statistical significance

Note that BMI has units of kg/m2. Prior to the induction of general anesthesia, both groups had vital signs which were statistically similar (see Table 5). It should be noted that the infused absolute volume of crystalloid was less for Group 2 patients. However, this difference also only approached statistical significance. Nonetheless the infused volume, per kg of total body weight (25 mg/kg), was identical for both groups (see Table 5 and “Materials and methods”).
Infused IV fluid volume, urine output, and hemodynamic parameters for both groups before the induction of general anesthesia.
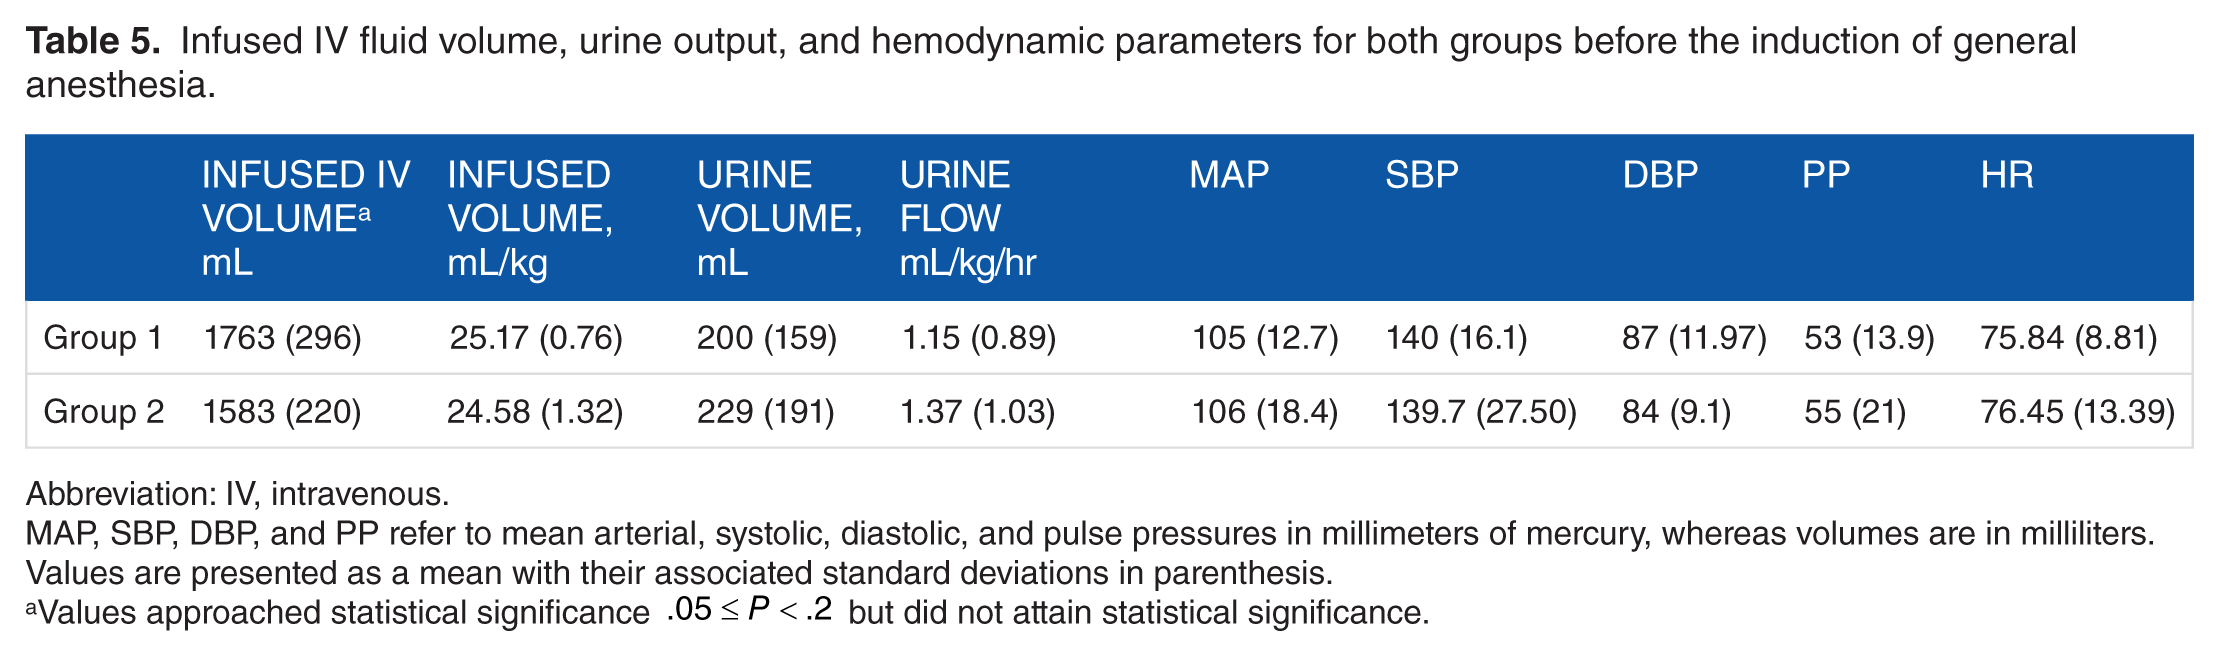
Abbreviation: IV, intravenous.
MAP, SBP, DBP, and PP refer to mean arterial, systolic, diastolic, and pulse pressures in millimeters of mercury, whereas volumes are in milliliters. Values are presented as a mean with their associated standard deviations in parenthesis.
Values approached statistical significance
Clinical and pharmacologic aspects of the IDE model during the infusion period
Table 6 summarizes the differences between the two groups following curve fitting of each patient’s PD responses.
Curve-fitted parameters, and their associated calculated coefficients, used for modeling the response to plasma dilution for both Group 1 and Group 2 patients during the infusion and postinfusion periods.

Abbreviation: AUC, area under the PD curve.
p(0) for the postinfusion period corresponds to p(30) during the infusion period. Furthermore, coefficients b and w are both imaginary, during the infusion period, for Group 2 patients. Values are presented as a mean with their associated standard deviations in parenthesis.
,#Statistically significant intragroup difference.
,#§Intragroup values whose differences approached statistical significance.
Statistically significant intergroup difference.
Intergroup values whose differences approached statistical significance.
During the infusion period, Group 2 patients had a significantly greater AUC than those of Group 1. This implies that Group 2 patients may have had a lower initial plasma volume (reduced hydration status) than what may have been predicted. In addition, Group 1 patients had a significantly greater mean value for Cl than those of Group 2. Furthermore, Group 1 patients had an average value for A which was negative, whereas Group 2 had an average value for A which was positive.
Thus, Group 1 patients may have generated more edema, as well as recruited more edema, when compared with those patients from Group 2. This is clinically consistent with Group 1 patients having had a greater initial hydration status than Group 2.
As stated, the differences between patient-specific values for Cl and A during the infusion period lead to the division of the patients into the two distinct groups, with b and w being either both real or both imaginary.
Clinical and pharmacologic aspects of the IDE model during the postinfusion period
Postinfusion, Group 2 patients continued to have a statistically greater AUC for their PD responses than those of Group 1. Furthermore, the initial value, pd(0), was also greater for Group 2 patients as compared with those of Group 1. Because less edema was assumably generated by Group 2 during the infusion period, less edema was consequently recruited. Thus, Ri, Cl, and A remained higher for Group 1 patients, postinfusion, as compared with Group 2 patients.
Recruitment of edema may be both directly and indirectly dependent on PD status
Examination of Group 1, during the infusion period, demonstrates that the recruitment of edema may be occurring at a rate which is negatively proportional to the AUC of PD (see Table 6). This is modeled as coefficient A having a negative value.
Note that during the postinfusion period, both Group 1 and Group 2 had values of Ri which were numerically positive. This denotes the recruitment of edema at an average constant rate. In addition, observation of the postinfusion values for Ri with respect to AUC, Cl, and A illustrates the probable indirect dependence of Ri on PD status (see Figure 3 and Table 6):


where
The generation of edema appears to be dependent on PD status
Using Table 6, inspection of coefficient Cl demonstrates that the generation of edema is most likely dependent on PD status. In addition, the value of Cl was statistically different between groups, for both the infusion and postinfusion periods.
As Group 1 patients were presumably more hydrated than those of Group 2, these patients probably generated more edema than those of Group 2. Despite this, overall urine production was statistically similar when examining both groups (see Table 5).
Postinfusion, coefficient A further demonstrated that the production of edema appeared to be inversely proportional to the AUC of PD, with Group 2 patients having had a statistically smaller value for A as compared with those of Group 1. This is consistent with Group 2 patients being less hydrated than those of Group 1, as AUC was greater for Group 2 patients during both the infusion and postinfusion periods.
The initial value for the postinfusion period and AUC
During the postinfusion period, pd(0) was significantly greater for Group 2 patients as compared with those of Group 1. This is also “supportive” of Group 2 patients having a greater AUC during both the infusion and postinfusion periods as follows:

It should be noted that pd(0) for the postinfusion period and AUC for both the infusion and postinfusion periods are “model independent.” Thus, neither of these values would be significantly different had alternative patient-specific curve-fitted modeling schemes been used.
Model adaptability and goodness-of-fit
The ability of the IDE model to change or “adapt” from that of an exponentially decaying hyperbolic sine function, to that of an exponentially decaying trigonometric sine function, is extremely useful when one examines the tremendous patient-to-patient variation which is clinically encountered throughout the time course of PD.
Figure 6 further illustrates the benefit of the “adaptive” nature of this model. This occurred primarily from coefficients b and w being either both real or both imaginary. Thus, during the infusion period, the model had polynomial, limiting, or sinusoid-like properties. Consequently, there was a considerable reduction in patient-specific model-related error.

The above patient responses, to plasma dilution, illustrate the adaptive nature of the integro-differential equation model during the infusion period. Note how it can individually curve fit data with limiting, sinusoidal, or polynomial characteristics. Furthermore, patient 24 had a solution which used a Group 1 form, whereas patients 7 and 23 both had solutions which used a Group 2 form.
The IDE model also used its “adaptive behavior” during the postinfusion period. Thus, slowly decreasing, rapidly decreasing, and parabolic-like PD responses were represented after the cessation of the infusion of crystalloid. These are illustrated in Figure 7. Note that postinfusion, b and w were both real. Nonetheless, a wide range of positive and negative values, for Cl and A, also contributed to patient-specific adaptability during both the infusion and postinfusion periods. Postinfusion, Ri similarly exhibited a wide range of values. However, these were consistently positive (see Table 6).

The adaptability of the integro-differential equation model is further illustrated with slowly diminishing, rapidly diminishing, and parabolic plasma dilution responses during the postinfusion period. In addition, based on curve fitting during the infusion period, patients 4 and 12 were categorized as Group 1, whereas patient 16 was categorized as Group 2.
Figures 8 and 9 illustrate the goodness-of-fit analysis, for the infusion and postinfusion periods, for both groups. Note that linear regression is used to statistically assess the correlation coefficient (R2) of the measured PD data points to their corresponding IDE-based calculated PD values. These high R2 values, which are greater than 0.93, further demonstrate the overall adaptive nature of this patient-specific modeling scheme.
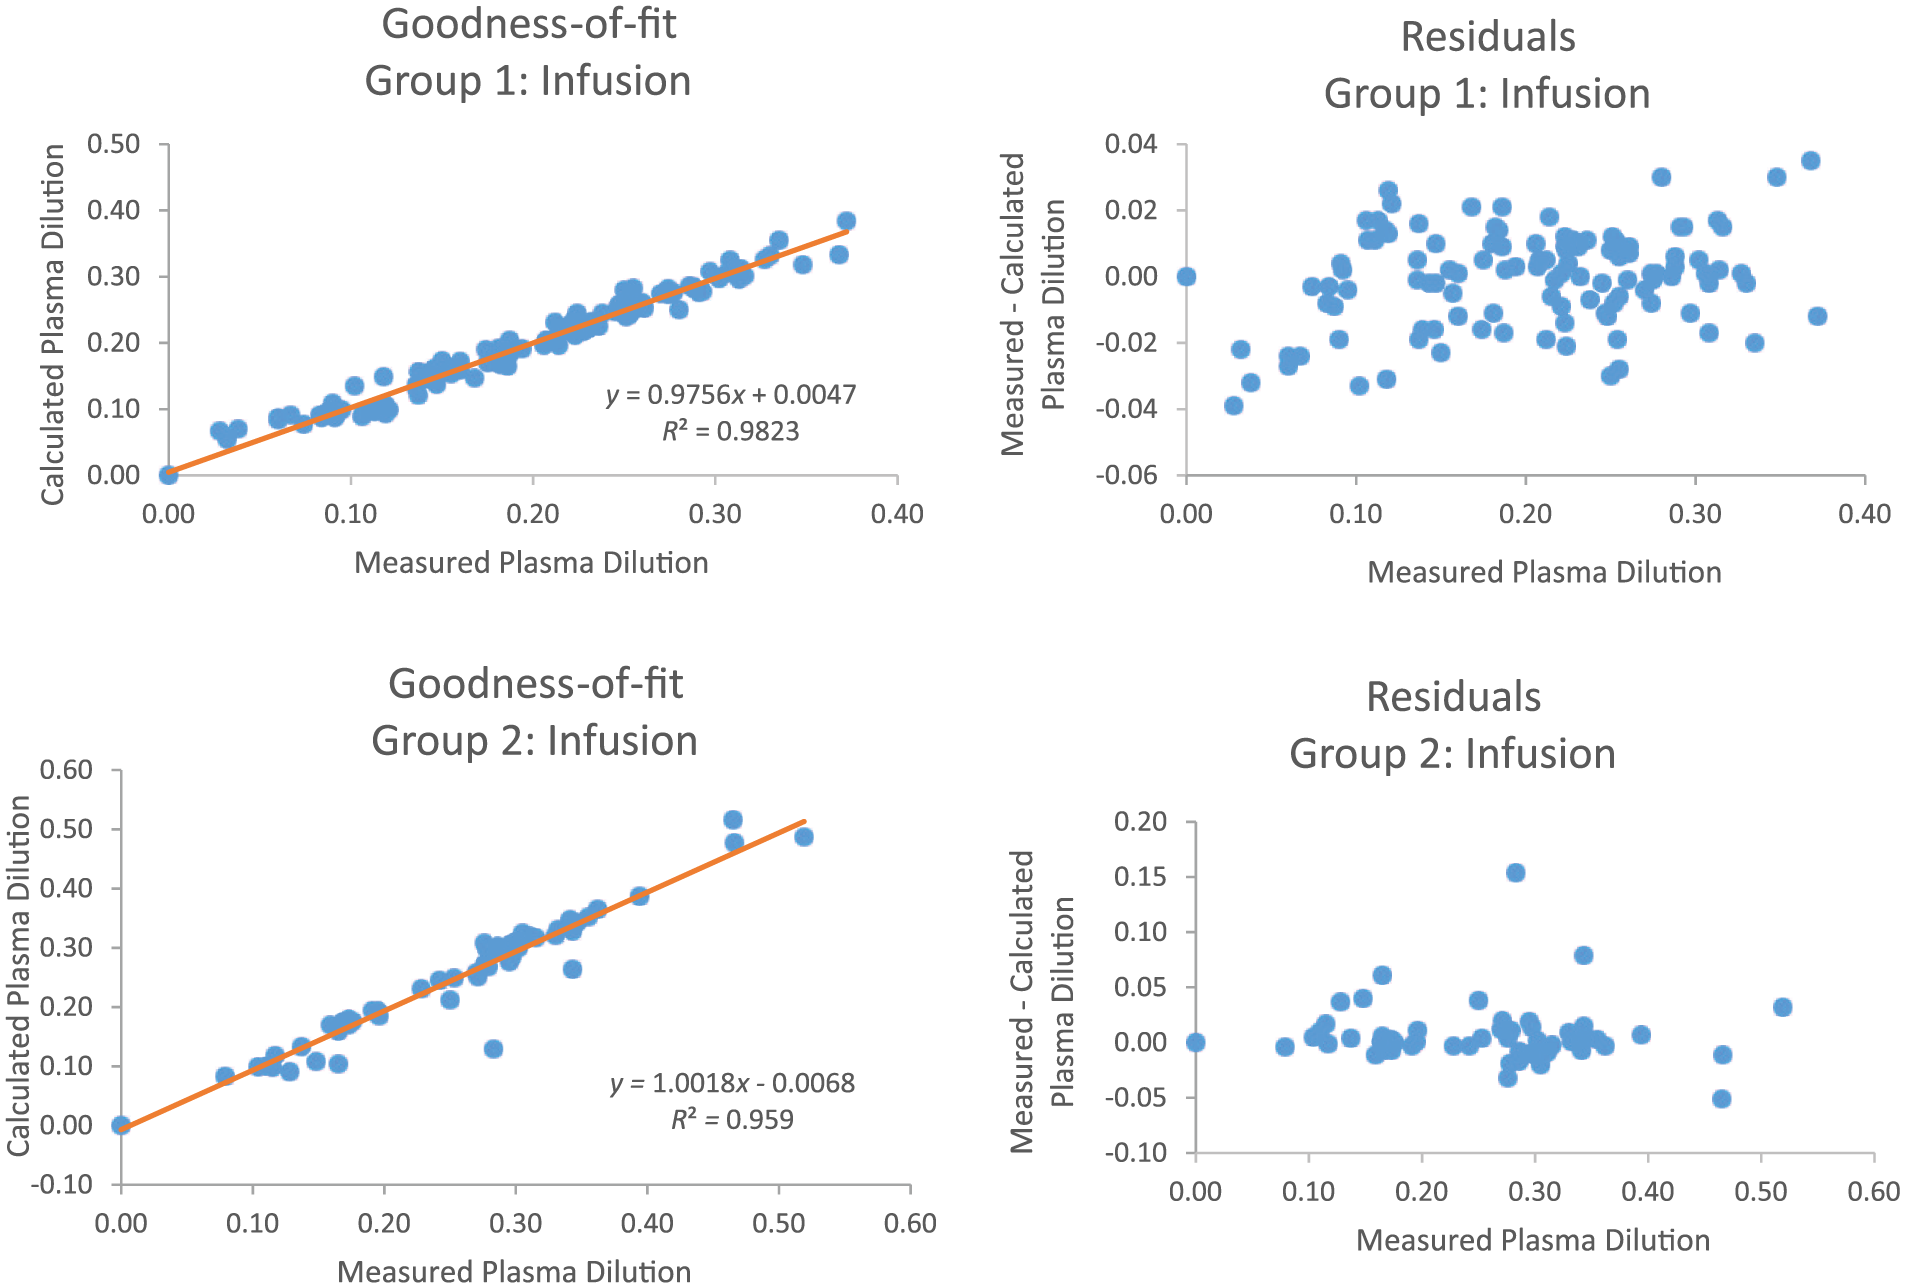
Goodness-of-fit and residual analysis for Group 1 and Group 2 during the infusion period.
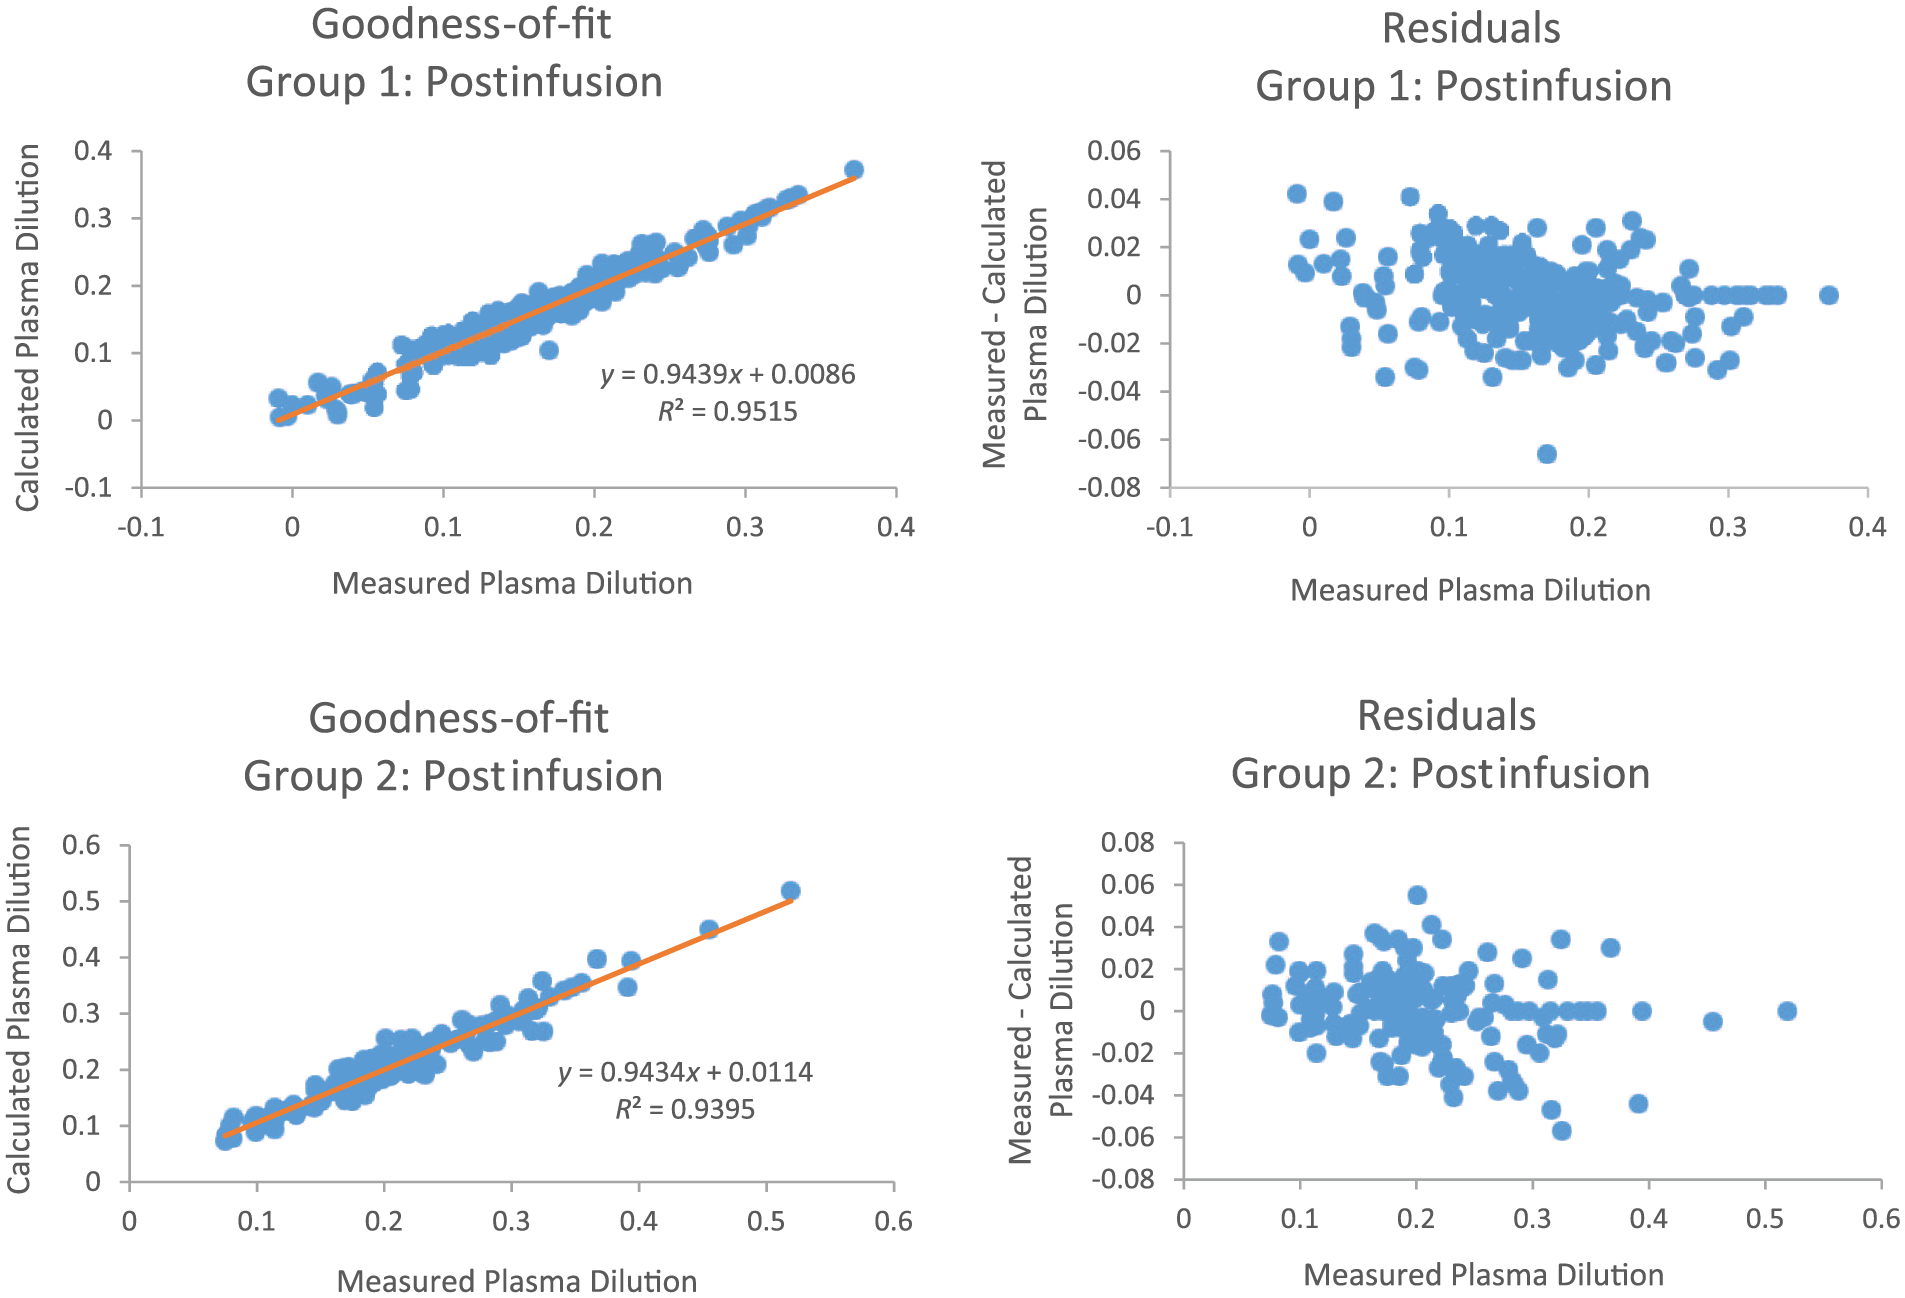
Goodness-of-fit and residual analysis for Group 1 and Group 2 during the postinfusion period.
Note that the residual plots represent the difference between each measured PD data point and its associated calculated value. Examination of these graphs illustrate that model-generated error is approximately evenly distributed, both above and below zero.
Discussion
The clinical importance of VK
Intravenous fluid resuscitation is an essential component of hospital-based patient care and can have a potentially significant therapeutic benefit as well as an associated morbidity and mortality. In recent years, adverse effects caused by both over and under hydration have also been increasingly acknowledged.22,23 Consequently, judicious use of IV fluids is dependent on the understanding of VK and on PD. Of note, during clinical volume resuscitation, PD is often referred to as plasma volume expansion.
In addition, the intricate physiologic mechanisms the human body uses for fluid homeostasis must be thoroughly understood. Furthermore, the alteration of these mechanisms in the presence of disease, surgery, and anesthesia must also be fully appreciated, by both clinicians and researchers.
Physiologic aspects of VK and PD
Safe and effective use of IV fluids results in PD. This process therefore requires an understanding of VK, which is the physiologic response to the administration of crystalloids and colloids.
Water makes up approximately 60% of total human body weight. In a healthy individual, two-thirds of this water will be contained within cells and is collectively described as the intracellular compartment, whereas the extracellular compartment is subdivided into intravascular and interstitial compartments. Subsequent movement of fluids, between the intravascular and interstitial compartments, is determined by two types of pressure: oncotic and hydrostatic. The balance between them is referred to as “Starling hypothesis” and is the classic description of the fluid filtration process which occurs across capillary membranes. 17
Nonetheless, more recent research into the function of the glycocalyx of the capillary membrane may modify the long-standing theory of Starling. Thus, newer theories of transmembrane fluid shifts take into account the potential influence of the extracellular matrix, the basement membrane, and the endothelial glycocalyx layer. The oncotic pressure across the glycocalyx layer, which is a regulator of vascular permeability, is now believed to possibly oppose rather than reverse the filtration rate, consequently creating a “no-absorption rule.” This implies that colloids may have less of an effect when used for the treatment of edema in the setting of low capillary pressure. Therefore, crystalloids have been hypothesized as potentially being more beneficial for volume management. 24
However, recent clinical research supports the use of colloids for hypovolemic shock and “massive” resuscitation.7,8 In addition, EDM-guided fluid administration, with colloids, appears to shorten the length of hospital stay and is also associated with a statistically significant reduction in morbidities related to fluid management.3,25,26
Regulation of intravascular and extravascular body fluids
Volume kinetics and PD “reveal” the body’s overall physiologic response with respect to the fluid regulatory mechanisms: the neuroendocrine, renal, cardiovascular, and lymphatic systems. These control plasma volume homeostasis through their effect on capillary permeability, urine production, lymphatic transport, and osmotic pressure. Those hormones which play a pivotal role in this include the following: ADH, atrial natriuretic peptide (ANP), and the renin, angiotensin, and aldosterone system (RAAS). 17
Dysregulation and intervention
Certain conditions, such as hypovolemic shock, can profoundly affect the fluid regulatory mechanisms. Consequently, in this specific pathologic state, there would be a marked decrease in the release of brain natriuretic peptides, which have similar effects as ANP. Under this circumstance, the RAAS is also activated, resulting in both sodium and intravascular fluid retention. When these occur, there is an alteration in the fluid compartments. This is produced by a fluid shift with the net movement of water from the extravascular to the intravascular compartment. 25
This fluid shift occurs through changes in hydrostatic and/or osmotic pressure gradients, both of which control intravascular volume status. The net effect of this can be measured through the analyses of PD.1,9,25 Urine output and patient weight can also be used in assessing volume status.14–16 Furthermore, intravascular volume can be readily monitored with an EDM or other modalities.6,27,28
In addition to the normal function of the fluid regulatory mechanisms given above, and their disruption by disease states, exogenous perioperative IV fluids will also affect plasma osmotic pressure, and possibly osmosis, resulting in fluid shifts. Physiologic changes due to surgical stress and general anesthesia may also produce additional fluid shifts which need to be accounted for to prevent morbidity and mortality during the perioperative resuscitation process.25–28
Anesthesia
Patients receiving outpatient and “same-day” anesthesia are somewhat dehydrated because they are required to abstain from oral clear fluid intake for at least two hours prior to receiving anesthesia. Historically, surgical patients were instructed, “nothing after midnight.” This frequently put patients into a hypovolemic state and resulted in a reduced hydrostatic plasma pressure. Consequently, significant fluid shifts were triggered.25,27
General anesthesia, which is usually associated with both myocardial depression and vasodilation, also affects the fluid regulatory processes. It should be noted that a drop in hydrostatic pressure activates the RAAS with the subsequent promotion of fluid retention. This results in reduced urine output and a reduction in the elimination clearance of IV fluid.17,25 These effects have been demonstrated during abdominal, laparoscopic, and thyroid surgery.11,29,30
Experimental subjects, who received isoflurane without surgery, showed a 50% reduction in elimination clearance of 0.9% normal saline. Furthermore, this was associated with an expected increase in both renin and aldosterone levels. 31
Infusion models as tools: Pharmacokinetic theory and PD
Plasma dilution models incorporate pharmacokinetic theory. Intravenous colloids are fluids which remain in one compartment, the intravascular space, and are subsequently described by a one-compartment model, whereas crystalloids are fluids which distribute between the intravascular and interstitial spaces can be described using a two-compartment model.32–34
It should be noted that a traditional two-compartment model allows for the mathematical representation of both the formation of edema, as well as the simultaneous recruitment of edema, and the total clearance of the IV-administered crystalloid.11,30–32
As demonstrated, the aforementioned processes appear to occur at different patient-specific rates and may also depend on individual’s initial hydration status. These phenomena would explain the observed variability in the PD response.
Consequently, patient-specific adaptability is essential to infusion kinetic modeling. Fluid homeostatic mechanisms are either triggered or suppressed depending on the volume status of the individual. Retrospective application of our component-based PD model to these data, from a study of humans receiving concomitant thyroid surgery and anesthesia, has successfully demonstrated the utility of patient-specific adaptability.
This component-based model also retains the ability to represent the simultaneous generation of edema as well as the recruitment of edema. Therefore, Group 1, during the infusion period, had both a greater value for Cl and a negative value for A as compared with Group 2. This is consistent with Group 2 having an increased AUC and thus being relatively hypovolemic with respect to Group 1.
In addition, during the postinfusion period, Group 1 continued to have greater values for both Cl and A as compared with Group 2. Moreover, the AUC during the postinfusion period remained greater for Group 2 as compared with Group 1. Thus, Group 2 patients retained their hypovolemic characteristics during the postinfusion period. Furthermore, Ri was also greater for Group 1 postinfusion as compared with Group 2.
Consequently, the autoregulation process, which has been modeled using an IDE, can be loosely summarized in a straightforward manner. Those patients who generated more edema subsequently recruited more edema. Conversely, those patients who generated less edema recruited less edema. This was observed for the two patient groups, during both the infusion and postinfusion periods.
In addition, the use of Euler’s formula, with coefficients b and w being either both real or both imaginary, identified a subset of patients who, most likely, were relatively hypovolemic throughout both the infusion and postinfusion periods. Thus, Euler’s formula allowed the model to adapt to diverse patient-specific PD responses.
Finally, patient-specific adaptability was further “enhanced” by the relatively disparate positive and negative values, for Cl and A, during both the infusion and postinfusion periods as well as the wide range of positive values, for Ri, postinfusion.
Conclusions
Our newly developed IDE model of PD has demonstrated adaptability in describing patient-specific pharmacokinetic responses throughout both the crystalloid infusion period and the postinfusion period. This has been applied to human subjects simultaneously receiving anesthesia and surgery. This adaptability primarily arose from the application of Euler’s formula to the IDE solution. Using this mathematical identity, a clear distinction was found which allowed for the separation of the patients into two discrete groups. Specifically, this categorization was most likely based on patients’ initial volume status and the subsequent differences in the production and recruitment of edema. Furthermore, each group had unique pharmacokinetic responses with the most significant difference being the AUC. The present patient-specific IDE model of PD may become a useful tool in perioperative fluid management with the potential to assess real-time clinical VK of crystalloid solutions. Moreover, this model may be applicable to colloid-based infusion therapy as well.
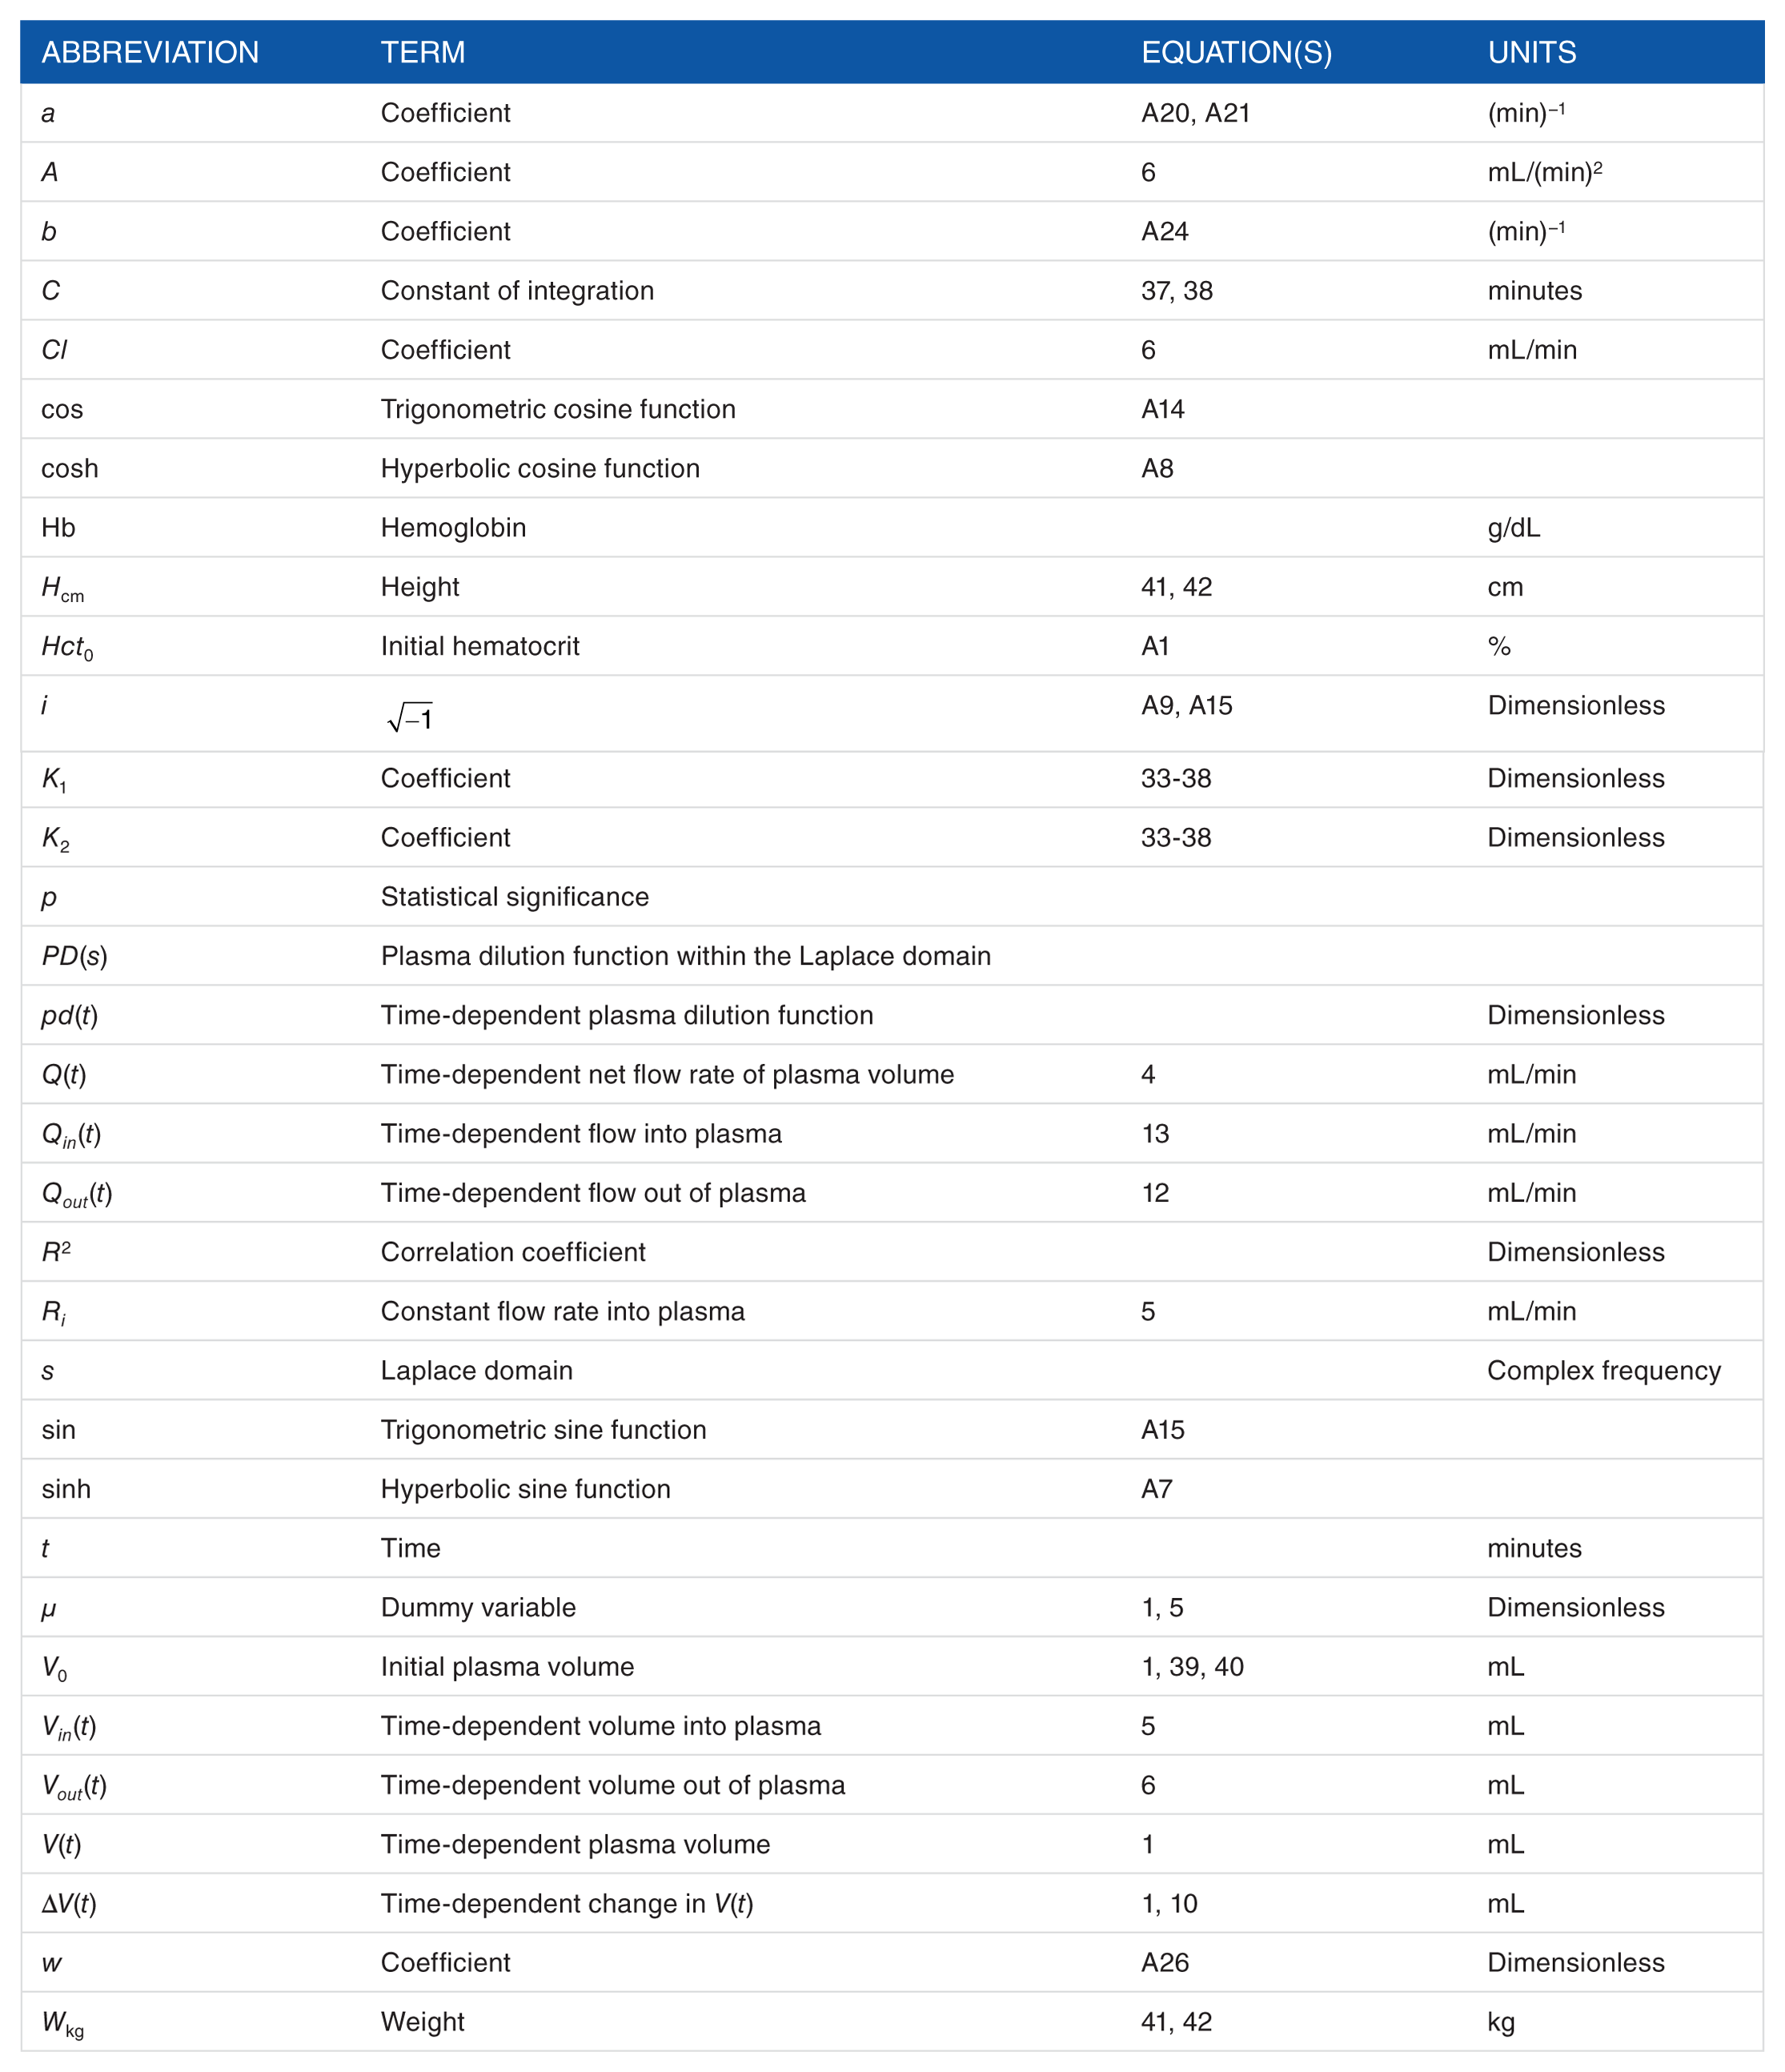
Notations
Footnotes
Appendix 1
Appendix 2
Appendix 3
Appendix 4
Peer review:
Two peer reviewers contributed to the peer review report. Reviewers’ reports totaled 413 words, excluding any confidential comments to the academic editor.
Funding:
The author(s) received no financial support for the research, authorship, and/or publication of this article.
Declaration of conflicting interests:
The author(s) declared no potential conflicts of interest with respect to the research, authorship, and/or publication of this article.