
Abstract
Background
Delirium is a prevalent yet underdiagnosed disorder characterized by acute cognitive impairment. Various screening tools are available, including the Confusion Assessment Method (CAM) and 4 A’s test (4AT). However, the results of these assessments may vary among raters. Therefore, we investigated the objective use of electroencephalography (EEG) in delirium and its clinical associations and predictive value.
Method
This cross-sectional observational study was conducted at Hospital Canselor Tuanku Muhriz, Universiti Kebangsaan, Malaysia, from April 2021 to April 2023. This study included patients aged ≥18 years with a preliminary diagnosis of delirium. Demographic and clinical data were collected along with EEG recordings evaluated by certified neurologists to classify abnormalities and compare the associated factors between patients with delirium with or without EEG abnormalities.
Results
One hundred and twenty patients were recruited, with 80.0% displaying EEG abnormalities, mostly generalized slowing (moderate to severe) and primarily generalized slowing (mild to severe), and were characterized by theta activity. Age was significantly associated with EEG abnormalities, with patients aged 75 and older demonstrating the highest incidence (88.2%). The CAM scores were strongly correlated with EEG abnormalities (r = 0.639, P < 0.001) and was a predictor of EEG abnormalities (P < 0.012), indicating that EEG can complement clinical assessments for delirium. The Richmond Agitation and Sedation Scale (RASS) scores (r = −0.452, P < 0.001) and Barthel index (BI) (r = −0.582, P < 0.001) were negatively correlated with EEG abnormalities. Additionally, a longer hospitalization duration was associated with EEG abnormalities (r = 0.250, P = 0.006) and emerged as a predictor of such changes (P = 0.030).
Conclusion
EEG abnormalities are prevalent in patients with delirium, particularly in elderly patients. CAM scores and the duration of hospitalization are valuable predictors of EEG abnormalities. EEG can be an objective tool for enhancing delirium diagnosis and prognosis, thereby facilitating timely interventions.
Plain Language Summary
Why was the study done? Confusion is frequently observed among patients presenting with various medical issues. There are several tests available to assist in assessment of these patients to see if the symptoms present constitute delirium. However, there may be occasions where identifying delirium is difficult despite the tools available. Electroencephalography (EEG) may be another option to assist medical personnel in diagnosing delirium. In this study, we examine the use of EEG in identification of delirium and its clinical associations. What did the researchers do? Our team studied the use of EEG in patients admitted for various medical issues with symptoms suggestive of delirium over a 2-year period. We collected relevant clinical data and performed EEG for each participant. What did the researchers find? A total of 120 participants were involved in the study. We observe abnormal EEG findings in 80% of patients with the majority showing generalized slowing. The factors associated with EEG abnormalities are advancing age, positive Confusion Assessment Method (CAM), and duration of hospitalization. What do the findings mean? As the service is not widely available, it would not be practical to substitute existing clinical assessment tools with EEG. However, we cannot discount the importance of identifying delirium due to its association with poor clinical outcomes. Therefore, for centers that may perform EEG, it may be used as an adjunct in diagnosing delirium should any doubts arise.
Keywords
Highlights
• 80.0% of participants with features of delirium exhibited EEG abnormalities • Age strongly correlated with EEG abnormalities 75 years and older (88.2%) • CAM scores positively correlated with EEG abnormalities, while RAAS scores and Barthel index had negative correlations.
Introduction
Delirium is a neurocognitive disorder characterized by an acute and fluctuating disturbance in attention, awareness, and cognition due to a physiological condition, as defined by the Diagnostic and Statistical Manual of Mental Disorders (DSM-5-TR). 1 The prevalence of delirium has been reported as 10 -31% at admission among the elderly population and is commonly observed in medical, postoperative, and intensive care patients.2-4 Delirium can be further classified into hyperactive, hypoactive, and mixed forms. 5 Clinically, patients may appear lethargic, stuporous, confused, aggressive, or irritable, with hallucinations in the opposite spectrum.
Despite its prevalence, clinicians often underdiagnose this condition. There is a marked heterogeneity in the literature on delirium screening and diagnostic methodologies. Diagnostic instruments include the confusion assessment method (CAM), CAM for intensive care unit (CAM-ICU), Delirium Rating Scale-revised version (DRS-R-98), and Mini-Mental State Examination (MMSE). 6 Recognition of delirium in hospitalized patients remains an integral part of comprehensive management because it adversely affects mortality, functional outcomes, length of hospitalization, and institutionalization.2,7,8 However, the various rating scales and instruments for delirium assessment have a wide range of sensitivities and specificities.
In view of the scarcity of definitive biomarkers for delirium and the potential for misdiagnosis through screening tools, electroencephalography (EEG) may be an objective tool for diagnosing delirium. EEG measurements are useful in characterizing cerebral dysfunction in patients with delirium. EEG appears to be useful in differentiating between patients with and without delirium. 9 EEG slowing and reduced functional connectivity helps to differentiate between the groups. The role of EEG in delirium and aging has proven useful for studying functional brain activity and differentiating disease states. Physiological changes during delirium can be demonstrated by the relative slowing of resting-state EEG rhythms with decreased background alpha power and increased theta and delta frequency activity. 10
Most hospitalized patients are at risk of developing delirium owing to multifactorial causes. Delirium is associated with prolonged hospital stays, greater dependency, and increased mortality. However, whether electroencephalographic markers are independently associated with delirium is unclear. Literature on EEG use and its clinical relevance in patients with delirium is limited. This study was conducted at a local tertiary hospital to determine the features observed with delirium among patients in medical wards.
Methodology
Study design
This cross-sectional observational study was conducted at Hospital Canselor Tuanku Muhriz, Universiti Kebangsaan Malaysia, from April 2021 to April 2023, with approval from the local Ethics and Research Board (Research code: FF-2021-161). Funding was obtained from the Universiti Kebangsaan Malaysia. Inpatients aged ≥18 years with a preliminary diagnosis of delirium were identified. We excluded those with documented language barriers or deafness, active psychiatric disorders such as psychosis or drug intoxication, severe neurological disorders such as stroke or meningitis, those administered sedatives (e.g. benzodiazepines, propofol) within 48 hours, and the presence of brain tumors or space-occupying lesions.
Convenience sampling was also performed. Patients were identified once they were admitted to the general medical ward, and our team was alerted. Assessments are carried out within 24 hours from time of referral. After obtaining written consent from their immediate family members, we used a data collection sheet to record the participants’ demographic and clinical variables, including age, sex, ethnicity, background medical illnesses, and non-neurological and neurological symptoms. Several assessment tools were used, including the CAM, Richmond Agitation and Sedation Scale (RASS), and Barthel index (BI). Data were collected by a single medical doctor.
Subsequently, all participants underwent routine EEG, which was recorded on a Nicolet One Extension (V32 Amplifier) using 24 reusable gold electrodes affixed to the scalp according to the international 10-20 system. The abbreviations for the EEG are as follows: Fp - frontopolar, C - central, F - frontal, T -temporal, P - parietal, O - occipital. Bipolar longitudinal and average referential montages were used for the evaluation. The EEG filter configuration was as follows: a 50 Hz filter; low-pass filter: 0.5 Hz; and high-pass filter: 70 Hz. The EEG recordings were evaluated by two certified neurologists who were blinded to the clinical and radiological findings. If any discrepancy arose between the two reports, both neurologists discussed them before arriving at a final conclusion.
Abnormal EEG findings were defined as generalized slowing (GS), focal slowing (FS), or the presence of epileptic patterns (spikes or sharp waves). GS was defined as the dominant rhythm within the theta (4-8 Hz) or delta (<4 Hz) frequency bands occurring over all regions of the head. Focal slowing (FS) was defined as slow activity (theta or delta) limited to a specific region of the head.
Assessment tools
Confusion assessment method (CAM)
The CAM is a validated scoring method that was first developed by Inouye et al, 6 in 1990 to aid clinicians without background psychiatry training to identify delirium rapidly. 6 It is based on the Diagnostic and Statistical Manual of Mental Disorders (DSM-III-R) and assesses the presence, severity, and fluctuation of nine delirium features: acute onset, inattention, disorganized thinking, altered level of consciousness, disorientation, memory impairment, perceptual disturbances, psychomotor agitation or retardation, and an altered sleep-wake cycle. The test may take up to 5-10 minutes to complete. Participants were deemed CAM-positive if they fulfilled the diagnostic algorithm highlighting an acute or fluctuating course, inattention, disorganized thinking, or altered level of consciousness. A systematic review conducted by Wei et al of seven papers (n = 1071 patients) reported a combined sensitivity rate of 94% and specificity of 89%. The interrater reliability was moderate to high (kappa 0.7-1.0). 11
Richmond agitation and sedation scale (RASS)
The RASS was developed in 2001 with the combined expertise of physicians, nursing staff, and pharmacists at Virginia Commonwealth University, Richmond. It aims to clearly stratify patients’ consciousness levels according to their characteristics to optimize management and medication use. 12 It consists of a 10-point scale, which is administered at the patient’s bedside and completed within a minute with a normal baseline denoting a calm and alert state (0). A patient who is alert but not calm falls between +1 and +4 (+1 = restless, +2 = agitated, +3 = very agitated, and +4 = combative). A patient who is not alert on assessment falls between −1 to −4 (−1 = drowsy, −2 = light sedation, −3 = moderate sedation, −4 = deep sedation) based on response to verbal or physical stimuli. When no response is observed, the patient is scored as −5 (unarousable/comatose). Sensitivity and specificity are approximately 82%–84% and 85.1%–87.6%, respectively, if a RASS other than zero is taken when applied in the elderly population. 13
Barthel’s index (BI)
BI was introduced in 1965 by Mahoney and Barthel as a tool to measure the extent of independent function and mobility in activities of daily living (ADL). It was further refined in 1979 and 1989 to its current format. It uses an ordinal scale with ten variables describing ADL and mobility. The test can be completed within five minutes and scores for each variable range from zero to 15, with a total score of 100. A higher number reflects a greater ability to function independently, with a full score of 100 indicating independence from others. A score of 91-99 suggests slight dependence, 61-90, moderate dependence, 21-60 severe dependence, and 0-20 total dependence. 14 The scale has been validated with good interrater reliability (kappa 0.93). 15
Statistical analysis
Data entry and analysis were performed using IBM SPSS Version 26.95% confidence intervals were reported where applicable, with the significance threshold set at P-value <0.05. Categorical variables such as age, sex, ethnicity, number of comorbidities by group, CAM score, RASS score, BI, and hospitalization outcomes are presented as frequencies and percentages. Normality was tested using skewness and kurtosis for all continuous variables (age, total duration of hospitalization, and number of comorbidities). Mean and standard deviation (SD) were used to define normally distributed continuous variables; however, non-parametric analysis was selected when the data were not normally distributed. The non-parametric Mann-Whitney U test and Kruskal–Wallis H test were used to compare qualitative variables. Spearman’s correlation was used to analyze the relationship between individual risk factors and EEG abnormalities among the study participants. The EEG abnormalities of each study participant were categorized as normal or abnormal. Finally, we used binary logistic regression analysis to determine the predictors of EEG abnormalities and ensured that the models adequately fit the data using Hosmer-Lemeshow goodness-of-fit tests.
Results
Sociodemographic characteristics
Sociodemographic characteristics, delirium assessment tools with EEG abnormalities and clinical outcome.

IQR - Interquartile Range.
EEG characteristics and changes
Characteristics of EEG abnormalities.

Specific EEG abnormalities compared with sociodemographic features and assessment tool.

Associations between risk factors and EEG abnormalities
Associations between sociodemographic, hospitalization length and outcome and assessment tools with presence of EEG abnormalities.

P-value significant at <0.05.
U – Mann-Whitney test.
Z – Z value.
H – Kruskal Wallis test.
df – degree of freedom.
Correlation between risk factors and EEG abnormalities
Relationship between EEG abnormalities and its risk factors
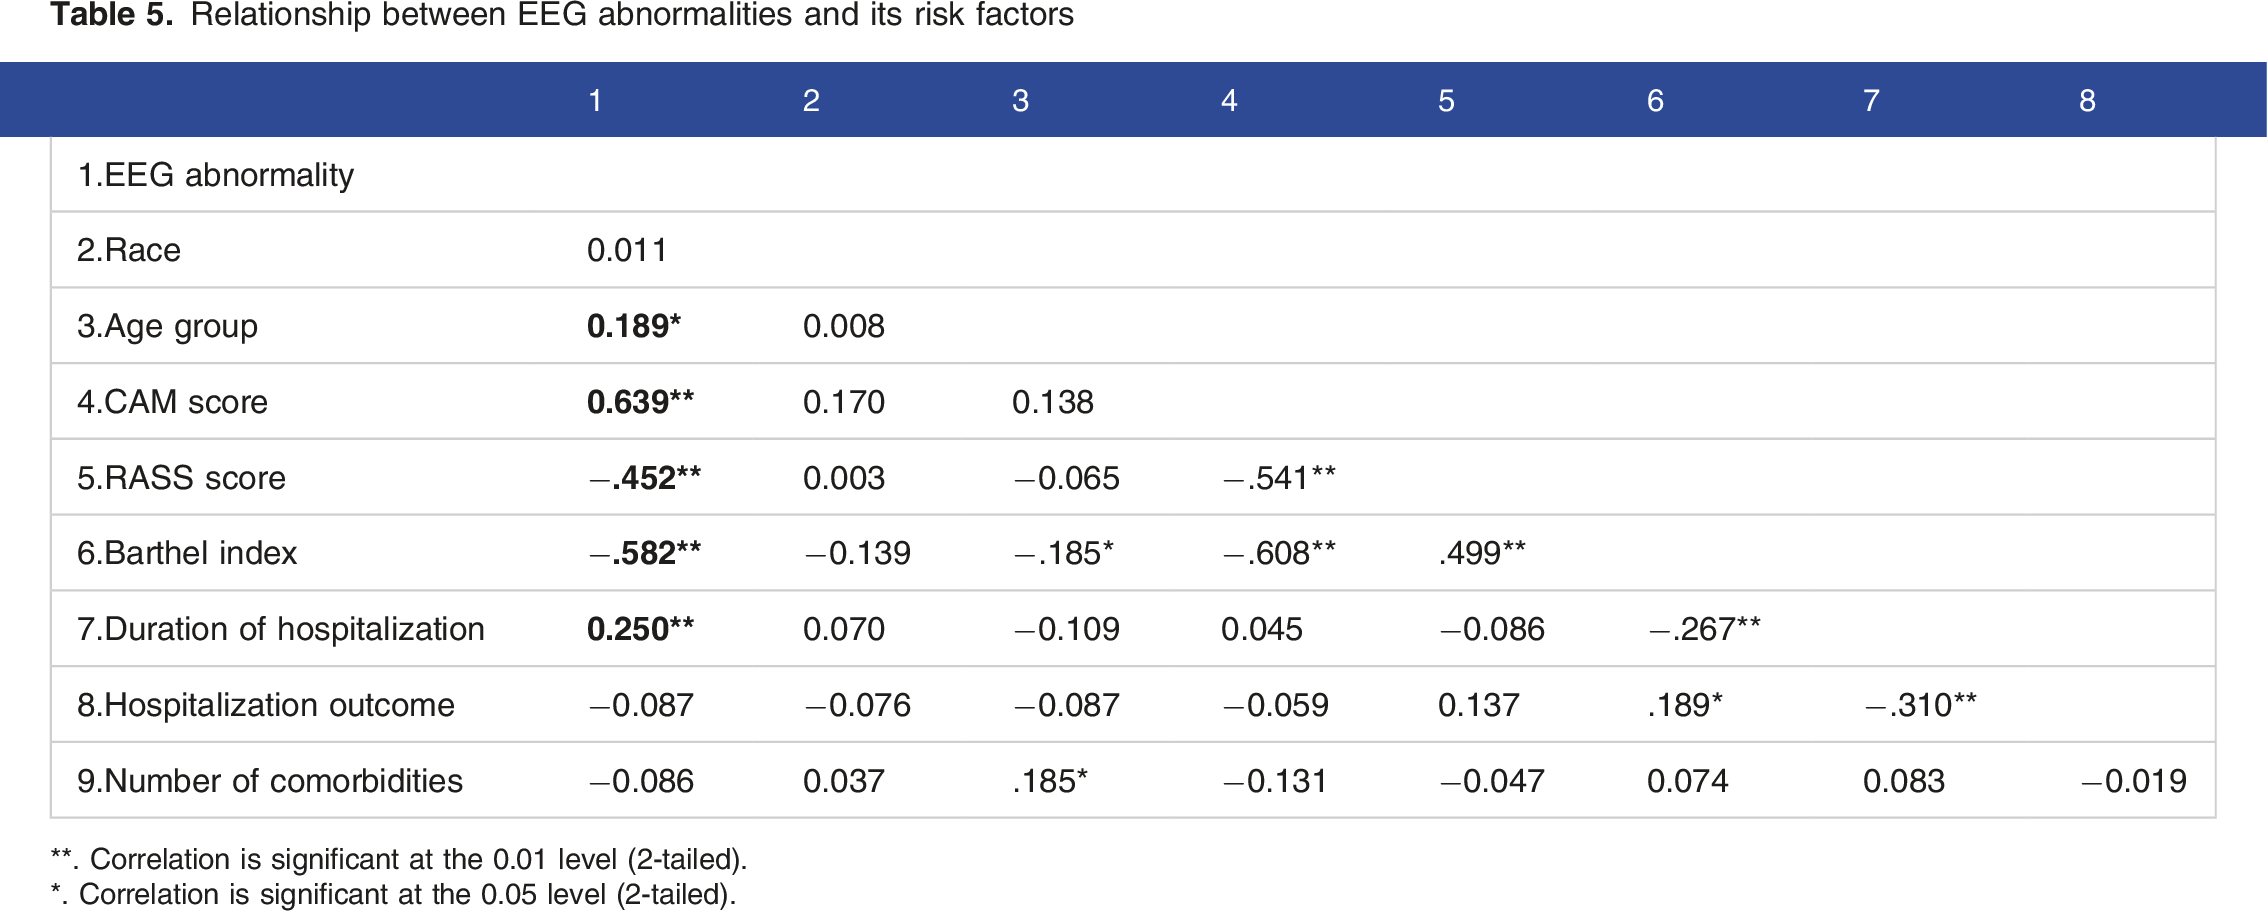
**. Correlation is significant at the 0.01 level (2-tailed).
*. Correlation is significant at the 0.05 level (2-tailed).
Predictors of EEG abnormalities
Predictors of EEG abnormalities in delirium.

P-value significant at <0.05.
df- degree of freedom.
SE − standard error.
CI- Confidence interval.
Discussion
From our data, 96 (80.0%) of the 120 participants with symptoms or signs of delirium had EEG abnormalities. Commonly observed abnormalities included generalized slowing, ranging from mild to severe, mainly comprising theta rhythm. Significant associations were observed between participant age, CAM-defined delirium positivity, consciousness level, ADL dependency, and overall clinical outcome. Subsequent analysis with binary logistic regression revealed that the predictive factors for EEG abnormalities included older age, CAM-defined delirium, and prolonged hospitalization.
A systematic review concluded that EEG slowing and reduced functional connectivity are apparent during delirium episodes. 9 The presence of theta and delta activity was the main change in delirium, consistent with a study by Kimchi et al, who reported that generalized slowing on routine clinical EEG strongly correlates with delirium. 10 Qualitative EEG abnormalities during delirium include relative slowing of resting-state EEG rhythms, abnormally decreased background alpha power, and increased theta- and delta-frequency activity. 16 Quantitative EEG abnormalities, including increased spectral variability, decreased complexity of EEG activity, and decreased EEG connectivity in the alpha band have also been reported during delirium. 17
Our study revealed a significant association between participants’ age and the likelihood of EEG abnormalities (P = 0.039). Individuals aged 45 and 75 years exhibited the highest frequency of these changes. Those aged 65-75 years accounted for more than 67% of this group, and more than half of them demonstrated EEG abnormalities. Participants over 75 years of age had the highest incidence of EEG abnormalities at 88.2%. Theta wave changes were more prevalent in individuals aged 45-75 years followed by those with normal waveforms. In contrast, those aged > 75 years showed more theta wave abnormalities than delta- or slow-wave abnormalities.
This finding is consistent with previous research that documented a slowing of the background alpha rhythm in patients in their seventies, even in the absence of organic brain disorders. This may not be unusual, as previous findings have shown slowing of the background alpha rhythm, particularly for those in their seventies even without evidence of organic brain disorders. 18 The degree of slowing was mainly mild-to-moderate and commonly involved the frontal, temporal, and occipital regions. Several studies have demonstrated similar associations between delirium and abnormal EEG findings. Meyer et al. reported an increased incidence of delirium during in-hospital care among elderly patients with EEG abnormalities (9.6% vs 3.6%). 19
A strong correlation was observed between CAM score and abnormal EEG [r (120) 0.639, P < 0.001]. CAM is an essential, sensitive, rapid, and straightforward assessment of delirium in high-risk settings and is available in over ten languages, including a Malay validated version. 20 However, interpretation of CAM results may vary among raters in the assessment of delirium. Bedside evaluations are required for components such as inattention, disorganized thinking, and level of consciousness, which may vary among raters. 21 Instead, the CAM score could be integrated with the EEG assessment to improve the assessment of clinical outcome and severity of symptoms in delirium or in comatose patients. The Visual EEG Confusion Assessment Method Severity (VE-CAM-S) and EEG Confusion Assessment Method Severity Score (E-CAM-S) are examples of grading scales used to measure symptom severity in patients with encephalopathy.22,23 Severe manifestations of encephalopathy, including low voltage, burst suppression, delta brushes, and generalized non-convulsive status epilepticus, are associated with poor clinical outcomes.
In addition, the RASS score was significantly associated with EEG abnormalities (P < 0.001). Further analysis shows that the RASS score is moderately and negatively linked to EEG abnormalities, with a correlation coefficient of r (120) −0.452 and a P-value of less than 0.001. Similar findings have been reported in other studies, in which more patients with delirium had lower RASS scores. 22 Conversely, in contrast to our findings, the prevalence of electroencephalogram (EEG) slowing in hypoactive individuals (RASS score ranging from −3 to −1) was comparable to that in hyperactive patients (RASS score ranging from +1 to +4)10. However, it is uncertain whether EEG slowing indicates hypoactive delirium alone or includes patients with normal arousal or hyperactive manifestations.
In addition to the delirium assessment tool, the BI was used to measure the participants’ functional status. The BI was significantly associated with EEG abnormalities (P < 0.001). Specifically, patients who were fully dependent on others in their daily activities were more likely to exhibit abnormal EEG results, with approximately 70% of them displaying abnormalities. Moreover, we noted a moderately negative correlation between the BI and EEG abnormalities. The correlation coefficient was r (120) −0.582, and the P-value was less than 0.001, indicating that less dependent patients were less likely to experience changes in their EEG readings. Yuasa et al. demonstrated significant positive correlations between the alpha (2) band and ADL scores, including the BI, among stroke survivors. 24 In another study, ADL dependency was identified as a risk factor for delirium with an adjusted odds ratio of 3.92 (95% CI 1.52-10.11, P < 0.01). 25
In addition, our study examined several risk factors, including the duration of hospitalization. The median hospitalization duration was 11.5 days, with an IQR of 18. Although the relationship observed in this group was weak [r (120) 0.250], it was statistically significant (P = 0.006). We found that hospitalization duration was strongly associated with EEG abnormalities, which were recognized as one of the many predictors of such changes (Wald = 4.706, P = 0.030 [<0.05]). Shinozaki et al. reported the role of bispectral EEG in delirium and made a similar observation. The length of inpatients’ stay was significantly associated (P = 0.0014, adjusted) with a higher EEG score based on power spectral density analysis, representing an increase in the duration of hospitalization. 26 Additionally, a higher score was associated with poorer clinical outcomes and death (P = 0.0090), which was also observed in another study conducted at the same institution. 27
Although EEG may play a significant role as an adjunct to diagnosing delirium by virtue of the observed abnormalities, such as generalized slowing, it may not be feasible to perform EEG in every patient suspected of having delirium. Bedside assessments, such as CAM and RASS scores, may take up to ten minutes, but the application of EEG leads and subsequent recordings may require at least 20-30 minutes. In addition, aside from tertiary centers, the availability and expertise required to perform EEGs are limited. In capable centers, we recommend EEG if the CAM score is negative or if the RASS score is −1 to +1, but there is a clinical suggestion of delirium. Although it may be time-consuming and labor-intensive, the poor clinical outcomes of patients with delirium highlight the importance of its identification.
Limitation
This study was limited by the variability in the timing of performing EEG during hospitalization, as we relied on cases that were referred to us with features suggesting delirium. In addition, we did not perform serial monitoring of the continuous EEG, which could reveal evolving changes in brain dysfunction. Brain imaging was not performed in some participants, which may have overlooked pre-existing neurological illnesses, such as stroke. Preferably, it would be ideal to have two separate assessors to perform the assessment scorings to avoid bias but due to staffing issues, we could only manage a single rater consistently. Besides that, prior to the commencement of the study, the sample size was not calculated due to the lack of regional data on the prevalence of EEG abnormalities in patients with delirium. We recruited all eligible patients referred to our team within the study period.
Conclusion
Our study conclusively showed that a significant proportion of patients experiencing delirium exhibited EEG abnormalities, namely, generalized slowing. Older age and positivity for CAM-defined delirium were also predictive factors for EEG abnormalities. In addition, the presence of EEG abnormalities suggests poor clinical outcomes and may aid in determining patient prognosis. Overall, using EEG in delirium assessment provides a more objective and reliable approach to diagnosis, enabling timely intervention.
Footnotes
Acknowledgements
The authors would like to thank the Dean and Faculty of Medicine, Universiti Kebangsaan Malaysia for their unwavering support, the neurology laboratory and clinic staff members, and all patients and family members who agreed to participate in this study.
Author contributions
NSMF contributed to the formulation of the study, study design, screening of patients, data collection, data analysis and manuscript writing. TJK contributed to the study design, data analysis and was a major contributor in manuscript writing. MMT contributed to the study design, data analysis and was a major contributor in manuscript writing. KCS contributed to the formulation of the study, screening of patients, data collection, data analysis, and article review. RH contributed to the formulation of the study, methodology, data analysis, and article review. SZS contributed to the methodology, screening of patients, data collection, provided her expertise in EEG, and article review. NZ contributed to the methodology, screening of patients, data collection, provided her expertise in EEG, and article review. THJ contributed to the idea and formulation of the study, study design, screening of patients, data collection, data analysis, manuscript writing and article review. All authors read and approved the final manuscript.
Declaration of conflicting interests
The author(s) declared no potential conflicts of interest with respect to the research, authorship, and/or publication of this article.
Funding
The author(s) disclosed receipt of the following financial support for the research, authorship, and/or publication of this article: This study was funded by the National University of Malaysia under the research grant FF-2021-161.
Submission declaration
The authors declare that the submission has not been published previously and is not under consideration for publication in any other journal.
Ethical statement
Data availability statement
The raw data collected for this study were saved in SPSS format and may be requested for use by contacting the corresponding author.