
Abstract
Background
Multiple sclerosis (MS) lesions typically form around a central vein that can be visualized with FLAIR* MRI, creating the central vein sign (CVS) which may reflect lesion pathophysiology. Herein we used gradient echo plural contrast imaging (GEPCI) MRI to simultaneously visualize CVS and measure tissue damage in MS lesions. We examined CVS in relation to tissue integrity in white matter (WM) lesions and among MS subtypes.
Objective
We aimed to determine if CVS positive lesions were specific to MS subtype, if CVS can be detected consistently among readers using the GEPCI method, and if there were differences in tissue damage in lesions with vs without CVS.
Subjects and Methods
Thirty relapsing-remitting MS (RRMS) subjects and 38 primary and secondary progressive MS (PMS) subjects were scanned with GEPCI protocol at 3T. GEPCI T2*-SWI images were generated to visualize CVS. Two investigators independently evaluated WM lesions for CVS and measured lesion volumes. To estimate tissue damage severity, total lesion volume, and mean lesion volume, R2t*-based tissue damage score (TDS) of individual lesions and tissue damage load (TDL) were measured for CVS+, CVS-, and confluent lesions. Spearman correlations were made between MRI and clinical data. One-way ANCOVA with age and sex as covariates was used to compare measurements of CVS+ vs CVS- lesions in each individual.
Results
398 of 548 lesions meeting inclusion criteria showed CVS. Most patients had ≥40% CVS+ lesions. CVS+ lesions were present in similar proportion among MS subtypes. Interobserver agreement was high for CVS detection. CVS+ and confluent lesions had higher average and total volumes vs CVS- lesions. CVS+ and confluent lesions had more tissue damage than CVS- lesions based on TDL and mean TDS.
Conclusion
CVS occurred in RRMS and PMS in similar proportions. CVS+ lesions had greater tissue damage and larger size than CVS- lesions.
Keywords
Introduction
Multiple sclerosis (MS) is a common inflammatory neurologic disease that affects at least 620,000 individuals in the United States alone. 1 Worldwide estimates of disease prevalence approach 2.5 million. 2 Non-invasive imaging techniques are useful tools to help elucidate underlying pathology of diseases of the central nervous system (CNS). Magnetic resonance imaging (MRI) is integral to MS diagnosis and has provided valuable insights into disease pathology and evolution. Advancements in quantitative MRI imaging have elucidated a more detailed picture of MS lesions compared to standard clinical imaging. Furthermore, the development of novel imaging techniques and better measurements of tissue integrity may help to improve our understanding of the relationship between clinical disability and lesion burden, 3 as well as distinguish MS from other diseases.
MS lesions, especially those in the white matter (WM), typically form around a central vein. 4 The perivenular area contains antigen presenting cells that can activate cells of the adaptive immune system, with subsequent lesion formation. 5 This lesion topography creates the central vein sign (CVS) on MRI. 6 Ultra high field MRI and post-processing techniques that capture the relationship between venous structures and T2-weighted hyperintensities can help to differentiate MS from diseases with similar appearing lesions. 7 It has been proposed that having more than 40% lesions with CVS or three or more lesions with CVS is specific for MS. 8 Other studies have proposed varying CVS thresholds and absolute lesion number, with similar degrees of specificity.7,9 Advanced post-processing techniques, such as T2* and FLAIR*, improve discernment of CVS.10-12
In this study, we used a gradient echo plural contrast imaging (GEPCI) technique that is based on a multi-echo gradient echo MR sequence and post-processing algorithms, to generate images and quantitative maps with different biological contrasts.13,14 The GEPCI technique has been applied to quantify tissue damage and visualize CVS in MS. Our data showed that GEPCI metrics correlated significantly with MS patients’ clinical scores and differentiated different MS subtypes.13-18
Making use of recently developed post-processing algorithms,19,20 we also generated quantitative tissue-specific R2t* maps (t represents “tissue cellular” specific component of R2*) allowing the estimation of CNS tissue damage due to MS16-18 and examined relationships of lesions with and without CVS to the underlying tissue damage based on R2t*, and to MS subtype and disability measurements. We hypothesized that lesions with CVS would reflect regions with enhanced underlying adaptive immune responses and greater tissue damage than those without CVS.
Materials and Methods
Study Design
This was a single-center cross-sectional study to compare the presence of CVS in people with RRMS and non-relapsing PMS, to assess tissue damage in lesions with and without CVS using R2t* as an estimate of underlying tissue integrity, and to determine correlations of CVS burden with clinical disability.
Subjects
Sixty-eight subjects (30 relapsing and 38 progressive) ≥ 18 years of age diagnosed with relapsing-remitting, primary progressive, or secondary progressive MS and able to provide written informed consent were included. Clinical subtypes were assigned by clinicians prior to the study and in advance of imaging, based on neurological assessment and disease course. RRMS and PMS subjects were recruited to be of similar ages, to remove the confounder of age when comparing clinical subtypes. PMS subjects were required to be progressing in absence of inflammatory disease activity. RRMS subjects had no progression unless directly related to MS attacks. The presence of hypertension and hyperlipidemia was also noted.
Patients were treated with interferon (n = 18), glatiramer acetate (n = 6), dimethyl fumarate (n = 10), methotrexate (n = 2), fingolimod (n = 4), natalizumab (n = 3), teriflunomide (n = 6), ocrelizumab (n = 2), rituximab (n = 4), none (n = 12), and study drug (n = 1).
MRI Protocol and Post-Processing
Magnetic resonance data were acquired on a 3T Trio MRI scanner (Siemens, Erlangen, Germany) using a 32-channel phased-array head RF coil. GEPCI data were acquired using three-dimensional multi-gradient echo sequence with flip angle 30°, TR = 50 ms, voxel size 1×1×2 mm3, and acquisition time 12 minutes. Ten gradient echoes, with first echo time TE1 = 4 ms and echo spacing ΔTE = 4 ms were collected. Effects of physiological fluctuations were also mitigated using previously developed technique. 21 Fluid-attenuated inversion recovery (FLAIR) images (voxel size 1×1×3 mm3) were also acquired. Procedures of image reconstruction and generating T2*-SWI and R2t* images were described previously.13,19 T2*-SWI images, which combine GEPCI susceptibility weighted imaging (SWI) with T2* (T2* = 1/R2*) maps, were used to visualize venous structures within T2* hyperintensities. Because images with different contrasts obtained using GEPCI are naturally co-registered, T2*-SWI images are especially useful for localizing central veins within MS lesions. The tissue cellular specific component R2t* was separated from total R2* by removing the contribution of blood oxygen level-dependent effects. 19 Both R2* and R2t* maps were generated accounting for adverse effects of magnetic field inhomogeneities using voxel spread function approach. 22 T2*-SWI images were reconstructed into 0.5 x 0.5 x 1 mm3 for visualizing lesions with CVS. Image reconstruction and post-processing of GEPCI data were performed using a standard PC computer and Matlab software (Math-Works Inc). For each subject, total lesion volume, mean lesion volume, tissue damage load (TDL), and mean tissue damage score (TDS) were measured for lesions with CVS (CVS+), lesions without CVS (CVS-), and confluent lesions. Lesion volumes of CVS+ lesions were measured by summing the volumes of all CVS+ lesions in a subject. Mean lesion volume in CVS+ lesions were calculated as lesion volume of CVS+ lesions divided by number of CVS+ lesions in a subject. Total lesion volume and mean lesion volume of CVS- and confluent lesions were calculated in the same way as CVS+ lesions. Mean TDS of CVS+/- lesions were defined as: R2t* NAWM − R2t*CVS+/-MeanTDSCVS+/- = R2t* NAWM
Where R2t* NAWM is the median value of R2t* in normal appearing white matter (NAWM) in that individual and R2t*CVS+/- is the median value of R2t* in CVS+/- lesions. The center voxel, corresponding to the vein, was excluded while computing R2t*CVS+. Exclusion of center voxels and using median values minimized the effect of venous structures on R2t*CVS+ calculation. Higher mean TDS reflects more severe tissue damage. Tissue damage load (TDL) in CVS+/- lesions was defined as:
TDLCVS+/- = MeanTDSCVS+/- × LesionVolumeCVS+/- Mean TDS and TDL of confluent lesions were calculated in the same way as CVS+/- lesions. Note that these measures in CVS- lesions are different from CVS+ lesions only by keeping the center voxel. Six patients did not have CVS- lesions (all lesions in these six subjects had CVS). Of these six patients, two were primary progressive MS (PPMS), three were secondary progressive MS (SPMS), and one was RRMS. Four subjects were female. The age range of the six patients was 37 to 71 years old. The range of EDSS was 4.5 to 7.5. For our analysis, the volume of CVS- lesions was assigned as 0. All patients had lesions characteristic of MS.
Central Vein Sign Detection
Dual reader evaluation of lesion volume, anatomic location, and presence or absence of CVS was recorded using imaging analysis software ITK-SNAP.
23
CVS was determined on T2*-SWI images, which inherently co-localize T2*- hyperintensities with venous structures (Figure 1). Central vein was identified using criteria previously.
8
Lesions were evaluated in three planes in T2*-SWI images. Veins were required to appear as a thin line or dot, detectable in at least two perpendicular planes, appearing as a thin line in one plane and located in the middle of the WM lesion. The diameter of the vein was less than 2 mm and crossed partly or completely through the lesions. The total number and proportion (CVS%) of lesions with CVS were calculated. Inclusion criteria for CVS were cerebral lesions in WM, including the juxtacortical regions and brainstem. Lesions were excluded if they were less than 3 mm diameter in any plane, confluent, included more than 1 vein, or difficult to decipher due to artifact.
8
Lesions were considered to be confluent when at least two spatially separate lesions, occurring near each other become a larger connected region of lesion tissue.
24
Lesions were also considered to be confluent when two or more central veins were present within the lesion.
8
Since GEPCI imaging did not cover the entire cerebellum, cerebellar lesions were excluded. Lesion location (cortical/juxtacortical, subcortical, periventricular, and brainstem) was documented. 548 WM lesions meeting inclusion criteria and 143 confluent lesions were identified by a neurologist (VAL) and assessed separately by a second experienced reader (BX) to formulate interrater reliability. In cases of disagreement (<10% of lesions), a third reader (AHC) adjudicated. T2*-SWI and FLAIR images were used to segment and quantify lesion volume. T2*-SWI images (0.5 x 0.5 x 1 mm3 resolution) of the brain of a person with RRMS demonstrate co-localization of WM lesion with central vein, highlighted in axial, coronal, and sagittal planes (A-C).
Neurological Examinations
On the day of imaging, subjects underwent the following tests: 25 foot time walk (25FTW), nine hole peg test (9HPT), 2-second Paced Auditory Serial Addition Test (PASAT-2), 3-second PASAT (PASAT-3), Symbol Digit Modality Test (SDMT, oral version), and Expanded Disability Status Score (EDSS).
Data Analysis
Clinical characteristics were compared between patients with RRMS and PMS. Chi-square analysis was used to compare frequency of male/female participants, and ANOVA was used to compare age, disease duration, EDSS, and performance on SDMT, PASAT, and MSFC. Differences in the proportion of CVS+ lesions between the RRMS and PMS subjects were evaluated using one-way ANCOVA with age and sex as covariates. Cohen’s kappa statistic was used to measure interrater reliability (κ < 0, poor agreement; 0 < κ < .2, slight agreement; .2 < κ < .4, fair agreement; .4 < κ < .6, moderate agreement; .6 < κ < .8, substantial agreement; and .8 < κ < 1, almost perfect agreement). 25 Intraclass correlation coefficient (ICC) was used for lesion volume measurement reliability. Lesion volume, TDL, and TDS were compared between CVS+, CVS-, and confluent lesions. One-way ANCOVA with age and sex as covariates were used to compare lesion volume, mean lesion volume, TDL, and mean TDS measurements of CVS+ and CVS- lesions. False discovery rate was used to adjust for multiple comparison. Spearman’s rank-order correlation was used to investigate the correlation between CVS proportion and clinical scores with age and sex as covariates.
Results
Patient Characteristics, Lesion Counts, and Lesion Distribution
Mean group differences between RRMS and PMS subjects. Subjects with RRMS and PMS were recruited to be of similar ages. Participants with PMS did worse on most tests, with significantly higher EDSS scores and lower SDMT, PASAT 2 sec, and MSFC scores than RRMS participants. CVS+ lesion total was not different between clinical subtypes. Values presented as mean ± SD, P-values: a = ANOVA, b = chi-square. *Missing values: disease duration = 2, MSFC = 2.

Distribution of lesions examined. Lesion location in relations to presence or absence of CVS and percentage of lesions with CVS were recorded. Veins were required to appear as a thin line or dot, detectable in at least two perpendicular planes, appearing as a thin line in one plane and located in the middle of the WM lesion. The diameter of the vein was less than 2 mm and crossed partly or completely through the lesions.

CVS was detected on T2*-SWI in axial, coronal and sagittal planes (Figure 1). TDS, calculated from R2t*, was used to quantify tissue damage in lesions (Figure 2). Tissue damage score was not significantly different among lesions in juxtacortical/cortical, subcortical, periventricular, or brainstem regions (supporting information, figure 1(S)). R2t* map (A) and color-coded R2t*-based tissue damage score (TDS) map superimposed on the GEPCI-T1w image (B) show two periventricular lesions of a person with PMS. TDS map shows the heterogeneity of damage in the two lesions. Gray-scale bar represents R2t* (in 1/s); color bar represents TDS (unitless parameter changes between 0 and 1). Higher TDS represents lower R2t*, indicating more severe tissue damage.
Interobserver Agreement
Two readers independently evaluated 548 WM lesions for CVS analysis, including measurement of lesion volumes and volumes of an additional 143 confluent lesions. Interrater reliability of lesion measurement was high (ICC = .99, 95% Figure 3). Cohen’s kappa for interrater reliability showed substantial agreement for CVS reading between two raters (VAL and BX) (κ = .72). The two readers had different classifications of CVS+ vs CVS- for 50 out of 548 lesions (9.1%). The third reader (AHC) adjudicated these 50 lesions. Correlation analysis of independent lesion volume (mm3) measures by two investigators, R2 = 0.96.
Lesions With CVS had Greater Volumes
CVS+ lesions had higher total volumes (Figure 4, top row) and mean volumes (Figure 4, bottom row) when compared with CVS- lesions. This was true for all subjects when combined (Figure 4, left column), and for PMS and RRMS subtypes individually (Figure 4). Confluent lesions showed significantly higher total and mean volumes than CVS- and CVS+ lesions (P < .001). One-way ANCOVA with age and sex as covariates comparing total lesion volume (A-C) and mean lesion volume (D-F) of lesions with and without CVS and confluent lesions in all subjects (n = 68) and separately in PMS and RRMS subgroups. Lesions with CVS (CVS+, green dots) had significantly higher lesion volumes compared to lesions without CVS (CVS-, red dots) in the entire MS group (p < .001) and in each subtype (p < .001) (A-C). Lesions with CVS had significantly higher mean lesion volumes compared to lesions without CVS in the entire MS group (p < .001) (D), PMS (p < .001) (E) and RRMS (p < .01) (F). Note: if a patient did not have CVS- lesions (n = 6), the CVS- lesion volume was assigned as 0. The lines connecting each dot represent data from the same subject. *** p < .001, ** p < .01, * p < .05. All listed p values are after multiple comparison correction using false discovery rate.
R2t*-Based Damage Estimates Were Greater in CVS+ Lesions
R2t* was used to estimate tissue integrity. CVS+ lesions had significantly more tissue damage, as measured by R2t*-based tissue damage load (TDL) and mean tissue damage score (TDS), compared with CVS- lesions (Figure 5). CVS+ and confluent lesions showed higher TDL and mean TDS than CVS- lesions (P < .01). No significant difference in mean TDS was found between CVS+ lesions and confluent lesions. CVS+ lesions showed significantly higher lesion volume, tissue damage score, and tissue damage load than CVS- lesions in juxtacortical/cortical and subcortical regions (Supporting information Figure 2(S)). One-way ANCOVA with age and sex as covariates comparing tissue damage load (TDL) (A-C) and mean tissue damage score (TDS) (D-F) of lesions with and without CVS and confluent lesions in all subjects (n = 68), PMS, and RRMS patients. Lesions with CVS (green dots) and confluent lesions (blue dots) had significantly higher TDL and mean TDS compared to lesions without CVS (red dots) in the MS group (p < .01) (A, D) and the RRMS subtype (p < .01) (C, F). Note: if a patient did not have CVS- lesions (n = 6), the CVS- lesion volume was assigned as 0. The lines connecting each dot represent data from the same subject. *** p < .001, ** p < .01, * p < .05, n.s. p ≥ .05. All listed p values are after multiple comparison correction using false discovery rate.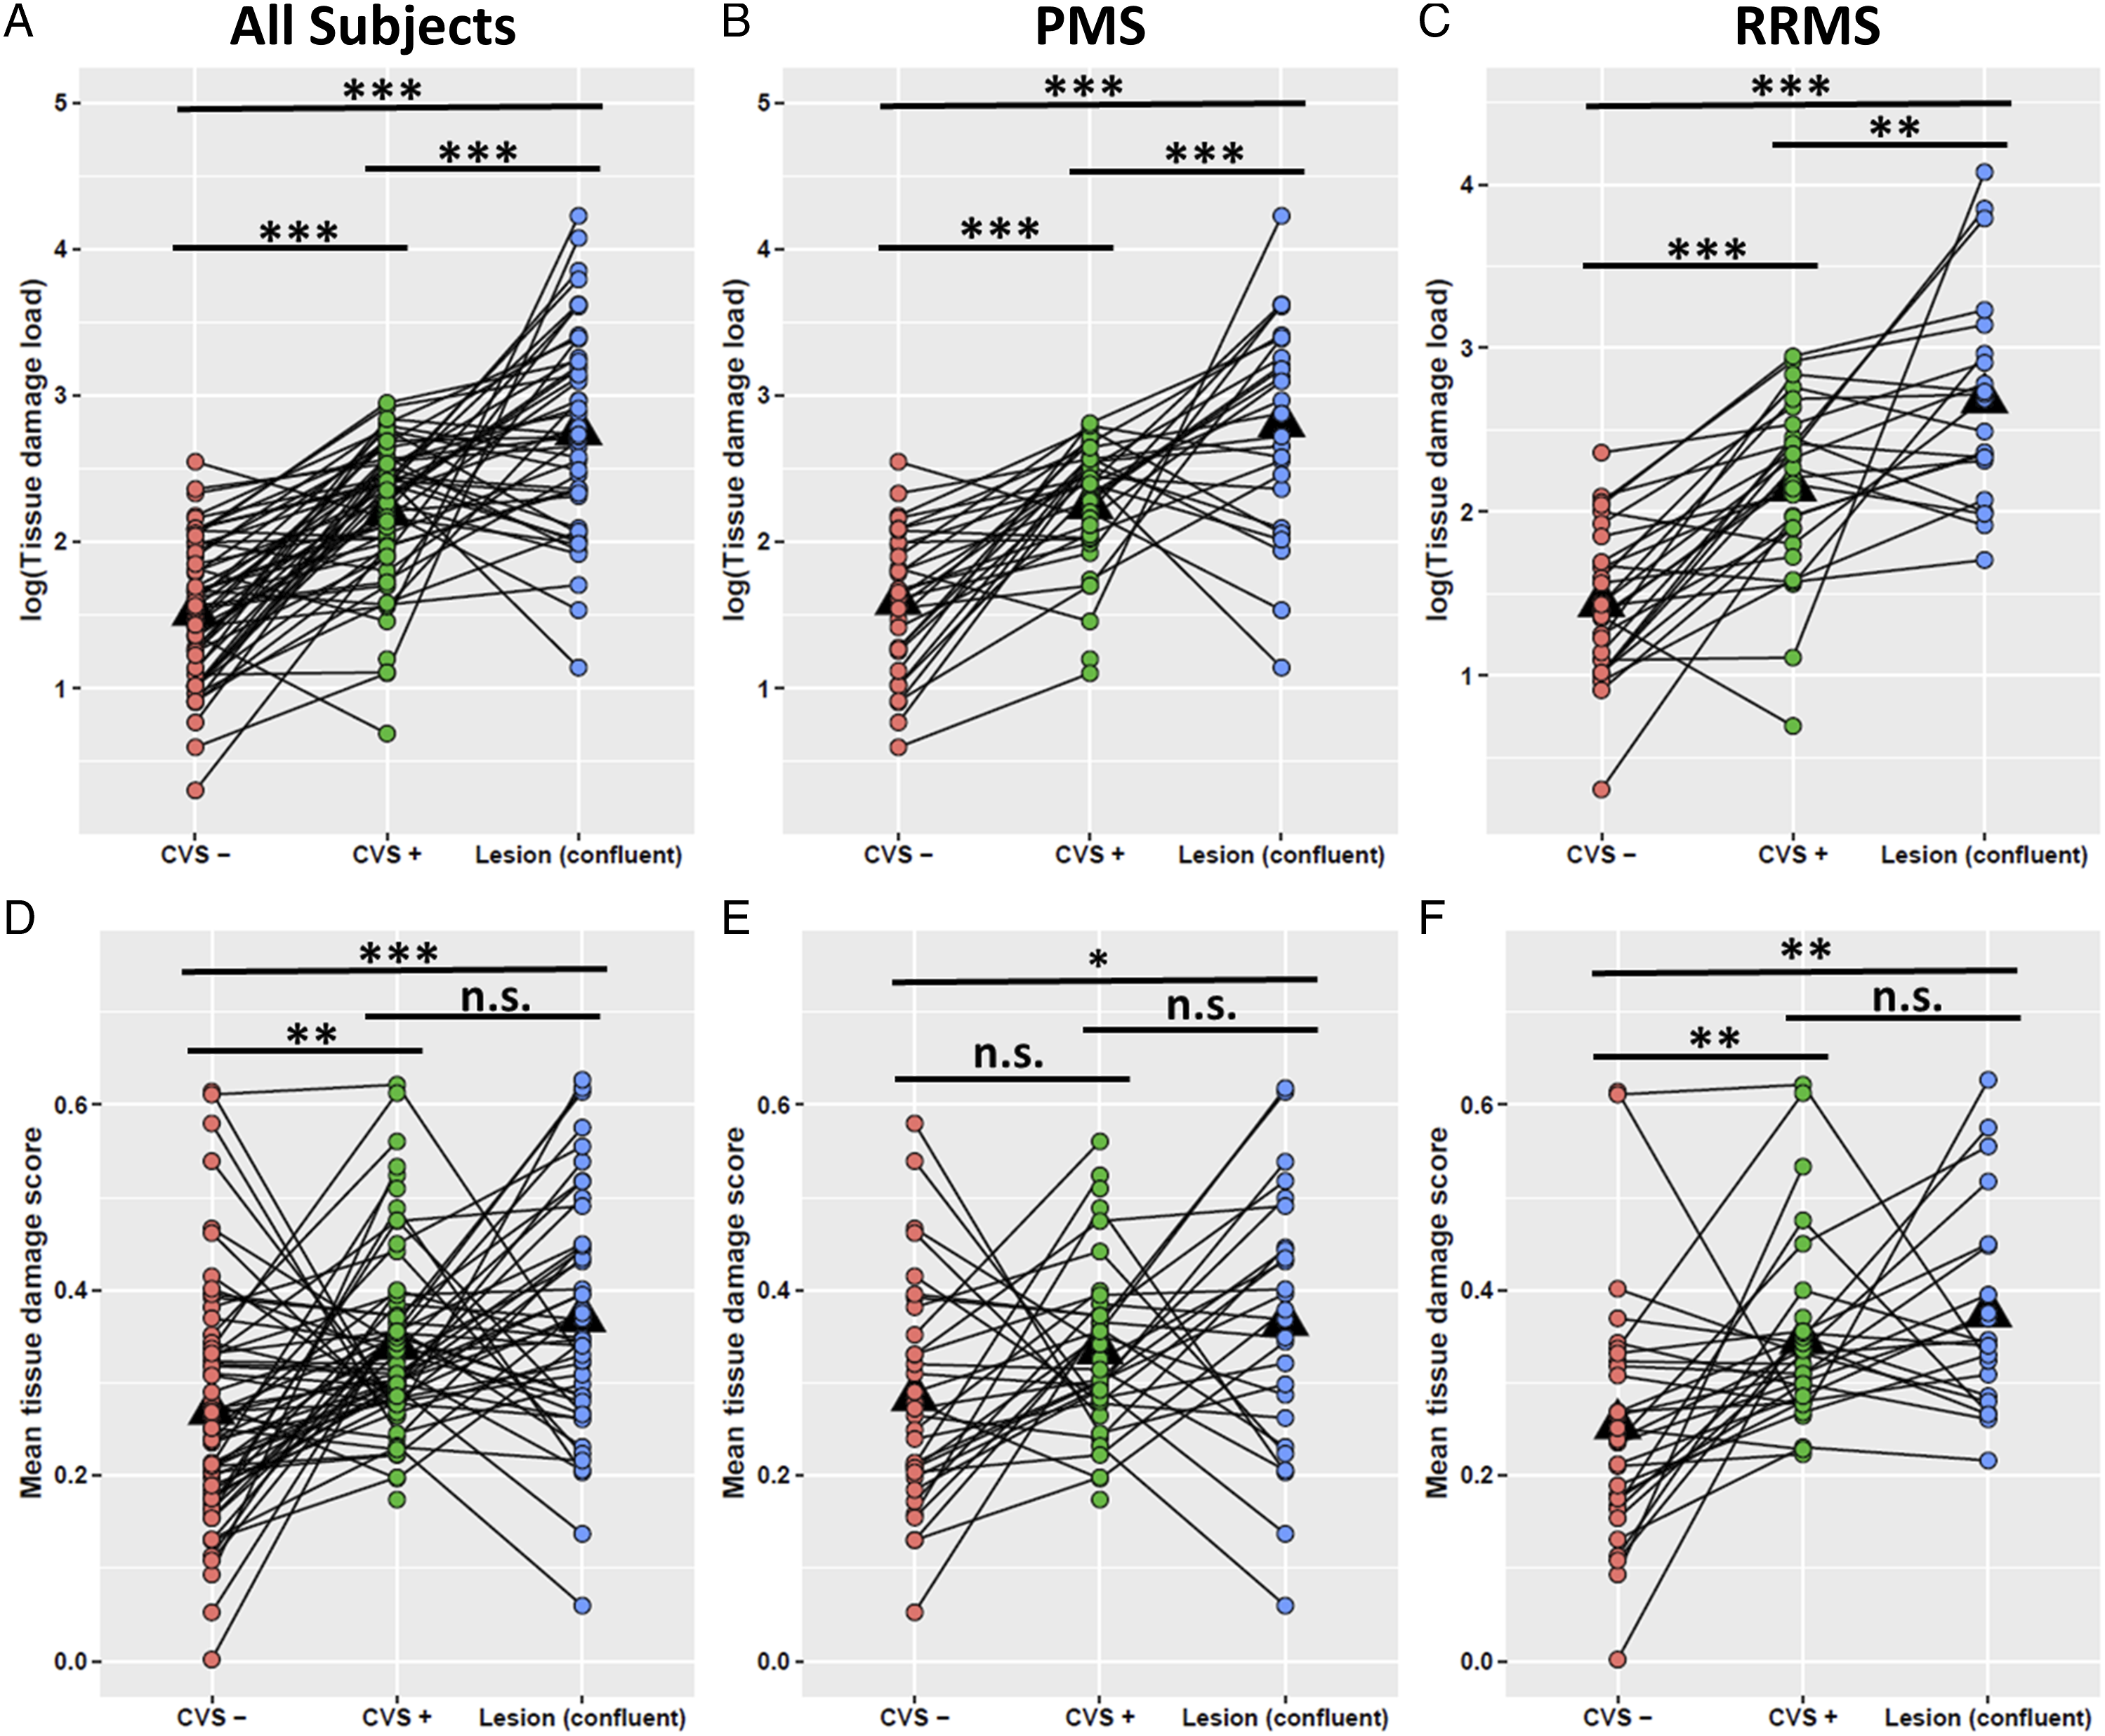
PMS and RRMS cohorts showed similar level of WM lesion load (Supporting information Figure 3(S)).
Significant Correlations Between CVS+ Lesion Proportion and Clinical Scores
Correlations between percentage of CVS+ lesions and clinical scores were investigated. After FDR was applied, the percentage of WM lesions with CVS showed significant correlation with EDSS (r = .37, P = 1.1 x 10⁻⁵), 25-foot-walk (r = .29, P = .00075), and 9-hole-peg test (r = .26, P = .0025).
No Significant Difference in Lesion Counts or Proportion of CVS+ Lesions Between RRMS and PMS Subgroups
Average CVS+ counts were not significantly different between subtypes with RRMS having 8.7 and ±5.2 and PMS with 8.3 ± 4.6 (P = .74). One-way ANCOVA with age and sex as covariates showed no significant difference of CVS% between MS subtypes, although PMS subjects trended toward greater proportion of CVS+ lesions vs RRMS subjects with median CVS% for PMS of .80 ± .20 and for RRMS of .67 ± .16 (P = .085) (Figure 6). Distribution of proportion of lesions with CVS by MS subtype. There was no significant difference of CVS% between MS subtypes (p = .085). Boxes represent the interquartile ranges; the horizontal lines within the boxes indicate median values.
Relationship Between Hypertension, Hyperlipidemia, and CVS Proportion
White matter hyperintensities are frequently noted on T2w brain images of people with vascular disease. Thus, we compared CVS proportion in subjects with and without hypertension and with and without hyperlipidemia but found no significant differences. Data showed a small but insignificant (P = .066) trend toward people with hypertension having larger proportion of lesions with CVS.
Discussion
In this study, we examined the proportion of lesions with CVS among 68 people with MS, including age-matched relapsing-remitting and progressive MS subtypes. Cohen’s kappa showed substantial interrater agreement in this study, similar to previous studies. 10 The purpose of our study was to examine associations of underlying tissue integrity in lesions with the presence of CVS, to identify any differences in the CVS+ lesion proportions between relapsing and progressive MS subtypes, and to determine if presence or proportion of lesions with CVS correlated with clinical disability measurements.
High rates of MS misdiagnoses have been reported28,29 and thus the use of CVS to improve diagnostic specificity has become increasingly important. Our results demonstrated that T2*-SWI GEPCI based images provide a reliable method for CVS detection. Importantly, GEPCI allows not only detection of CVS but also the generation of R2t* maps from the same data to provide a quantitative estimate of tissue damage. Out data show that CVS+ lesions detected by T2*-SWI tended to be larger and had worse underlying tissue damage based on R2t* than CVS- lesions.
Herein, tissue damage was measured by the GEPCI quantitative tissue-specific R2t* metric, reduction of which has been associated with tissue damage pathologically.16,17,30 A previous study from our group showed that R2t* positively correlated with neuronal density in healthy human cerebral cortex. 30 Decreased R2t* detects limbic system abnormalities in MS not associated with atrophy. 18 In addition, R2t* normalization paralleled clinical improvement in a patient with biopsy confirmed demyelinating white matter pathology over 14 months, 17 suggesting that in white matter it may reflex demyelination. These relationships support the biological relevance of R2t* as an imaging biomarker. The current results imply that lesions with a central vein have worse underlying tissue damage than those lacking a demonstrable central vein, suggesting the possibility of different pathophysiology between CVS+ and CVS- lesions.
The higher TDS in CVS+ than CVS- lesions is unlikely to be due to different prevalence of their topographic distribution (e.g., CVS+ lesions have been demonstrated to be more frequent in periventricular WM), since CVS+ lesions in different regions showed similar TDS
It has been hypothesized that CVS- lesions may represent non-demyelinating pathology, including being due to other factors such as vascular disease. A prior study reported that the proportion of CVS+ lesions was significantly decreased in MS patients with hypertension. 32 Clinical evaluation of patients with non-specific white matter lesions who have comorbid cerebrovascular disease is not straightforward. It is often difficult to distinguish extensive periventricular white matter changes secondary to demyelination from sequelae of vascular disease. 33 Results from the current study did not show increased CVS- lesion prevalence in those with vascular risk factors.
We found no significant differences in the presence and proportions of lesions with CVS in relapsing vs progressive MS subtypes, in accord with previous studies.6,34 These findings are consistent with the CVS reflecting a common lesion pathogenesis among MS subtypes. 34 Of note, PMS subjects trended toward a greater proportion of CVS+ lesions vs RRMS subjects.
Significant correlations between percentage of CVS and clinical disability were found. One previous report showed a relationship between CVS and PASAT (3 sec) and California Verbal Learning Test. 26 This finding supports the present finding of worse underlying tissue damage in CVS+ lesions. Application of CVS status as an imaging biomarker of MS disease severity should be further investigated, including in longitudinal studies.
Limitations
Although this study was limited by a small sample size (n = 68), the number of lesions studied herein was close to 700. For this study, we specifically age-matched the RRMS cohort to the PMS cohort as an attempt to remove age differences as a confounder when comparing PMS to RRMS subjects. Thus, the RRMS subjects are older with a long disease duration than RRMS subjects in most other CVS studies. Our findings may serve to expand the usefulness of the CVS into older RRMS patients. We found that this older MS population displayed a similar high proportion of lesions with central veins to younger MS patients reported in the literature. 8 The present data indicate that the applicability of CVS to aid MS diagnosis is not limited by patient age.
This study may have been underpowered to show increased CVS- lesion in patients with vascular comorbidities. Future studies should be performed to further elucidate the relationship of MS lesions with and without CVS to vascular risk factors and to disability measures.
CVS+ lesions were found to be larger than CVS- lesions in this study, raising the possibility that venules within small MS lesions may have been missed due to insufficient image resolution. Image resolution at 3T limited our ability to differentiate cortical lesions and visualize brainstem structures for analysis. However, even studies at 7T showed that some MS lesions lack CVS. 35
This study did not fully evaluate the relationship between tissue damage of different types of lesions and the spatial distribution of these lesions. More studies are warranted to investigate this issue in the future.
Conclusions
Here we have described a technique incorporating a quantitative T2* mapping for CVS detection in brain lesions with simultaneous evaluation of tissue damage in CVS-associated lesions. Importantly, this study also found that CVS+ lesions are associated with more underlying tissue damage and with more MS-specific disability. The present study suggests that lesions without CVS may be fundamentally different than lesions with CVS, and that CVS- lesions contribute less to MS-specific disability. In future studies, we will explore the longitudinal relationship between CVS, R2t*, and clinical disability, which may help address this question.
Supplemental Material
sj-pdf-1-cns-10.1177_11795735221084842 – Supplemental Material for Stronger Microstructural Damage Revealed in Multiple Sclerosis Lesions With Central Vein Sign by Quantitative Gradient Echo MRI
Supplemental Material, sj-pdf-1-cns-10.1177_11795735221084842 for Stronger Microstructural Damage Revealed in Multiple Sclerosis Lesions With Central Vein Sign by Quantitative Gradient Echo MRI by Victoria A. Levasseur, Biao Xiang, Amber Salter, Dmitriy A. Yablonskiy and Anne H. Cross in Journal of Central Nervous System Disease
Footnotes
Author Contributions
Victoria A. Levasseur: Concept and design, leading role in writing of the manuscript, data collection, data analysis/interpretation, and leading role in review of literature. Biao Xiang: Concept and design, writing of the manuscript, leading role in data analysis and interpretation, and review of literature. Amber Salter: Supporting role in reviewing and editing the manuscript and supporting role in data analysis/interpretation. Anne H. Cross: Study supervision, concept and design, writing of the manuscript, funding acquisition, and data interpretation. Dmitriy Yablonskiy: Study supervision, concept and design, writing of the manuscript, funding acquisition, and data interpretation.
Declaration of Competing Interests:
Victoria A. Levasseur has nothing to disclose in relation to this study. Biao Xiang has nothing to disclose in relation to this study. Amber Salter has nothing to disclose in relation to this study. Dmitriy Yablonskiy has nothing to disclose in relation to this study. Anne H. Cross is funded by the Manny and Rosenthal – Dr. John L. Trotter MS Center Chair of Barnes Jewish Hospital foundation and the Leon and Harriet Felman Fund for Human MS Research. She has also received consulting and/or speaking fees from Biogen, Celgene, EMD Serono, Genentech/Roche, Greenwich Biosciences, Janssen Pharmaceuticals, Novartis, and Race to Erase MS, all outside the submitted work.
Funding:
This work was supported by the National Institutes of Health [1R25NS090978]; Marilyn Hilton Award for Innovation in MS from the Conrad N. Hilton Foundation; the National MS Society USA [FG-1908-34882]; the National MS Society USA [RG 4463A18]; National Institutes of Health [CO6 RR020092]; NIH/NIA AG054513 and Washington University Institute of Clinical and Translational Sciences–Brain, Behavioral and Performance Unit [TR000448]. Anne H. Cross was funded in part by the Manny and Rosalyn Rosenthal-Dr. John L. Trotter MS Center Chair of Barnes-Jewish Hospital Foundation, and the Leon and Harriet Felman Fund for Human MS Research.
Ethical approval:
We take full responsibility for the data, the analyses, interpretation, and the conduct of the research. Data used in this manuscript will be available upon reasonable request. We confirm that this research was conducted according to the World Medical Association Declaration of Helsinki and conforms to the ICMJE recommendations for the conduct, reporting, editing, and publication of scholarly work in medical journals. The Institutional Review Board at Washington University in St Louis, Missouri approved the study (IRB ID #: 201412138). A waiver of consent was obtained to access already acquired clinical data (IRB ID #: 202005043; IRB ID #: 202005044).
Supplemental Material:
Supplemental material for this article is available online.
References
Supplementary Material
Please find the following supplemental material available below.
For Open Access articles published under a Creative Commons License, all supplemental material carries the same license as the article it is associated with.
For non-Open Access articles published, all supplemental material carries a non-exclusive license, and permission requests for re-use of supplemental material or any part of supplemental material shall be sent directly to the copyright owner as specified in the copyright notice associated with the article.