
Abstract
Background:
Computed tomography (CT) features and clinical characteristics have been shown in recent studies to be effective predictive indicators for risk stratification of thymic epithelial tumors. High-risk thymoma and thymic carcinoma (HRT-TC) are highly aggressive and are associated with poor prognoses. The aim of this study is to evaluate the predictive value of CT features and clinical characteristics to assess postoperative progression in patients with HRT-TC.
Methods:
Clinical and enhanced CT data were retrospectively collected from patients who underwent HRT-TC surgery between June 1, 2012, and June 1, 2022. A univariate Cox regression analysis was conducted to identify the risk factors associated with postoperative progression. A multivariate Cox regression analysis was then used to determine the independent risk factors. Three-year and 5-year single-factor models as well as multifactorial combined models were then constructed based on the results of these analyses to assess their efficacy, accuracy, and net benefit. The best-performing model was selected to create a nomogram for a consistency assessment.
Results:
A total of 215 patients were included in the study. The multivariate Cox regression analysis revealed that independent prognostic factors that influenced postoperative progression were the tumor length (hazard ratio [HR] = 1.027; 95% confidence interval [CI] = 1.004-1.049, P = .018), tumor resection (HR = 4.122; 95% CI = 2.054-8.274, P < .001), and the mediastinal vascular invasion (MVI; HR = 2.779; 95% CI = 1.140-6.775, P = .025). The 3-year and 5-year combined models demonstrated superior predictive efficacy, accuracy, and net benefits. The nomogram and calibration curves showed that the predicted risk probabilities from the nomogram aligned well with actual observations.
Conclusions:
A nomogram based on clinical and CT features provided effective predictions of progression following HRT-TC. This prognostic tool holds significant value for clinicians to guide therapeutic decisions and personalize survival assessments.
Introduction
Thymic epithelial tumors (TETs) are rare malignancies that originate from thymic epithelial cells, and they exhibit notable regional epidemiological variability. The annual incidence rates are approximately 1.7 per million in Europe and 4.09 per million in China.1,2 In 2015, the World Health Organization (WHO) classified TETs into 6 subtypes: thymoma types A, AB, B1, B2, and B3, and thymic carcinoma (TC). High-risk thymoma (HRT, including B2 and B3) and TC are highly aggressive and prone to recurrence and metastasis; however, their lymph node metastasis rate (17.6%) is significantly lower than that of more common malignancies such as lung cancer. 3 An epidemiological study conducted in the United States that utilized data from 2000 to 2020 revealed that the HRT incidence rate was 0.639 per million, while the TC incidence rate was 0.733 per million. Both conditions exhibited overall upward trends during the studied period, with HRT-TC accounting for 49.1% of all TET cases. 4
Currently, HRT-TC lacks specific serum tumor markers, and its clinical diagnosis primarily relies on computed tomography (CT) imaging. 5 Surgical resection remains the primary curative treatment. However, even among patients who have undergone complete resection, the postoperative recurrence rate reaches 8.97%. 6 Consequently, adjuvant therapy is often required. For unresectable cases, CT-guided or surgical biopsy is essential to determine the pathological subtype and guide subsequent neoadjuvant therapy. Currently, the clinical benefits of targeted therapy remain unclear. 7 Notably, CT imaging plays a critical role throughout the diagnostic and therapeutic process.8,9 Preoperatively, it facilitates precise evaluations of tumor morphology, sizes, and local invasion. Postoperatively, it offers a non-invasive and efficient means of monitoring the treatment response and disease progression. 10 The role of CT imaging to predict the prognosis of TETs has been continuously expanding in recent years. Multiple studies have confirmed that macro features, such as the mediastinal vascular invasion (MVI) and pericardial masses, are effective predictive indicators of a poor prognosis.11,12 In addition, the extracellular volume (ECV) fraction derived from the equilibrium phase enhanced CT has also been validated as a parameter for predicting disease-free survival. 13 However, research in this field has primarily focused on elucidating the correlation between these features and prognosis, while exploration into integrating these features to construct a quantitative model to accurately predict the postoperative progression-free interval remains insufficient. The aim of this study is to develop a nomogram model to quantitatively predict the postoperative progression-free interval (PFI) by integrating HRT-TC clinical features and preoperative CT imaging features, thereby supporting individualized treatment planning and decision-making.
Methods
All of the patient data were de-identified to protect patient privacy and confidentiality. The reporting of this study adheres to the Transparent Reporting of a Multivariable Prediction Model for Individual Prognosis or Diagnosis (TRIPOD) guidelines (Supplemental Table 1—TRIPOD + AI checklist 2024). 14
Patients
Patients diagnosed with HRT-TC at the First Affiliated Hospital of Soochow University between June 1, 2012, and June 1, 2022, were included in this study. The pathological diagnoses were reviewed by specialized pathologists. A total of 270 patients were recruited. The inclusion criteria consisted of the following: (1) histologically confirmed B2 and B3 thymoma or TC; (2) surgical treatment, including complete resection (R0 resection, no residual lesions) and incomplete resection (R1 resection and R2 resection); (3) chest-enhanced CT scanning performed within 3 months prior to surgery; and (4) no prior tumor-related treatment. The exclusion criteria consisted of the following: (1) patients with other tumors at the same time; (2) poor-quality CT images; (3) incomplete clinical or follow-up data; (4) preoperative tumor distant metastasis; and (5) patients who had undergone only a puncture biopsy without surgery. The PFI was defined as the period from surgery to tumor progression or the end of the study. The follow-up protocol consisted of CT scans at 3-month intervals for the first year and then at 6- to 12-month intervals thereafter. The primary endpoint was a tumor progression evaluation that was measured from the date of surgery to the date of progression. Tumor progression was defined as follows: (1) local recurrence (lesions at the surgical site), regional recurrence (pleural and/or pericardial dissemination), or distant metastasis (both intrathoracic and extrathoracic) for tumors resected with R0 and (2) the discovery of regional and distant metastases after R1 or R2 resection. 11 Tumor progression was diagnosed based on CT scans. Ultimately, 215 patients were included in the study. The screening process for the 215 patients in this study is depicted in Figure 1.

The screening process for the 270 patients in this study.
Clinical information
Clinical data were collected from the patients’ electronic medical records. These data included age (in years), sex (male or female), presence of myasthenia gravis (yes or no), surgical approach (thoracotomy or thoracoscopy), the tumor resection status (complete or incomplete), tumor type (B2, B3, or TC), adjuvant postoperative therapy (none, radiotherapy, chemotherapy, or radiotherapy + chemotherapy), and tumor, lymph node, and distant metastasis (TNM) staging (I, II, III, IVa). Complete resection was defined as R0, indicating no presence of residual tumor, while incomplete resection was defined as R1 for the presence of microscopic residual tumors and R2 for the presence of macroscopic residual tumors. The tumor type was classified according to the WHO 2021 staging criteria. The TNM staging was based on the ninth edition TNM staging classification for TETs.
Imaging examinations
Two chest radiologists, each with over 10 years of experience in diagnostic chest imaging, retrospectively conducted and independently analyzed all of the preoperative CT images. The radiologists were blinded to the patients’ identities and clinical data. In cases of disagreement regarding the CT findings, a third observer with 15 years of experience in chest CT imaging adjudicated the discrepancy. All image data were reconstructed using standard algorithms and reviewed through the lung window (window width: 1500 HU; window level: −500 HU) and mediastinal window (window width: 350 HU; window level: 50 HU). The assessment included the tumor morphology (regular or irregular), border (clear or unclear), longest length (in millimeters, keep 1 decimal place), cystic necrosis (yes or no), calcification (yes or no), MVI (yes or no), hydrothorax (yes or no), hydropericardium (yes or no), and degree of CT enhancement. The longest length was measured in the axial or coronal plane. The MVI included the aorta and its major branches, the superior vena cava, and the cephalic and brachial veins. The degree of CT enhancement was categorized based on the net enhancement values: mild (<20 HU), moderate (20-40 HU), and marked (>40 HU).
Statistical analysis
The statistical analyses and graphing were performed using SPSS software version 25.0 (SPSS Inc, Chicago, Illinois) and R software version 4.4.2 (http://www.R-project.org). Quantitative data that conformed to a normal distribution are expressed as means ± standard deviations, while data that did not conform to a normal distribution are expressed as medians (upper and lower quartiles) (M[Q1, Q3]). A t-test was applied for normally distributed data, and the Mann-Whitney U test was used for non-normally distributed data. The qualitative data are presented as frequencies and percentages, and they were analyzed using the chi-square test or Fisher’s exact test. Kaplan-Meier curves were compared using the log-rank test, and the receiver operating characteristic (ROC) curves were compared using the DeLong test. A P-value less than .05 was considered statistically significant. The variance inflation factor (VIF) was used to measure the multicollinearity between independent variables in the regression analysis. Interobserver agreement between 2 reviewers was assessed using the intraclass correlation coefficients, with interpretation criteria as follows: poor (<0.20), fair (0.21-0.40), moderate (0.41-0.60), good (0.61-0.80), and excellent (0.81-1.00). The optimal cut-off values for the age and tumor dimensions were determined using the Youden index.
Tumor progression predictors were identified using a Cox proportional hazards regression analysis. Variables with a significance level of P < .05 in the univariate analysis were included in the multivariate Cox regression analysis. The stepwise selection method was used, and time-dependent ROC curves were plotted based on the results. The efficacy was evaluated using the area under the curve (AUC), and a decision curve analysis was performed to assess the net benefit. Harrell’s consistency index (C-index) was used to quantify the model’s discriminative accuracy, with C = 0.5 indicating a random prediction, C = 1.0 indicating a perfect prediction, and C = 0.7 or higher indicating excellent consistency. Nomograms were constructed with the 3-year and 5-year tumor progressions as endpoints, and their consistency was assessed using calibration curves that were resampled 1000 times using the bootstrap method.
Results
Patient characteristics
A total of 215 patients were evaluated in the HRT-TC cohort. The mean follow-up duration was 52.29 ± 22.67 months (range = 3-104 months), and the mean age was 56.30 ± 12.56 years (range = 23-81 years), with an optimal cut-off age of 52.5 years. Among the participants, 126 (58.6%) were males and 89 (41.4%) were females. The tumor WHO type showed B2 tumors in 56 patients (26.0%), B3 tumors in 61 (28.4%) patients, and TC in 98 (45.6%) patients. There were 65 cases that were classified as stage I, 56 cases as stage II, 64 cases as stage III, and 30 cases as stage IV according to the tumor TNM staging system. The progression rate for the R0 resection was 12.4% (20/161); for R1, it was 52.2% (12/23); and for R2, it was 54.8% (17/31). The progression rate was 11.9% (7/59) for patients who did not receive adjuvant therapy. The progression rate was 18.5% (12/65) for patients who received only radiotherapy. The progression rate was 50% (6/12) for the patients who received only chemotherapy, and it was 30.4% (24/79) for those who received both radiotherapy and chemotherapy. Among the patients who did not receive adjuvant therapy, 64.4% (38/59) were staged as B2/B3, 67.8% (40/59) were at stages I/II, 81.4% (48/59) underwent R0 resection, and 81.4% (48/59) had no venous invasion. In comparison, the respective figures for the patients who received adjuvant therapy were 50.6% (79/156), 51.9% (81/156), 73.1% (114/156), and 60.3% (94/156). A total of 90.8% (129/142) of patients without MVI underwent R0 resection, while only 45.2% (33/73) of patients with MVI achieved R0 resection. The tumor maximum length ranged from 10.4 mm to 94.8 mm, with a median of 42.2 mm (interquartile range [IQR] = 31.2-55.8 mm). The median length was significantly higher in patients with disease progression (54.7 mm, IQR = 44.0-70.4 mm) than in the non-progressive group (39.6 mm, IQR = 26.5-53.3 mm). A maximum length cut-off of 40.3 mm was established.
Postoperatively, 49 patients (22.8%) developed tumor progression during follow-up. Among the 49 cases with progression, there were 7 cases of local progression, 17 cases of regional progression, and 25 cases of distant progression. In the group of stage IV patients that included 30 cases, 14 showed progression. This figure consisted of 1 case of local progression, 2 cases of pulmonary recurrence, 6 cases of pulmonary progression, 3 cases of regional progression, 1 case of liver progression, and 1 case of bone progression. The 3-year progression rate was 13.95% (30/215), and the 5-year rate was 20.93% (45/215). The cohort’s clinical and CT features are detailed in Table 1. The VIF values of each factor were all less than 5. Significant differences (P < .05) were observed between the progression and non-progression groups for age, hydropericardium, tumor morphology, length, border, MVI, surgical approach, pathological type, tumor resection status, adjuvant therapy, and TNM stage. No significant differences (P > .05) were found for sex, cystic necrosis, calcification, hydrothorax, CT enhancement degree, or myasthenia gravis.
Clinical and imaging features of the patients.

Analysis of the predictive factors of tumor progression
The results of the univariate and multivariate Cox regression analyses are presented in Table 2. The univariate Cox regression analysis identified several predictors of postoperative progression that included age (P = .017), hydrothorax (P = .007), hydropericardium (P = .005), tumor morphology (P = .005), tumor border (P = .001), length (P < .001), MVI (P < .001), pathological type (P = .001), surgical approach (P = .045), tumor resection status (P < .001), and TNM stage (P < .001). The multivariate Cox regression analysis further identified independent predictors of postoperative progression that included the tumor length (P = .018), the tumor resection status (P < .001), and the MVI (P = .025).
Univariate and multivariate Cox regression analyses of the postoperative HRT-TC progression.

The graphs indicated a progressive decrease in the overall progression-free rate over time, with a 5-year progression-free rate that exceeded 50% (Figure 2A). A cut-off value of 40.3 mm for the length was used to stratify the data, and the progression-free survival curves were generated based on 3 independent predictive factors. The results showed that the PFI was significantly lower in patients with lengths ⩾40.3 mm compared to those with lengths <40.3 mm (log-rank test P < .001, Figure 2B). Similarly, the PFI was significantly lower in the incompletely resected tumor group compared to that of the completely resected group (log-rank test P < .001, Figure 2C) and lower in the MVI group compared to the group without vascular invasion (log-rank test P < .001, Figure 2D).

(A) Overall non-progression curve of the patients. (B) Non-progression curve of the length demarcated by 40.3 mm. (C) Non-progression curve of the tumor’s resected status. (D) Non-progression curve of the MVI.
Development of the predictive models based on the clinical and computed tomography features
Predictive models for the 3- and 5-year tumor progression-free probabilities of HRT-TC were developed using independent predictors. The AUC values of the progression-free models at 3 and 5 years were as follows: for the length model, 0.749 (95% confidence interval [CI] = 0.669-0.829) and 0.731 (95% CI = 0.640-0.822); for the tumor resection model, 0.852 (95% CI = 0.783-0.922) and 0.751 (95% CI = 0.667-0.835); and for the MVI model, 0.765 (95% CI = 0.685-0.845) and 0.755 (95% CI = 0.672-0.837), respectively. The combined model yielded the highest AUCs: 0.902 (95% CI = 0.848-0.955) for 3 years and 0.846 (95% CI = 0.771-0.922) for 5 years (Figure 3). The Delong test confirmed the superior predictive performance of the combined model for both the 3- and 5-year predictions, demonstrating a statistically significant difference in the AUC. The decision curve analysis revealed that the combined model had a higher overall net benefit compared with the individual models across the most reasonable threshold probability ranges (Figure 4). The C-index values for each model were as follows: 0.714 (95% CI = 0.680-0.748) for the length model, 0.764 (95% CI = 0.735-0.793) for the tumor resection model, 0.741 (95% CI = 0.710-0.772) for the MVI model, and 0.840 (95% CI = 0.813-0.867) for the combined model. This indicated that the combined model demonstrated superior accuracy for the prediction of tumor progression-free outcomes. The typical cases are shown in Figures 5 and 6.

ROC curves of subjects’ work features for the 3-year (A) and 5-year (B) HRT-TC progression-free models.
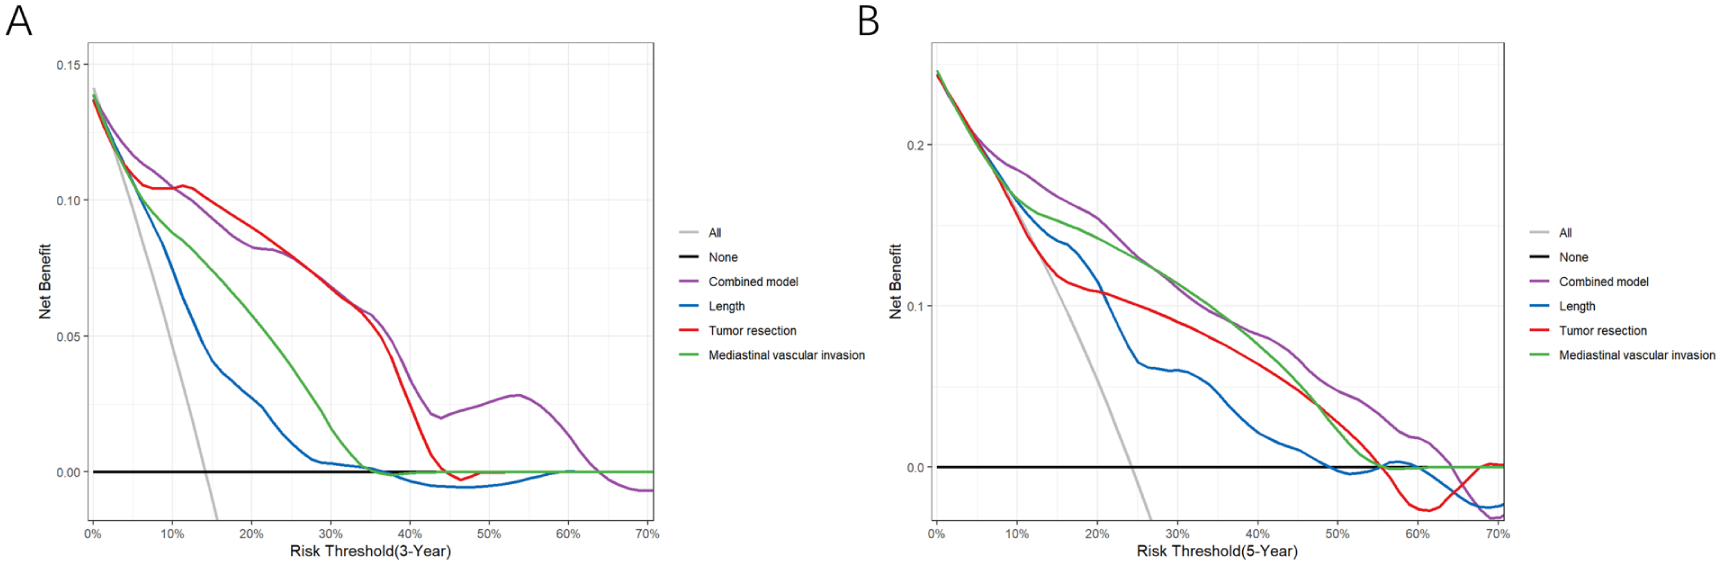
Decision curve analysis for 3-year (A) and 5-year (B) HRT-TC progression-free models.

(A) Length of the thymic carcinoma was 31.6 mm without vascular invasion. (B) Following R0 resection combined with adjuvant radiotherapy and chemotherapy, CT imaging at 60 months demonstrated no evidence of recurrence.

(A) Length of the B3 thymoma was 86.4 mm, and it invaded the innominate vein. (B) Following R1 resection combined with adjuvant radiotherapy and chemotherapy, focal progression of mediastinal pleura (arrow) was found at the 23rd-month follow-up.
Nomogram construction based on the clinical and computed tomography features
Given its superior predictive efficacy, accuracy, and net benefit, a nomogram was constructed for the combined model to predict the 3- and 5-year probabilities of being tumor progression-free after surgery. The largest contributor to the prediction of tumor progression in the nomogram was the tumor resection status, followed by the MVI and CT-measured tumor length. The total score was obtained by summing the individual variable scores, with a vertical line drawn to assess the probability of being progression-free at 3 and 5 years (Figure 7). The internal validation was performed using the Bootstrap method, and the calibration curves showed good agreement between the estimated and observed risks for both the 3- and 5-year tumor progression-free outcomes (Figure 8).

Nomogram predicting the probability of progression-free HRT-TC at 3 and 5 years.

Calibration curves for 3-year (A) and 5-year (B) HRT-TC progression-free nomogram.
The nomogram was used to calculate the total score for each patient by adding the score obtained from the individual characteristics. We then assigned a Youden-derived cut-off value of 156.7 points to the nomogram-derived scores. This allowed for the grouping of patients into 2 categories: a score <156.7 and a score ⩾156.7. The PFI in the high-score group was significantly lower than that in the low-score group (log-rank test P < .0001, Figure 9).

Non-progression curve of the nomogram score.
Discussion
The TETs are frequently located in the anterior mediastinum and often present with an insidious onset. The initial clinical diagnosis and postoperative management of TETs are heavily reliant on CT imaging assessments due to the lack of specific tumor markers. The TETs typically exhibit a unique, indolent biological behavior, and patients tend to have long overall survival (OS). Consequently, the OS is not considered a reliable indicator of treatment effectiveness. Instead, the treatment efficacy is best evaluated by the progression of thymic malignancy at any site. 15 Current TET imaging studies primarily focus on histologic classification and staging. 16 The HRT-TC is more aggressive and more likely to recur after surgery. However, research on the correlation between the CT features of HRT-TC and the postoperative PFI remains limited. This study included 215 patients diagnosed with HRT-TC. The univariate Cox regression analysis revealed significant associations between the hydrothorax, hydropericardium, tumor morphology, margins, length, MVI, pathological type, surgical approach, and resection status and postoperative progression. The multivariate analysis confirmed that resection status, tumor length, and MVI were independent predictive factors for postoperative PFI. A column-line graph model was constructed based on these findings. The model demonstrated a high predictive efficacy, with 3-year and 5-year AUCs of 0.902 and 0.846, respectively, and a C-index of 0.84. The prognostic prediction of this model exhibited strong accuracy. Notably, although concomitant myasthenia gravis (MG) may prompt patients to seek early diagnosis, the present study found no significant association between the MG status and the postoperative PFI (P = .422). This result agreed with the findings of several studies conducted by the International Thymic Malignancy Interest Group.17,18
Tseng et al 19 specifically analyzed patients with Masaoka stage III tumors and found that invasion of the innominate vein or superior vena cava was more strongly associated with a higher risk of disease recurrence than invasion of the lungs, pericardium, or other structures. Chiappetta et al 20 conducted a univariate analysis of tumor invasion into adjacent structures and discovered that, compared to invasion of the pleura, pericardium, lungs, or the phrenic nerve, only invasion of the mediastinal veins showed a significant correlation with tumor-specific survival. The HRT-TC typically exhibits aggressive growth, with lesions that are often closely associated with the pericardium and mediastinal pleura. However, accurate assessments of the invasion of these structures via CT scans remain challenging due to cardiac pulsation artifacts. 21 Enhanced CT scans are effective for the detection of MVI that includes involvement of the aorta, the brachiocephalic vein, and the superior vena cava. Kuriyama et al 22 refined their measurement methods to enable more accurate assessments of the MVI. The results of the present study suggested that a preoperative enhanced CT that showed MVI in patients with HRT-TC was an independent risk factor for postoperative progression. When CT scans reveal MVI, particularly when both the mediastinal arteries and veins are involved, the challenges of surgery and the tumor’s local aggressiveness restrict the likelihood of achieving an R0 resection, 23 thereby increasing the postoperative progression risk.
Existing studies have clearly established that R0 resection is a crucial treatment strategy for patients with TETs, and R0 resection significantly contributes to favorable prognostic outcomes.6,24 R0 resection is essential to improve long-term prognoses in patients with early-stage HRT-TC, and some patients with locally advanced tumors may also achieve long-term survival following R0 surgery. 25 The current study further supported this view. In patients who experienced tumor progression during the postoperative follow-up, the proportion of those in the non-R0 resection group was significantly higher compared to the number in the R0 resection group, and the PFI was significantly shorter in the non-R0 resection group. The multivariate analysis revealed that resection status was an independent risk factor for postoperative progression. Non-R0 resected patients frequently present at an advanced TNM stage with extensive tumor invasion. This complicates complete surgical resection. In addition, some patients may harbor undetected occult micro-metastases that are not visible on preoperative imaging. These factors may contribute to a higher risk of disease progression following surgery. Our analysis revealed that among the MVI patients who did not achieve R0 resection, 62.5% (25/40) experienced recurrence compared to 36.4% (12/33) in the MVI patients who did achieve R0 resection, and the difference was statistically significant (P = .026). Therefore, we conclude that for patients preoperatively assessed to have MVI, the performance of an R0 resection would have a substantial impact on their prognosis. If the R0 resection is anticipated to be challenging, neoadjuvant therapy prior to surgery may be beneficial.
Over the past decade, numerous researchers have consistently confirmed a significant correlation between the tumor size of TETs and the prognosis. The 9th edition of the TNM staging system introduced tumor size as a descriptive parameter for T staging, defining T1a TETs as ⩽ 5 cm and T1b TETs as > 5 cm, with marked differences between these categories and other T stages. 26 However, the critical value for other stages remains inconclusive and requires further investigation. Xu et al 27 analyzed 331 patients with R0 resected thymomas and identified a critical value of 8 cm as a reliable predictor of postoperative tumor recurrence. A multicenter study by Yun et al 28 found that a critical value of 5.5 cm was a good predictor of the PFI following R0 resection in patients with early-stage TETs. Ruffini et al 17 conducted a study on TC in which a univariate analysis that used a median tumor length of 5 cm as the threshold indicated that this measurement was a significant predictor of postoperative progression. However, in the multivariate study, the tumor size was no longer a significant prognostic factor. This study demonstrated that the maximum tumor length based on CT measurements was an independent risk factor for PFI in patients with HRT-TC, with the risk of progression increasing progressively as the tumor length increased. The Youden index was used as an optimal threshold for the tumor length and was derived to be 40.3 mm, revealing that patients with a tumor length ⩾40.3 mm had a significantly higher risk of postoperative progression compared to those with tumor lengths <40.3 mm. For patients with a high suspicion of HRT-TC, a tumor length that exceeds 40.3 mm necessitates heightened attention and a discussion by a multidisciplinary team to consider a more aggressive treatment approach. This may include neoadjuvant therapy, extended surgical resection with systematic lymphadenectomy, intensive adjuvant chemoradiotherapy, and closer postoperative surveillance. Collectively, these studies suggest that the higher the tumor malignancy, the smaller the critical value of the tumor length to predict the postoperative progression. Notably, although the histologic subtype (HRT-TC) was associated with postoperative PFI, it was not incorporated into the final prediction model. This suggested that the R0 resection status, tumor size, and MVI are more significant prognostic predictors than histologic staging differences in HRT-TC.
It was observed that the progression rate was lower for patients who did not receive adjuvant therapy, while it was higher for those who did. Patients with a higher risk of tumor progression are more likely to receive adjuvant therapy, resulting in a higher progression rate for patients who receive adjuvant therapy due to selection bias. A systematic review found that patients who were selected to receive postoperative radiotherapy (PORT) may have poorer prognoses than patients who do not receive PORT. However, patients with poor prognoses might have been selected for adjuvant therapy compared with patients who did not receive adjuvant therapy, and this would have biased the results toward the no adjuvant therapy group. 24
In this study, we combined preoperative imaging features with the intraoperative resection status to create a continuous system for preoperative assessment and postoperative prognosis evaluations. For high-risk patients with a nomogram score that exceeds 156.7, there is a significantly elevated risk of recurrence, prompting clinicians to carefully consider the necessity of adjuvant treatment for this group, who may stand to benefit the most from adjuvant radiotherapy or chemotherapy. Conversely, for low-risk patients, the potential side effects of adjuvant treatment can be weighed to avoid overtreatment. Nonetheless, it is essential to emphasize that the final decision regarding adjuvant therapy should be a comprehensive clinical judgment process that incorporates the surgical resection status, the patient’s overall condition, and existing clinical guidelines, rather than relying solely on the model’s score. In this study, 12.24% (6/49) of disease progressions occurred more than 5 years after surgery, and 66.67% (4/6) of these late progressions were distant metastases. We therefore recommend that patients at high risk of progression remain under close surveillance with a structured long-term follow-up protocol for at least 10 years. This should include periodic imaging examinations, specifically annual CT scans of the chest, abdomen, and pelvis, alongside regular clinical evaluations. The development of a prediction model based solely on preoperative imaging is highly appealing, as it enables surgeons to assess surgical risks and prognosis prior to surgery. However, surgical factors themselves are crucial determinants of prognosis, and the construction of a purely imaging-based model may compromise the predictive performance. In the future, we will further explore the feasibility of predicting surgical outcomes (such as the R0 resection probability) and prognosis based on imaging features, integrating additional radiomic information to establish a complementary predictive tool that spans the entire preoperative and postoperative process.
Limitations
This study has several limitations despite its contributions. First, the retrospective, single-center design inherently carries potential biases and may limit the generalizability of our findings. Second, due to the rarity of TETs, our cohort consisted of a relatively small sample size without a formal a priori sample size calculation. Although we included all eligible cases during the study period, the limited sample size may have reduced statistical power and precluded external validation. Third, to maintain consistency in preoperative imaging assessment, we excluded patients who received neoadjuvant therapy. Consequently, our model is primarily applicable to patients undergoing direct surgery, and its generalizability to those requiring neoadjuvant therapy remains limited.
Conclusion
This research investigated the correlation between clinical and CT imaging features and postoperative progression in patients with HRT-TC. It identified the surgical resection status, tumor length, and MVI as independent predictors of postoperative progression in these patients. Furthermore, we developed a nomogram that integrates clinical and CT imaging features and provides substantial value for individualized risk assessments in HRT-TC patients.
Supplemental Material
sj-docx-1-onc-10.1177_11795549251413298 – Supplemental material for Development of Nomogram for Predicting Postoperative Progression Risk in High-Risk Thymoma and Thymic Carcinoma Utilizing Clinical and Preoperative CT Features
Supplemental material, sj-docx-1-onc-10.1177_11795549251413298 for Development of Nomogram for Predicting Postoperative Progression Risk in High-Risk Thymoma and Thymic Carcinoma Utilizing Clinical and Preoperative CT Features by Qian Meng, Nan Jiang, Jun Chen, Chunjiao Weng, Huanmin Miao, Xiaoxia Ping and Chunhong Hu in Clinical Medicine Insights: Oncology
Footnotes
Acknowledgements
None.
Ethical considerations
The study was a retrospective study that was approved by the Ethics Committee of the First Affiliated Hospital of Soochow University, and the requirement for informed consent was waived by the Ethics Committee (2025-No.496). It was performed in compliance with the Declaration of Helsinki, and all methods were carried out by relevant guidelines and regulations.
Consent for publication
Not applicable. This study does not contain any individual patient data, images, or other personally identifiable information requiring consent for publication.
Author contributions
Study conception and design was done by Q.M. and C.H. Data acquisition was done by N.J. and J.C. N.J., J.C., and C.W. contributed toward software. Data analysis and interpretation of results was done by H.M. and X.P. Critical revision of the article was done by Q.M. and C.H. All authors read and approved the final article.
Funding
The authors received no financial support for the research, authorship, and/or publication of this article.
Declaration of conflicting interests
The authors declared no potential conflicts of interest with respect to the research, authorship, and/or publication of this article.
Data availability statement
The data sets generated and analyzed during this study are not publicly available due to privacy and ethical concerns but are available from the corresponding author on reasonable request.
Supplemental material
Supplemental material for this article is available online.
References
Supplementary Material
Please find the following supplemental material available below.
For Open Access articles published under a Creative Commons License, all supplemental material carries the same license as the article it is associated with.
For non-Open Access articles published, all supplemental material carries a non-exclusive license, and permission requests for re-use of supplemental material or any part of supplemental material shall be sent directly to the copyright owner as specified in the copyright notice associated with the article.