
Abstract
Background:
Induction chemotherapy (ICT) has become an initial treatment for head and neck squamous cell carcinoma (HNSCC). However, myelosuppression, an unavoidable side effect of ICT, significantly impacts follow-up treatment and prognosis. The main objective of this study is to identify the risk factors and predictors of myelosuppression and its different severity after ICT for ICT.
Methods:
We retrospectively reviewed medical records of 102 patients with hypopharyngeal cancer or oropharyngeal cancer who received initial ICT from 2013 to 2022. Univariate and multivariate logistic regression analyses were performed to identify risk factors for myelosuppression. Receiver-operating characteristic (ROC) curves were generated using the results of multiple logistic regression analysis to identify data with the highest sensitivity and lowest false-negative rate.
Results:
Pretreatment lymphocyte count (PLC) and the pretreatment platelet count (PPC) were identified as independent risk factors of myelosuppression (P < .05). Pretreatment hemoglobin count (PHC) was an independent risk factor for predicting myelosuppression in patients with grades III to IV disease. Patients with myelosuppression after ICT are more sensitive to chemotherapy.
Conclusions:
The PLC and PPC predicted myelosuppression in patients with HNSCC-administered ICT, and the PHC predicted grades III to IV myelosuppression. Myelosuppressed patients were more chemosensitive after ICT.
Introduction
Head and neck cancer, which refers to tumors originating in the oral cavity, oropharynx, larynx, laryngopharynx, and other regions of the head and neck is the sixth most common malignant tumor worldwide; and approximately 90% of these tumors are classified as head and neck squamous cell carcinoma (HNSCC). 1 In 2020, there were approximately 930 000 new cases of head and neck cancer and 470 000 associated deaths worldwide. 2 Early HNSCC may be treated using radiotherapy or surgery, although most patients are initially diagnosed with locally advanced disease. 3
Currently, induction chemotherapy (ICT) has become an option for laryngotractrachea function preservation in locally advanced HNSCC, and the standard treatment regimen is TPF, a combination therapy of docetaxel (DTX), cisplatin (CDDP), and fluorouracil (5-FU). 4 Although ICT plays an important role in organ preservation, early recognition of a tumor’s response to chemotherapy, and early reduction in distant metastasis, chemotherapy drugs also increase the risk of various adverse reactions in patients. 5 Myelosuppression is a common adverse effect of chemotherapy, which is caused by depletion of bone marrow progenitor cells. The typical clinical manifestations of myelosuppression include anemia, thrombocytopenia, neutropenia, and leukopenia. 6 Furthermore, severe myelosuppression delays administration of chemotherapy, affecting the subsequent therapeutic effect, which may directly lead to death caused by severe infection, spontaneous internal bleeding, and other complications. 7 Therefore, it is critically important to identify predictors of myelosuppression to facilitate earlier intervention.
This study evaluated the value of inflammatory markers in predicting the occurrence and severity of myelosuppression in patients with HNSCC. Our findings will serve as a reference for clinical evaluation of the risk of myelosuppression to optimize treatment strategies. Furthermore, we evaluated the correlation between myelosuppression and sensitivity to chemotherapy.
Materials and Methods
Patients
We retrospectively selected 102 patients with hypopharyngeal or oropharyngeal cancer treated at the First Affiliated Hospital of Sun Yat-sen University from September 2013 to January 2022. The inclusion criteria were as follows: (1) patients pathologically diagnosed with hypopharyngeal or oropharyngeal cancer, and (2) patients treated with ICT followed by radiotherapy, definitive concurrent chemoradiotherapy, or surgery. All clinicopathological data were obtained from the hospital’s database with the approval of the Ethics Committee of The First Affiliated Hospital of Sun Yat-sen University, Guangzhou, China (Approval No. 2012-349). The exclusion criteria were as follows: (1) patients with a history of other cancers, (2) patients with incomplete data, (3) patients who received any anticancer therapy before response evaluations, (4) patients for whom chemotherapeutic efficacy was not evaluated, (5) patients with immune system diseases, (6) active infection such as viral and bacterial, (7) chronic inflammatory conditions, (8) any hematologic disease, (9) immunosuppressive medications like recent steroid therapy, and (10) administration of hematopoietic agents like granulocyte-macrophage colony-stimulating factor. Clinical staging of tumors was assessed according to the 2017 American Joint Committee on Cancer (AJCC) staging classification (eighth edition). 8
Treatment
Patients received 3 cycles of ICT (TPF [68, 66.67%]: DTX 75 mg/m2 on day 1; CDDP 75 mg/m2 on day 1; and FU 750 mg/m2 per day on days 1-5; TP [22, 21.57%]: DTX 75 mg/m2 on day 1 and CDDP 75 mg/m2 on day 1; PF [12, 11.76%]: CDDP 75 mg/m2 on day 1 and FU 750 mg/m2 per day on days 1-5) at 3-week intervals. 3 Tumor response was evaluated clinically by electronic laryngoscope and/or CT imaging after each treatment cycle. Subsequently, radiotherapy, definitive concurrent chemoradiotherapy, or surgery were performed according to ICT responses. After the end of each cycle of chemotherapy, routine blood tests were regularly rechecked to document the time of occurrence and severity of myelosuppression.
Response assessment
Chemotherapeutic responses were evaluated after 3 cycles of ICT using the revised Response Evaluation Criteria in Solid Tumors (version 1.1). 9 Chemotherapeutic responses were classified into the categories as follows: complete response (CR), partial response (PR), stable disease (SD), and progressive disease (PD). In detail, all the diameters of target lesions including both primary lesions and measurable lymph nodes that no shorter than 15 mm in short axis were measured. Chemotherapeutic responses were classified into four categories: CR, PR, SD, and PD. The criterion of CR is disappearance of all target lesions. Any pathological lymph nodes (whether target or nontarget) must have reduction in short axis to <10 mm. The criterion of PR is at least a 30% decrease in the sum of diameters of target lesions. The criterion of SD is shrinkage less than 30% or increase less than 20%. The criterion of PD is at least a 20% increase in the sum of diameters of target lesions with an absolute sum increase of at least 5 mm. Overall response (OR) included CR and PR, whereas non-overall response (NOR) included SD and PD.
Evaluation criterion
According to the World Health Organization (WHO) chemotherapy toxicity evaluation standard (as shown in Table 1), myelosuppression was divided into I to IV degrees, in which the boundary values were as follows: white blood cell (WBC) counts: 4.0 × 10⁹/L, 3.0 × 10⁹/L, 2.0 × 10⁹/L, and 1.0 × 10⁹/L; pretreatment hemoglobin count (PHC): 110, 95, 80, and 65 (g/L); pretreatment platelet count (PPC): 100 × 109/L, 75 × 109/L, 50 × 109/L, and 25 × 109/L; and pretreatment neutrophil count (PNC): 2.0 × 10⁹/L, 1.5 × 10⁹/L, 1.0 × 10⁹/L, and 0.5 × 10⁹/L.
Classification standards of myelosuppression.
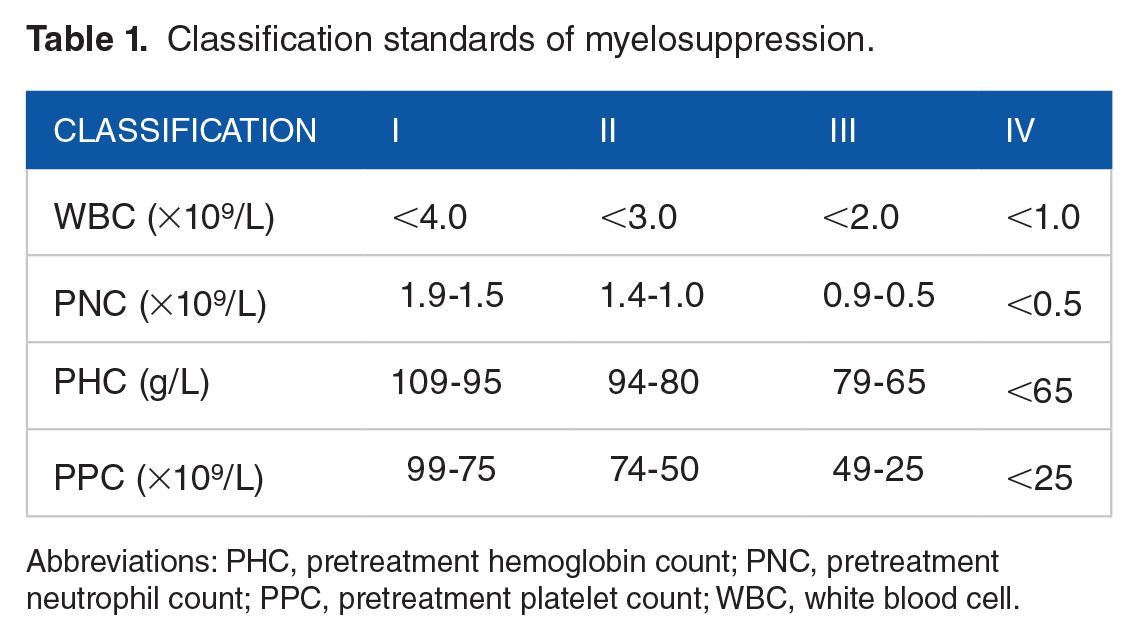
Abbreviations: PHC, pretreatment hemoglobin count; PNC, pretreatment neutrophil count; PPC, pretreatment platelet count; WBC, white blood cell.
Data collection
Demographic information for age, sex, tumor stage, degree of differentiation, pathological results, laboratory test results, and drug information were collected from electronic medical records. Laboratory test results included routine blood tests, coagulation functions, liver and renal functions, and combination medication information, which were recorded and compared. The criteria for myelosuppression were as follows: WBCs <4 × 10⁹/L, PNC <2 × 10⁹/L, PPC <100 × 109/L, and PHC <110 g/L. When one of the four indicators appeared, the diagnosis of myelosuppression was considered.
Statistical analysis
Statistical analysis was performed using SPSS statistical software (version 25.0; IBM Corp, Armonk, NY, USA). The Pearson chi-square test or Fisher’s exact test was used to analyze categorical data, and an independent two-sided t test was used to compare continuous variables expressed as the mean ± standard deviation (SD). Factors with two-sided P < .05 in univariate analysis were selected for multivariate logistic regression analysis, which was performed to identify independent predictors of myelosuppression induced by chemotherapy for HNSCC. The odds ratio (OR) and 95% confidence interval (CI) were also calculated. Receiver-operating characteristic (ROC) curves were generated according to the results of multiple logistic regression analysis and were used to identify the data indicating the highest sensitivity and lowest false-negative rate; and P < .05 was considered statistically significant.
Results
Patients’ characteristics
The main clinical and pathological characteristics of patients (n = 102) are shown in Table 2. These patients included those with hypopharyngeal squamous cell carcinoma (n = 80, 78.43%) or oropharyngeal squamous cell carcinoma (n = 22, 21.57%) who received ICT as initial treatment. Patients included 96 men (94.12%) and 6 women (5.88%), mean age of 56.02 ± 8.28 years (range, 30-77 years). Among them, 31 (30.39%) patients did not have myelosuppression during treatment, including 30 males (96.77%) and 1 female (3.23%), with an average age of 53.06 ± 9.53 years (range 30-77 years). The clinical stages of tumor were as follows: stage I, n = 0; stage II: n = 1, 3.23%; stage III: n = 3, 9.68%; and stage IV: n = 27, 87.10%. The remaining 71 (69.61%) patients had myelosuppression of varying severities, including 66 men (92.96%) and 5 women (7.04%), average age of 57.31 ± 7.37 years (range, 43-76 years). The numbers (%) of patients with specific grades of myelosuppression were as follows: I: n = 31, 43.66%; II: n = 22, 30.99%; III: n = 11, 15.49%; and IV: n = 7, 9.9%. The clinical tumor stages of patients were as follows: stage II: n = 3, 4.23%; stage III: n = 16, 22.54%; and stage IV: n = 52, 73.24%. Seven patients (6.865%) were lost to follow-up during treatment. Among the other 95 patients (93.14%) administered ICT, 62 (65.26%) experienced an OR to chemotherapy, and 33 patients (34.74%) were evaluated for a NOR.
Demographic characteristics of patients and hematological indexes before ICT.

Abbreviations: ALT, aspartate aminotransferase; AST, aspartate transaminase; Fib, fibrinogen; ICT, induction chemotherapy; LMR, lymphocyte-to-monocyte ratio; NLR, neutrophil-to-lymphocyte ratio; PAC, pretreatment albumin count; PHC, pretreatment hemoglobin count; PLC, pretreatment lymphocyte count; PLR, platelet-to-lymphocyte ratio; PMC, pretreatment monocyte count; PNC, pretreatment neutrophil count; PPC, pretreatment platelet count; SD, standard deviation; PF, cisplatin+fluorouracil; TP, docetaxel+cisplatin; TPF, docetaxel+cisplatin+fluorouracil; TNM,tumor node metastasis.
Comparison of results between non-myelosuppression and myelosuppression groups
Comparing the general data and inflammatory indicators of patients in the nonmyelosuppression and myelosuppression groups revealed no significant difference in sex, age, tumor type, tumor differentiation, PHC, platelet-to-lymphocyte ratio (PLR), lymphocyte-to-monocyte ratio (LMR), neutrophil-to-lymphocyte ratio (NLR), pretreatment albumin count (PAC), aspartate transaminase (AST), aspartate aminotransferase (ALT), and fibrinogen (Fib) (all P > .05), while the average age of patients in the myelosuppression group was greater than that in the nonmyelosuppression group. While the PNC, PPC, pretreatment lymphocyte count (PLC), and pretreatment monocyte count (PMC) were lower than those in the nonmyelosuppression group, the difference was statistically significant (P < .05). Further multivariate analysis showed that PLC (OR = 0.385, 95% CI = [0.176-0.841, P = .017) and PPC (OR = 0.994, 95% CI = [0.988-0.999], P = .028) can be used as predictors of myelosuppression induced by chemotherapy in patients with HNSCC (Table 3).
Logistic regression analysis of risk factors for myelosuppression.

Abbreviations: CI, confidence interval; OR, odds ratio; PLC, pretreatment lymphocyte count; PPC, pretreatment platelet count; SE, standard error.
Receiver-operating characteristic curve analysis of myelosuppression associated with induction chemotherapy
Multiple logistic regression analysis showed that the PLC and PPC were significantly associated with myelosuppression of patients with ICT and could, therefore, serve as predictors of myelosuppression. To further study the relationship between the PLC and PPC in ICT and the incidence of myelosuppression, we generated an ROC curve to determine the critical values of these factors for predicting myelosuppression in 102 patients with ICT. As shown in Figure 1, the cutoff value of the PLC was 1.69 × 10⁹/L (sensitivity = 0.496, specificity = 0.839, area under the curve [AUC] = 0.677, P = .005). As shown in Figure 2, the cutoff value of the PPC was 240.5 × 10⁹/L (sensitivity = 0.69, specificity = 0.71, AUC = 0.709, P = .001).

ROC curve analysis of the PLC for predicting myelosuppression in patients administered ICT. The cutoff value of the PLC was 1.69 × 10⁹/L (sensitivity = 0.496, specificity = 0.839, AUC = 0.677, P = .005).

ROC curve analysis of PPC for predicting myelosuppression in patients administered ICT. The cutoff value of PPC was 240.5 × 10⁹/L (sensitivity = 0.69, specificity = 0.71, AUC = 0.709, P = .001).
Comparison of patients in myelosuppression low- and high-risk groups
According to WHO’s criteria for acute and subacute toxicity of anticancer drugs, patients with grades I to II and grades III to IV myelosuppression were classified as low- and high-risk groups. Among the 71 patients with myelosuppression after ICT, 53 patients in the low-risk group and 18 patients in the high-risk group. As shown in Table 4, there were no differences between low- and high-risk groups associated with sex, age, tumor stage, tumor type, tumor differentiation, PNC, PLC, PMC, LMR, and NLR (all P > .05), while the PPC and PLR of patients in the low-risk group were higher than those in the high-risk group. PHC was lower than those in the high-risk group; the difference was statistically significant (P < .05). Moreover, multiple logistic regression analysis showed that PHC (OR = 1.053, 95% CI = [1.001-1.108], P = .046) was an independent predictor of myelosuppression (Table 5).
Comparison between low- and high-risk groups.

Abbreviations: AST, aspartate transaminase; ALT, aspartate aminotransferase; Fib, fibrinogen; LMR, lymphocyte-to-monocyte ratio; NLR, neutrophil-to-lymphocyte ratio; PAC, pretreatment albumin count; PHC, pretreatment hemoglobin count; PLC, pretreatment lymphocyte count; PLR, platelet-to-lymphocyte ratio; PMC, pretreatment monocyte count; PNC, pretreatment neutrophil count; PPC, pretreatment platelet count; SD, standard deviation; TNM,tumor node metastasis.
Logistic regression analysis of the risk factors for the high-risk myelosuppression group.

Abbreviations: CI, confidence interval; OR, odds ratio; PHC, pretreatment hemoglobin count; PLR, platelet-to-lymphocyte ratio; PPC, pretreatment platelet count; SE, standard error.
Receiver-operating characteristic curve analysis of the high-risk group
To verify the accuracy of hemoglobin for predicting myelosuppression in the high-risk group, we generated ROC curves. As shown in Figure 3, the cutoff value of PHC was 136.5 g/L (sensitivity = 0.833, specificity = 0.5, AUC = 0.687, P = .0018).

ROC curve analysis of PHC for predicting patients at high risk of myelosuppression. The cutoff value of PHC was 136.5 g/L (sensitivity = 0.833, specificity = 0.5, AUC = 0.687, P = .0018).
Relationship between myelosuppression and chemosensitivity
To analyze the significance of the association between myelosuppression and the sensitivity of efficacy after ICT, we analyzed 102 patients, among which 7 were lost during follow-up. Among the remaining 95 patients, 62 achieved an OR and 33 patients had a NOR. Compared with the nonmyelosuppression group (n = 29), patients in the myelosuppression group (n = 66) were more likely to achieve an OR after ICT compared with the nonmyelosuppression group (OR = 2.875, 95% CI = [1.153-7.028], P = .023; Table 6).
Correlation strength between myelosuppression and the sensitivity of efficacy after ICT.

Abbreviations: CI, confidence interval; ICT, induction chemotherapy; NOR, non-OR; OR, overall response.
Of all the patients included in the study, 48 were sensitive to ICT and had myelosuppression, including 44 men (91.67%) and 4 women (8.33%), with an average age of 57.83 years (range, 43-76 years). The clinical stages of tumors in these patients were as follows: stage II, n = 2, 4.17%; stage III, n = 11, 22.92%; and stage IV, n = 35, 72.92%. The degrees of myelosuppression were as follows: I: n = 26, 54.17%; II: n = 10, 20.83%; III: n = 9, 18.75%; and IV: n = 3, 6.25%. According to the RECIST score criteria, 38 patients (79.17%) with PR and 10 patients (20.83%) with CR were evaluated for efficacy after ICT, whereas there were no statistically significant differences between these 2 groups in sex, age, clinical stage of the tumors, and degree of myelosuppression (all P > .05), and similarly, the differences between the PD and SD groups in sex, age, tumor clinical stage, and degree of myelosuppression were also not statistically significant (all P > .05; Table 7).
Clinical characteristics of patients presenting with myelosuppression and sensitive to ICT.

Abbreviations: CR, complete response; ICT, induction chemotherapy; NOR, non-OR; OR, overall response; PD, progressive disease; PR, partial response; SD, stable disease; TNM, tumor node metastasis.
Relationship between myelosuppression and chemosensitivity and patient survival
We followed up 102 patients included in the study and statistically analyzed the relationship between ICT sensitivity and overall survival. The following conclusions were as follows: there was no statistically significant difference in 3-year OS between patients in the myelosuppressed group compared with those in the nonmyelosuppressed group (65.8% vs 54.4%, log-rank P = .257), and there was no statistically significant difference in 3-year OS between patients in the ICT-sensitive and ICT-insensitive groups (64% vs 61.5%, log-rank P = .327). Survival curves are shown in Figures 4 and 5, respectively.

Survival curves of patients in myelosuppressed and nonmyelosuppressed groups (P = .257).
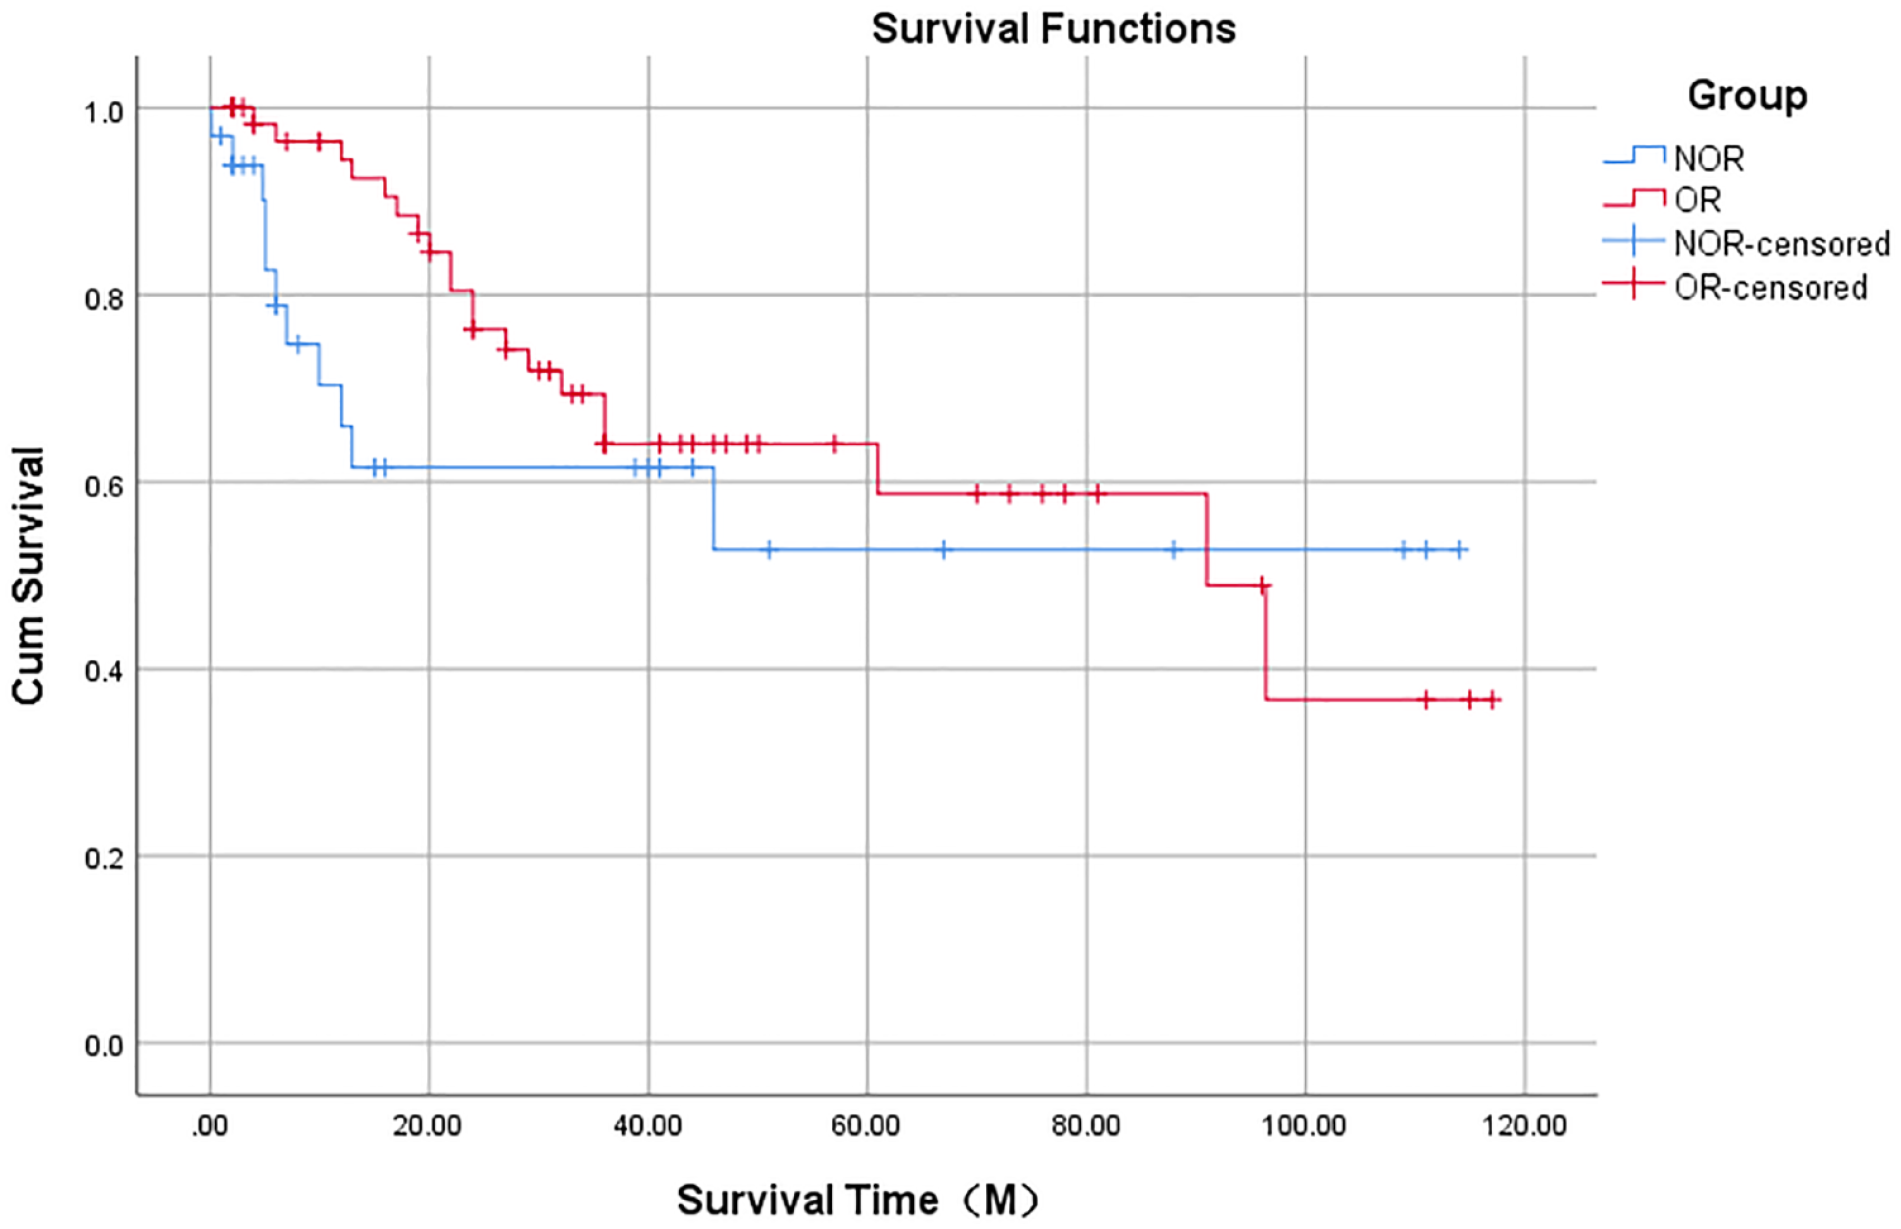
Survival curves for ICT assessing efficacy as OR and NOR (P = .327).
Discussion
Induction chemotherapy has been widely used to treat HNSCC during the past decades. Although chemotherapeutics may be effective for treating cancer, they may cause significant adverse effects, such as renal failure, neurologic abnormalities, audiometric impairment, hepatic, and cardiovascular disease. 10 Myelosuppression, characterized by leukopenia, neutropenia, anemia, and thrombocytopenia, is a common complication associated with chemotherapy. Specifically, myelosuppression is caused by depletion of bone marrow progenitor cells, which will adversely affect the health and quality of life of patients. 11 Furthermore, severe myelosuppression will delay the progress of chemotherapy, affect the therapeutic effect, and may directly lead to death caused by a series of complications such as severe infection and spontaneous visceral bleeding. 6 In a survey of 301 patients with cancer, 88% believe that myelosuppression moderately or significantly affected their lives. 12 Therefore, it is necessary to identify markers that accurately predict myelosuppression, which will help clinicians implement preventive interventions to reduce the incidence of myelosuppression and reduce its adverse consequences.
Although some studies predict the occurrence of myelosuppression, the results are not applicable to clinical practice and are difficult to routinely implement. For example, down-regulation of miR-124-3p expression reduces the severity of myelosuppression in lung adenocarcinoma, 13 and the expression of the miR-122-5p exon affects the degree of myelosuppression in rectal cancer chemotherapy. 14 Furthermore, gene FDG4 rs1239829 is related to grades III to IV leukopenia in patients with esophageal cancer after chemotherapy. 15 Therefore, it is critically important to identify more practical markers that predict myelosuppression.
Recent studies show that inflammatory markers are related to the activity, diagnosis, and prognosis of malignant tumors such as breast cancer, colorectal cancer, and advanced gastric cancer.16-19 Our previous studies found that inflammatory markers can be used to predict the chemosensitivity of HNSCC. 20 In this study, we investigated the value of inflammatory markers for predicting myelosuppression and its severity and analyzed the relationship between myelosuppression and chemosensitivity. To our knowledge, this is first study to propose a role for peripheral blood inflammatory factors in predicting myelosuppression in patients with HNSCC after ICT.
Previous studies always focus on the relationship between the PLC and the response to tumor chemotherapy and prognosis.21,22 For example, a high PLC ratio indicates good prognosis of many tumors. 23 However, little research is available on the role of the PLC in predicting myelosuppression. The multicenter, prospective, noninterference cohort DELFOS study conducted in Spain found a negative correlation between the PLC and the occurrence of myelosuppression in solid tumors like breast cancer. 24 The blood cell level before ICT is an influential factor for myelosuppression in patients with HNSCC. This study found that PLC levels were all lower after ICT than before, which was consistent with Ishizuk et al’s 25 findings that blood cells significantly decreased after chemotherapy. For patients with multiple chemotherapy and with the accumulation of chemotherapy drugs in the body, chemotherapy drugs continue to affect the bone marrow hematopoietic function, and the potential bone marrow injury continues to occur. Patients whose blood cells were at normal low levels prior to ICT were indeed more likely to develop myelosuppression during ICT. Perhaps for this reason, in this study, we show that the PLC served as a predictor of myelosuppression after ICT was administered to patients with HNSCC. To our knowledge, this study reveals for the first time that the PLC serves as a biological marker for predicting myelosuppression of such patients. More research is required to clarify the role of the PLC in the pathogenesis of myelosuppression.
The platelet count is a good indicator of bone marrow reserve and, therefore, may be used to predict the appropriate hematological recovery after chemotherapy and autologous stem cell transplantation. 26 Hematopoiesis (platelet production) mainly occurs in the bone marrow, and the PPC directly reflects the degree of myelosuppression. 27 Here, we show that the PPC served as a marker to predict myelosuppression after ICT is administered to patients with HNSCC. This conclusion is consistent with the findings of other studies. For example, Mari et al demonstrated the predictive value of the PPC in risk factor analysis of myelosuppression in patients with esophageal cancer after they undergo radiotherapy and chemotherapy combined with 5-FU and platinum. Similarly, Tang et al 28 found that a low baseline PPC is a risk factor for grade-4 neutropenia in patients with breast cancer. Although the PPC indicates myelosuppression in the above tumors, our study is the first to determine the significance of the PPC for predicting myelosuppression in HNSCC.
Anemia, which is the most common complication associated with malignant tumors, leads to hypoxia of tumor tissues, promotes angiogenesis in tumors, and confers a more invasive and metastatic phenotype on tumor cells. 29 Zhang et al 30 found that hemoglobin, an important indicator of anemia, effectively predicts myelosuppression in esophageal cancer. Pfeil et al used multiple logistic regression analysis to show that low hemoglobin counts at baseline are significantly related to the incidence of myelosuppression. In contrast, this study found that hemoglobin did not predict myelosuppression in HNSCC, although it was more valuable for predicting myelosuppression in the high-risk group of patients with grades III to IV HNSCC. Kawachi et al’s study showed that the reduction in PHC before chemotherapy was a risk factor for myelosuppression after tumor chemotherapy, and it was also a risk factor for grade III/IV myelosuppression.31,32 This study was similar to its conclusion.
Furthermore, in a study of predictors of severe myelosuppression in pregnant women with low-risk trophoblastic tumors who received a single dose of methotrexate, low PAC and high pretreatment creatinine lead to severe myelosuppression, 33 although these indicators were not verified in this study. We speculate that this may be explained by the differences in tumor types and chemotherapy schemes. Further research is, therefore, required to resolve this inconsistency.
This study shows that patients with myelosuppression after ICT were more sensitive to chemotherapy. Most of the existing chemical drugs such as mitomycin C, methotrexate, anthracyclines, and pyrimidine analogues, which do not specifically recognize tumor cells, reach all parts of the body with the blood circulation and thus indiscriminately attack malignant tumor cells and normal cells of the body. 30 We speculate that the lack of selectivity of chemotherapeutics, while killing tumor cells, will inhibit or kill proliferating hematopoietic cells, particularly granulocytes, leading to abnormal hematopoiesis. 34 Moreover, some studies suggest that the treatment of chemosensitive tumors with hematopoietic growth factors may allow the time intensification of standard-dose chemotherapy, suggesting that the use of antimyelosuppressive drugs is more effective for such tumors. 29 This conclusion indicates that myelosuppression may be related to chemosensitivity. This study is the first to clarify the relationship between myelosuppression and chemosensitivity after ICT for HNSCC. Through regression analysis, we conclude that myelosuppression may reflect the effect of chemotherapy to a certain extent.
Regarding the relationship between ICT sensitivity and patient prognosis, this study did not find a statistically significant relationship between them. At present, there are also some studies focusing on the relationship between patients’ response to ICT and survival. For example, Zhang et al 35 confirmed that response to ICT exerts a critical predictive effect on prognosis of both HPV-positive and HPV-negative oropharyngeal squamous cell carcinoma patients. A similar observation was found in paranasal sinuses squamous cell carcinoma, where the response to IC conferred improved oncologic outcome and organ preservation. 36 Regarding the relationship between myelosuppression and survival, some studies have shown that patients who developed myelosuppression, especially neutropenia, had longer overall survival. 37 In contrast, Tang et al 38 showed that patients who developed ⩾3 degrees of hemoglobinopenia had shorter overall and event-free survival than those who did not. These different results may be due to different tumor types, different chemotherapy regimens, the high rate of lost to follow-up, large amounts of censored data, and a limited number of patients from a single institution.
This study shows that certain inflammatory indicators predict the incidence and severity of myelosuppression in patients with HNSCC-administered ICT, which will enable the clinicians to implement timely preventive measures and to reduce serious consequences. Limitations of this study are inclusion of a limited number of patients with HNSCC treated at our hospital and loss of some patients during follow-up after ICT. Therefore, a larger cohort study is needed to verify our conclusions.
Conclusions
This study shows that the PLC and PPC served as predictors of myelosuppression after ICT was administered to patients with HNSCC and that PHC had greater value for predicting grades III to IV myelosuppression. Furthermore, our findings show that patients with myelosuppression after ICT were more sensitive to chemotherapy.
Footnotes
Acknowledgements
Funding:
The author(s) disclosed receipt of the following financial support for the research, authorship, and/or publication of this article: This work was supported by the Natural Science Foundation of China (grant no. 81972527).
Declaration of conflicting interests:
The author(s) declared no potential conflicts of interest with respect to the research, authorship, and/or publication of this article.
Author Contributions
WS and W-PW conceived and designed the experiment. W-QC and X-LZ collected data. W-QC and LP made statistics. W-QC and WS wrote the manuscript. All authors have read and approved the final manuscript.
Data Availability Statement
The data that support the findings of this study are not publicly available due to their containing information that could compromise the privacy of research participants but are available from the corresponding author on reasonable requests.
Statement of Ethics
The study protocol has been approved by the research institute’s committee on human research.