
Abstract
Background:
Studies suggested irisin’s involvement in insulin sensitivity, conversion of white adipose tissue into brown which is more metabolically active. Studies have been shown negative correlation of irisin levels with presence of diabetes mellitus (DM). Association of irisin levels with body mass index (BMI) and lipid profile could be useful in monitoring metabolic disorders and potential complications in DM.
Methods:
This cross-sectional study enrolled patients which were divided in 3 groups based on diabetes status and BMI: participants without DM, patients with DM, and a normal BMI (<25 kg/m²) and patients with DM and an increased BMI (⩾25 kg/m²). Irisin levels were measured from blood samples and correlation was made with parameters of lipid profile. We wanted to find differences in irisin concentration in comparing groups and to examine the correlation of irisin and metabolic parameters. The relationships between irisin levels and metabolic parameters, including lipid profile and the triglyceride-glucose (TyG) index, were assessed using Pearson’s, and Spearman’s correlation analysis, depending on data distribution.
Results:
Irisin levels were significantly lower in patients with DM compared to non-diabetic individuals, regardless to BMI (patients without diabetes: median 25.47 ng/ml, IQR (22.27-27.54), with diabetes and BMI < 25 kg/m²: 22.16 ng/ml, IQR (19.29-23.76) and patients with diabetes and BMI ⩾ 25 kg/m²: mean ± SD (21.77 ± 5.72) ng/ml, P = .004). Additionally, we report a 1.15-fold decrease in irisin levels in group with diabetes, and BMI < 25 kg/m² compared to non-diabetic individuals and a 1.18-fold decrease in group with diabetes and BMI ⩾ 25 kg/m² compared to non-diabetic individuals. Additionally, lower irisin levels were correlated with higher triglycerides (r = −.343, P = .024), lower HDL cholesterol (r = .363, P = .017), and higher TyG index (r = −.315, P = .04), indicating a potential link between irisin and metabolic dysregulation. No significant association was observed between irisin levels and BMI.
Conclusion:
Our findings suggest that irisin may serve as a biomarker for monitoring metabolic dysregulation in diabetes, particularly in relation to lipid metabolism and insulin resistance. Further research is needed to clarify its role in metabolic disease progression and potential therapeutic implications.
Plain Language Summary
This study looked at a hormone called irisin, which is linked to how the body uses insulin and how it stores fat. Irisin may help convert white fat, which stores energy, into brown fat, which burns energy. Previous research suggests that people with type 2 diabetes tend to have lower levels of irisin, and it may also be connected to cholesterol levels and body weight. Our goal was to see how irisin levels differ in people with and without diabetes, and whether body weight (measured by body mass index-BMI) plays a role. We also looked at how irisin is related to cholesterol, triglycerides (a type of fat in the blood), and the TyG index, which gives an idea of how the body handles sugar and fat. We studied three groups of people: (1) People without diabetes, (2) People with diabetes and a normal body weight, (3) People with diabetes and a higher body weight. We took blood samples and measured irisin levels. We found that people with type 2 diabetes had lower levels of irisin, no matter what their body weight was. Specifically, irisin levels were about 13% to 15% lower in people with diabetes compared to those without. Lower irisin levels were also linked with higher triglycerides, lower “good” cholesterol (HDL), and higher TyG index values, suggesting that lower irisin might be a sign of poor metabolic health. However, irisin levels did not seem to be directly related to body weight alone. Our results suggest that irisin could be a helpful marker for tracking metabolic problems in people with diabetes, especially when it comes to fat and sugar metabolism. In the future, irisin might even become a target for new treatments. More studies are needed to better understand its role and how it might be used to improve care for people with metabolic disorders like diabetes.
Introduction
Irisin is a myokine secreted predominantly by skeletal muscle in response to physical activity, implicated in the regulation of energy expenditure, glucose metabolism, and lipid homeostasis. Emerging evidence indicates that circulating irisin levels are reduced in metabolic disorders such as type 2 diabetes mellitus (T2DM) and obesity; however, its role as a biomarker of metabolic dysfunction remains to be fully elucidated.1,2
Although several studies have explored irisin in relation to either glycemic control or obesity, most have examined these conditions in isolation. This fragmented approach limits our understanding of how irisin behaves in the context of coexisting metabolic disturbances, such as T2DM accompanied by obesity – 2 conditions that frequently occur together and may have synergistic effects on metabolic pathways. Furthermore, few studies have evaluated the association between irisin levels and lipid parameters, despite the central role of dyslipidemia in cardiometabolic risk.3 -5 The potential impact of diabetes duration on irisin concentrations also remains underexplored.
The aim of this study was to analyze the relationship between diabetes, obesity, and circulating irisin levels, with a particular focus on lipid metabolism. We also explored whether diabetes duration influences irisin levels. The findings from this study may provide insight into the metabolic regulation of irisin and its potential role in diabetes and obesity management.
Additionally, a secondary analysis explored the potential association between irisin levels and urinary albumin-to-creatinine ratio (UACR), but this was not a primary focus of the study and should be interpreted with caution.
Methodology
Study Design and Participants
This cross-sectional study was conducted at the Institute of Occupational Health, Niš, Serbia, between February and July 2024. The study protocol was approved by the Ethical Committee of the Institute (Approval No. 304), and all participants provided written informed consent prior to enrollment.
Participants included adult patients (⩾18 years old) of both sexes, categorized into 3 groups based on diabetes status and body mass index (BMI):
Group 1: Participants without diabetes mellitus (DM).
Group 2: Patients with DM and a normal BMI (<25 kg/m²).
Group 3: Patients with DM and an increased BMI (⩾25 kg/m²).
Exclusion criteria included acute or chronic inflammatory conditions, malignancies, and severe hepatic or renal dysfunction (eGFR < 30 ml/min/1.73 m²). Patients using medications known to influence irisin levels (eg, corticosteroids, GLP-1 receptor agonists, or SGLT2 inhibitors) were not excluded, as the study aimed to compare irisin levels in a real-world ambulatory settings. Dietary habits and physical activity were not systematically recorded or controlled for, which we recognize as a limitation.
Sociodemographic and Clinical Assessment
At enrollment, demographic, clinical, and laboratory data were systematically collected from medical records and the hospital’s health information system. All participants were informed about the study protocol and provided written informed consent. Collected data included age, sex, body mass index (BMI), medical history, and key laboratory parameters.
Blood and urine samples were obtained during routine ambulatory visits. Blood samples were processed within 2 hours by centrifugation at 3000 rpm for 10 minutes to separate plasma, and all biological samples were stored at −20°C following standardized protocols to ensure data integrity.
The estimated glomerular filtration rate (eGFR) was calculated using the CKD-EPI formula. Urinary albumin excretion was assessed using the spot urine albumin-to-creatinine ratio (UACR) however, this measure was used for exploratory purposes and was not a primary focus of the study.
Biomarker Measurement
Serum irisin levels were measured using a commercial enzyme-linked immunosorbent assay (ELISA) kit (FineTest; Cat. No: EH4702) with a 1:50 sample dilution. Sensitivity of ELISA test is 0.938 ng/ml, range 1.563 to 100 ng/ml. All assays were performed according to the manufacturer’s protocol, and quality control procedures were implemented to assess assay sensitivity and minimize potential interference from other substances. Each sample was analyzed in duplicate to ensure measurement accuracy and reproducibility.
Urinary albumin-to-creatinine ratio (UACR) was measured using a urine test strips (AVE Science & Technology Co,Ltd.; SN: 20221216), but this parameter was analyzed only as an exploratory variable. The Atherogenic Index (AI) was calculated as log (triglycerides/HDL cholesterol), serving as a marker of lipid-related cardiovascular risk, particularly in metabolic syndrome and insulin resistance
Statistical Analysis
Statistical analyses were performed using IBM SPSS v26.0. Data distribution was assessed using the Kolmogorov-Smirnov test. Depending on distribution characteristics, group comparisons were conducted using:
Student’s t-test for independent samples (normally distributed data),
One-way analysis of variance (ANOVA) for multiple group comparisons with normal distribution, followed by Tukey’s post-hoc test,
Kruskal-Wallis test for non-normally distributed data, with Mann-Whitney test for pairwise comparisons when applicable.
Correlations between variables were assessed using Pearson’s or Spearman’s correlation coefficient, depending on data distribution, and only statistically significant correlations were reported (P < .05).
Continuous data are presented as mean ± standard deviation (SD) or median with interquartile range (IQR). Results are displayed in tables and graphs.
We performed post hoc analysis for estimation of the statistical power of our study collective by ANOVA for 3 groups using G*Power 3.1.9.2. This power analysis with an α error of .05 revealed a statisical power of 97.8% for our sample size.
Result
Baseline Characteristics of Study Participants
Three groups of patients were included: those without diabetes, those with diabetes and normal BMI (<25 kg/m²), and those with diabetes and increased BMI (⩾25 kg/m²). Their key characteristics are presented in Table 1.
Summary of descriptive statistics for demographic characteristics (age, BMI, DM duration) and key laboratory findings (glycemia, blood counts, parameters of kidney function, lipid status, TyG Index) of study participants.
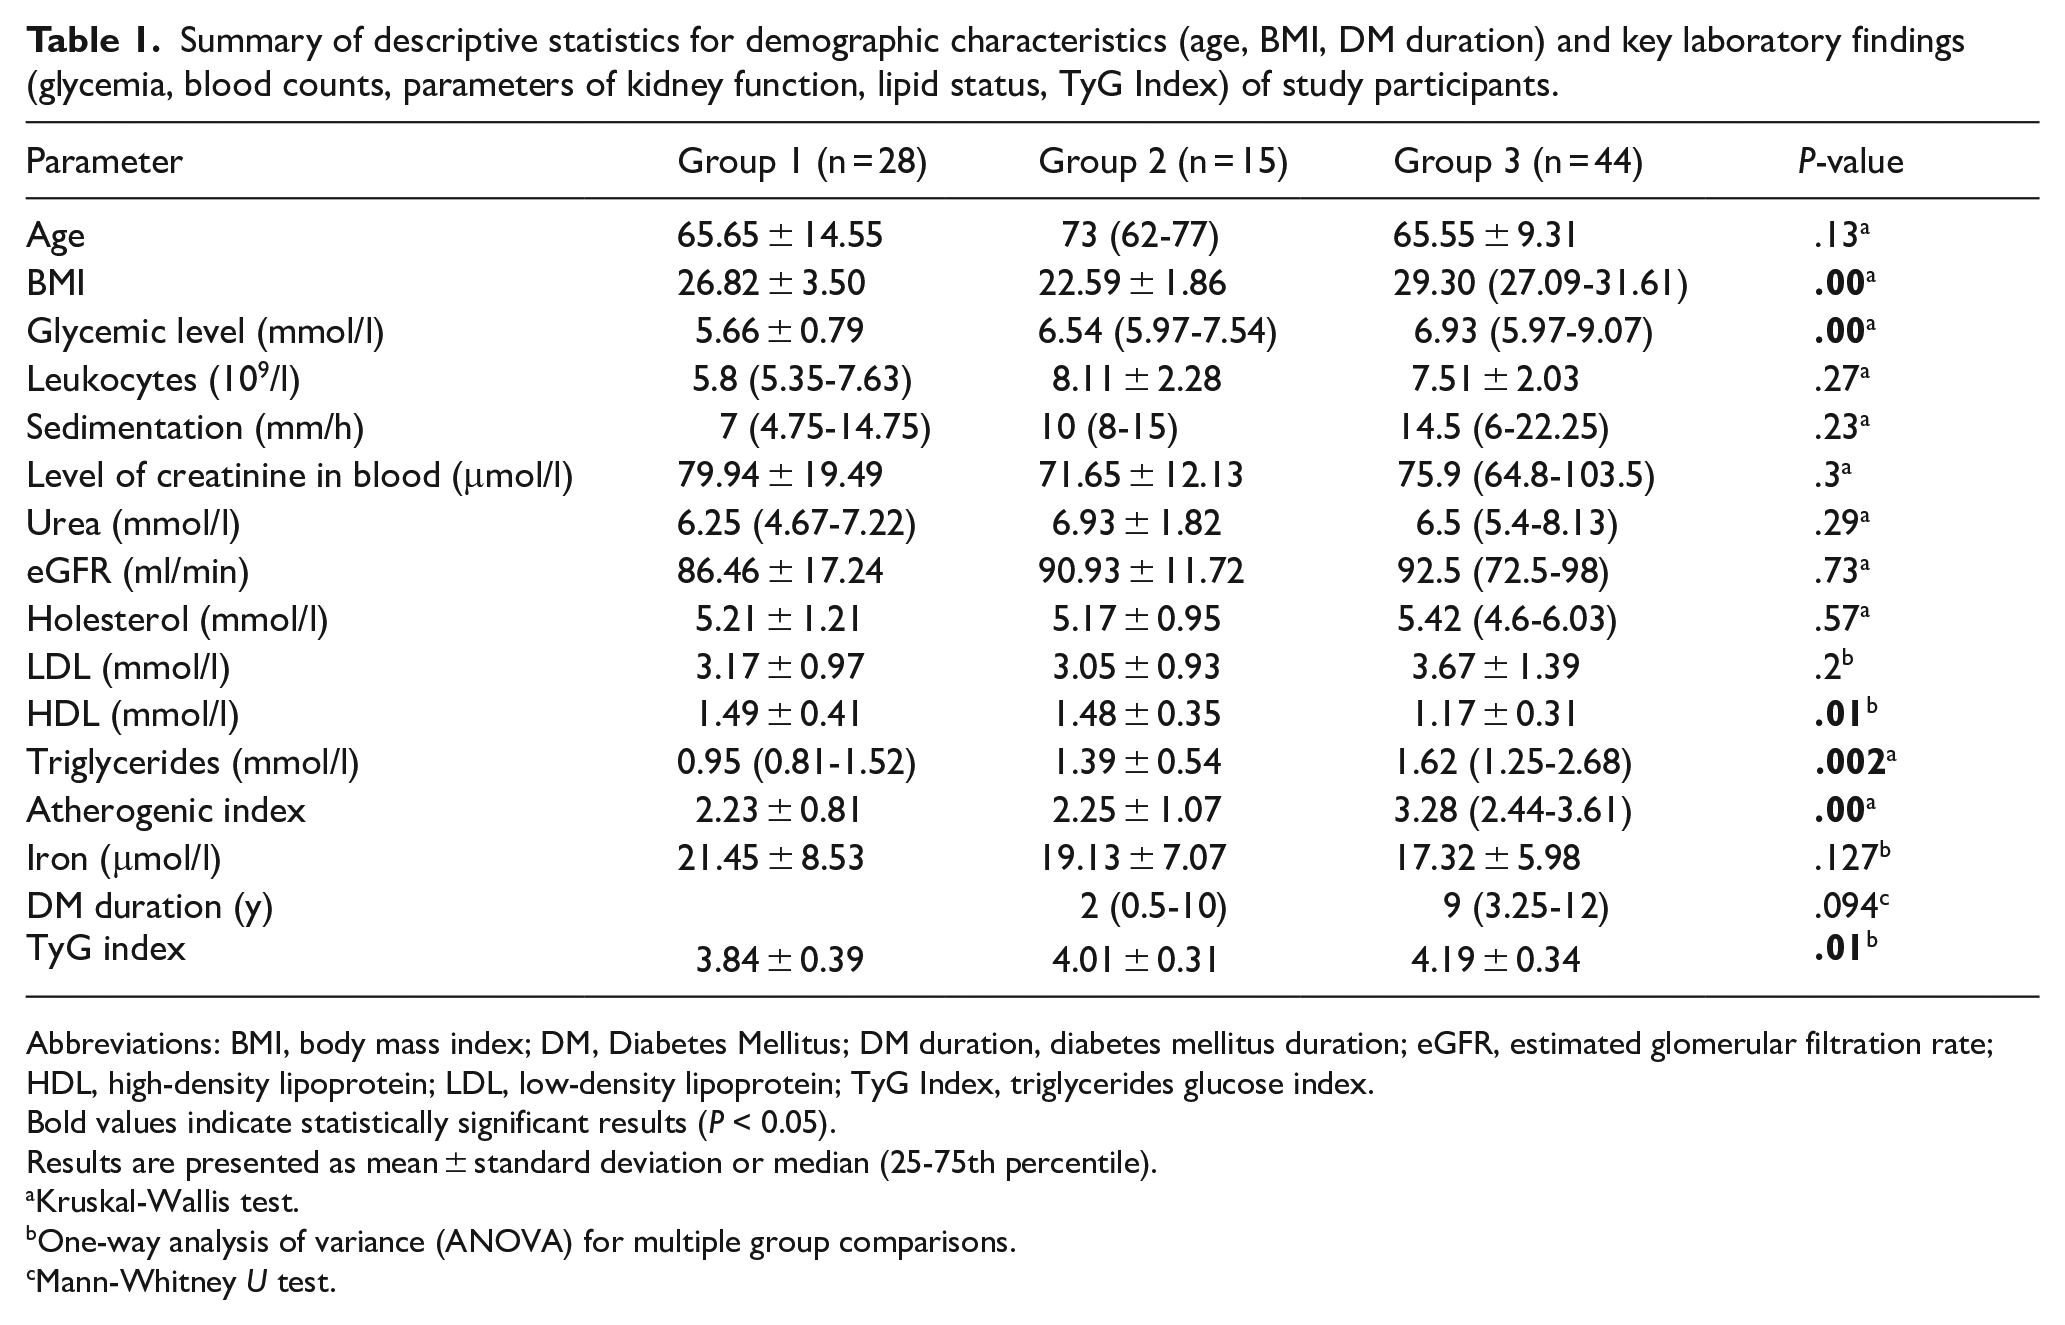
Abbreviations: BMI, body mass index; DM, Diabetes Mellitus; DM duration, diabetes mellitus duration; eGFR, estimated glomerular filtration rate; HDL, high-density lipoprotein; LDL, low-density lipoprotein; TyG Index, triglycerides glucose index.
Bold values indicate statistically significant results (P < 0.05).
Results are presented as mean ± standard deviation or median (25-75th percentile).
Kruskal-Wallis test.
One-way analysis of variance (ANOVA) for multiple group comparisons.
Mann-Whitney U test.
Since BMI and diabetes status were used as classification criteria, the observed differences in body mass and glycemic levels between groups are expected. However, additional variations in metabolic parameters, such as triglycerides, HDL cholesterol, and markers of insulin resistance, may also be present, reflecting the broader impact of diabetes and obesity on metabolic homeostasis.
The study included a total of 87 patients, of whom 59 (67.8%) had diabetes. Patients were categorized into 3 groups: 28 (32.2%) without diabetes, 15 (17.2%) with diabetes and BMI < 25, and 44 (50.6%) with diabetes and BMI ⩾ 25. The study sample consisted of 51 (58.6%) male and 36 (41.4%) female participants.
Differences in Irisin Levels Among Groups Based on Diabetes and BMI
Irisin levels differed among the 3 groups, with the highest values observed in patients without diabetes (25.47 ng/ml, IQR 22.27-27.54), followed by those with diabetes and BMI < 25 (22.16 ng/ml, IQR 19.29-23.76), and the lowest levels in patients with diabetes and BMI ⩾ 25 (21.77 ± 5.72 ng/ml). The Kruskal-Wallis test indicated a statistically significant difference in irisin levels among the groups (H = 10.93, P = .004). Post-hoc analysis revealed that both diabetic groups had significantly lower irisin levels compared to the non-diabetic group (P = .001 for diabetes with BMI ⩾ 25 vs non-diabetes; P = .036 for diabetes with BMI < 25 vs non-diabetes), while the difference between the 2 diabetic groups was not statistically significant (P = .706). The stepwise decline in irisin suggests that diabetes itself is associated with reduced irisin production, potentially due to chronic hyperglycemia, inflammation, or skeletal muscle dysfunction.
A graphical representation of irisin levels across groups is shown in Figure 1.

Distribution of irisin levels across study groups based on diabetes status and Body Mass Index Data in Group 1 and 2 are medians and interquartile ranges (IQR) (25.47 ng/ml, IQR 22.27-27.54; 22.16 ng/ml, IQR 19.29-23.76) and in Group 3 is mean with standard deviations (21.77 ± 5.72 ng/ml). P-values refer to Kruskal-Wallis test for differences between groups.
Correlation of Irisin Level and Lipid Profile
A significant positive correlation was observed between irisin levels and HDL cholesterol in patients with diabetes and BMI ⩾ 25 (Group 3) (r = .363, P = .017), suggesting a possible association between higher irisin levels and an improved lipid profile, particularly through its link with HDL metabolism (Figure 2). Conversely, a significant negative correlation was found between irisin levels and triglycerides in the same group (r = −.343, P = .024; Figure 3).

Correlation of irisin level and HDL in Group 3 (n = 44).
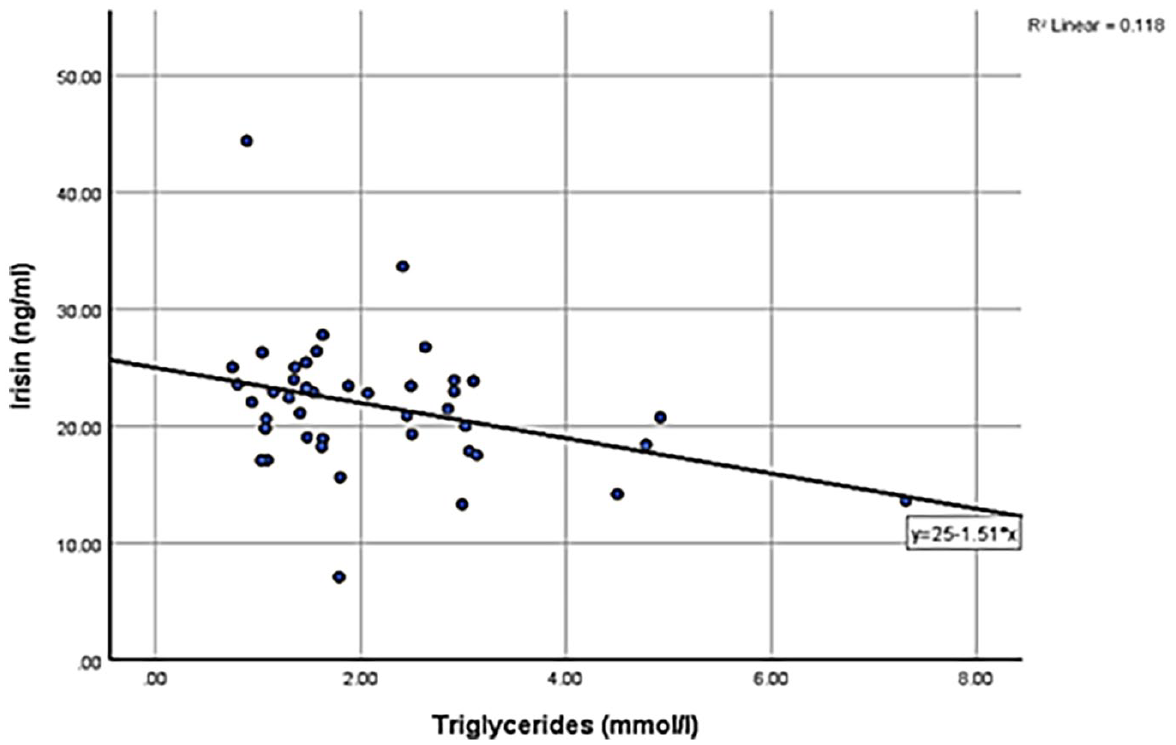
Correlation of irisin level and triglycerides in Group 3 (n = 44).
Additionally, triglyceride levels were significantly higher in Group 3 compared to Group 1 (H = 12.46, P = .002; post-hoc P = .01), consistent with the well-documented relationship between obesity, insulin resistance, and elevated triglycerides. To further explore the link between irisin and insulin resistance, the triglyceride-glucose (TyG) index was analyzed. While no significant correlation was found in Groups 1 and 2, a significant negative correlation was observed in Group 3, indicating that lower irisin levels were associated with higher TyG index values (r = −.315, P = .04; Figure 4). The negative correlation between irisin and the triglyceride-glucose (TyG) index in this group further supports a potential role for irisin in insulin sensitivity. The absence of such correlations in non-diabetic or non-obese individuals suggests that irisin’s metabolic effects may become more apparent in the context of metabolic dysregulation. Its correlations with HDL, triglycerides, and TyG Index highlight its potential as a biomarker for metabolic health and possibly a therapeutic target.

Correlation between irisin and TyG Index in Group 3 (n = 44).
No significant correlations were found between irisin levels and LDL cholesterol, total cholesterol, or the Atherogenic Index.
These findings suggest that lower irisin levels may be linked to disruptions in lipid metabolism, particularly in conditions characterized by metabolic dyslipidemia such as diabetes and obesity.
Taken together, these findings support the hypothesis that lower irisin levels contribute to the progression of metabolic dysfunction in type 2 diabetes. Irisin may therefore serve as both a biomarker of disease severity and a potential therapeutic target in metabolic disease. Its decline may exacerbate insulin resistance, especially in obese individuals with type 2 diabetes.
Correlation of Irisin Level and Diabetes Mellitus Duration
There was not significant correlation between irisin levels and DM duration (Group 2 P = .628, Group 3 P = .559).
Exploratory Analysis: Irisin and Kidney Function
Although this study primarily focused on the relationship between irisin levels, diabetes, and metabolic parameters, an additional exploratory analysis was conducted to assess its potential association with kidney function. Patients were categorized based on urinary albumin-to-creatinine ratio (UACR), but no clear trend in irisin levels was observed. A statistically significant difference was detected between the UACR-based groups, but the biological relevance of this finding remains unclear. Given the limited sample size and the cross-sectional nature of the study, further research is needed to determine whether irisin plays a role in renal function or whether these findings reflect confounding factors. These results should be interpreted with caution.
Discussion
Irisin is a myokine primarily secreted by skeletal muscles in response to physical activity, with a well-established role in energy metabolism and glucose homeostasis. Recent studies have suggested that irisin may also be involved in lipid metabolism and metabolic dysregulation associated with diabetes and obesity.2,6 Our study aimed to explore the relationship between circulating irisin levels, diabetes, and obesity, as well as its potential associations with lipid parameters. Our results indicate that circulating irisin levels were significantly lower in patients with type 2 diabetes compared to non-diabetic individuals, regardless of BMI. This finding aligns with previous research suggesting that irisin secretion may be impaired in diabetes, potentially due to chronic hyperglycemia and altered insulin signaling. Contrary to some prior studies that reported a negative correlation between irisin and BMI, we did not observe a significant difference in irisin levels based on BMI alone.7 -9 This may be attributed to differences in study populations, variations in metabolic status, or compensatory mechanisms that regulate irisin expression in adipose and muscle tissues. Unlike previous studies that primarily examined irisin in the context of obesity or insulin resistance, our study highlights its potential role in lipid metabolism and metabolic dysregulation in a real-world ambulatory setting.
We also observed a significant association between irisin levels and lipid metabolism. Lower irisin levels were correlated with higher triglycerides and lower HDL cholesterol in the diabetic obese group, findings that are consistent with previous reports linking irisin to metabolic dyslipidemia. Additionally, a significant inverse correlation was observed between irisin and the TyG Index in Group 3, further supporting its potential role in metabolic dysregulation. The Triglyceride-Glucose Index (TyG) is a well-established biomarker of insulin resistance. Previous studies have demonstrated its strong association with prediabetes, type 2 diabetes, and a range of metabolic and cardiovascular disorders.10,11 These relationships point to a potential role for irisin in lipid metabolism and insulin sensitivity. Notably, no significant correlations were found with LDL cholesterol or total cholesterol, suggesting that irisin may be more closely associated with specific aspects of the lipid profile rather than generalized lipid levels. These findings contribute to a growing body of evidence positioning irisin as a promising biomarker in the context of metabolic disorders. The consistent negative correlation with TG and insulin resistance (TyG Index) and the positive association with HDL suggest that irisin could serve as a useful indicator of cardiometabolic health.
Several mechanisms may explain the observed reduction in irisin levels in diabetes. It has been suggested that while insulin initially stimulates irisin secretion, prolonged hyperinsulinemia and insulin resistance may lead to compensatory downregulation of irisin production. Additionally, chronic inflammation and oxidative stress in adipose tissue and skeletal muscles may impair FNDC5 gene expression, reducing irisin secretion. Another possible explanation for lower irisin levels in diabetes is its role in the browning of white adipose tissue. Irisin promotes the expression of uncoupling protein 1 (UCP1), which has been linked to enhanced lipid oxidation and metabolic regulation; however, its exact role in diabetes remains to be fully elucidated.4,6,8,12
While our findings contribute to understanding the metabolic role of irisin, several limitations must be acknowledged. First, the study was cross-sectional, limiting the ability to infer causality between irisin levels and metabolic alterations. The study’s cross-sectional nature limits the ability to infer causality between the variables studied. While associations can be identified, temporal relationships cannot be established. Longitudinal studies are needed to determine whether changes in irisin precede or follow metabolic dysregulation. Second, we did not directly measure insulin resistance using gold-standard methods such as the HOMA-IR index, which would provide a more precise assessment of the relationship between irisin and glucose metabolism. This is a recognized limitation, and we suggest that future studies incorporate such measures to strengthen metabolic profiling.
We are aware that factors such as diet, medications, and physical activity can influence metabolic outcomes; however, our aim was to present cross-sectional data from a real-life ambulatory care setting.
Additionally, an exploratory analysis assessed the potential relationship between irisin and urinary albumin-to-creatinine ratio (UACR), but this was not a primary focus of the study. While a significant difference in irisin levels was observed between UACR-based groups, the biological relevance of this finding remains unclear and requires further investigation.
Finally, potential sex-based differences in irisin levels were not analyzed, despite evidence suggesting hormonal influences on irisin regulation.
From a clinical perspective, irisin holds promise both as a diagnostic biomarker and potentially as a therapeutic target. In the management of patients with type 2 diabetes and obesity, measurement of circulating irisin levels could offer additional insight into the severity of metabolic dysfunction and residual insulin sensitivity. For instance, patients with particularly low irisin levels might benefit from targeted lifestyle interventions aimed at increasing muscle activity, such as resistance training or aerobic exercise, which have been shown to upregulate irisin expression.
Additionally, if future studies confirm causality, therapeutic strategies aimed at increasing irisin – either through pharmacologic agents or gene therapy – could represent a novel avenue for improving insulin sensitivity and lipid profiles. However, these applications remain speculative, and further research is needed to fully elucidate the mechanisms and therapeutic potential of irisin.
Conclusion
Our study demonstrated that circulating irisin levels are significantly lower in patients with type 2 diabetes, irrespective of BMI, and that lower irisin levels are associated with an unfavorable lipid profile and insulin resistance markers. These findings reinforce the potential role of irisin as a biomarker for monitoring of metabolic disturbances in type 2 diabetes. Future research should focus on elucidating the mechanistic role of irisin in metabolic pathways and determining whether modulation of irisin levels could offer a therapeutic avenue for managing metabolic disorders.
Footnotes
Acknowledgements
The authors would like to thank the Ministry of Science, Technological Development and Innovation of the Republic of Serbia (No. 451-03-65/2024-03/200113; 451-03-66/2024-03/200113). The authors would also like to thank the doctors of the Institute of Occupational Health, Nis, Serbia, prim. dr spec. Dragan Djordjević and dr Milica Niznar.
Authors’ Note
All authors critically reviewed the manuscript for important intellectual content; all authors gave approval of the version to be submitted; all authors agree to be account able for all aspects of the work.
Ethical Considerations
Granted by the Ethical Committee of the Institute of Occupational Health, Nis, Serbia (Approval No. 304) from 14.02.2024.
Consent to Participate
All participants were informed about the study protocol and provided written informed consent.
Author Contributions
Sanja Stanković: Conceptualization; Data curation; Formal analysis; Investigation; Methodology; Writing - original draft; Writing - review & editing. Valentina N. Nikolić: Conceptualization; Methodology; Writing - original draft; Writing - review & editing. Nikola Krstić: Formal analysis; Investigation; Writing - original draft; Writing - review & editing.
Funding
The author(s) received no financial support for the research, authorship, and/or publication of this article.
Declaration of Conflicting Interests
The author(s) declared no potential conflicts of interest with respect to the research, authorship, and/or publication of this article.