
Abstract
Background:
Obesity, insulin resistance, and dyslipidemia may impact ventricular repolarization in children.
Objectives:
The study aimed to identify the relationship between various metabolic indicators and ventricular repolarization indices among obese children compared to healthy ones.
Methods:
A case-control study included 90 children, divided into two groups: 45 obese children (cases) and 45 children with normal weight (controls). Electrocardiogram (ECG) readings were analyzed to calculate several parameters, including corrected QT (QTc), QTc dispersion (QTcd), JTc dispersion, and the TpTe interval, using 12-lead surface ECGs. Both groups were also assessed for lipid profiles, fasting plasma glucose (FPG), and serum insulin to calculate the Homeostatic Model Assessment of Insulin Resistance (HOMA-IR).
Results:
Obese children had significantly higher serum levels of triglycerides, cholesterol, LDL, fasting insulin, and HOMA-IR compared to controls. Also, they significantly had longer mean values of QTcd and JTcd with no significant difference in TpTe interval between both groups. A significant positive correlation was detected between QTc and JTc dispersion and the following variables: waist circumference, body mass index (BMI), blood pressure, fasting insulin, HOMA-IR index, and LDL. Additionally, no significant difference was revealed between obese children with and without metabolic syndrome regarding ventricular repolarization ECG parameters.
Conclusion:
Greater JTc dispersion (ms) and QTc dispersion (ms) were observed in obese children with a positive correlation to waist circumference, BMI, and insulin resistance.
Plain language summary
Study aims to detect the relation between different metabolic indicators and ventricular repolarization indices. Methods: forty-five obese children whose body mass index (BMI) percentile was greater than the 95% were enrolled, along with 45 children who had normal weight and served as the control group. BMI and waist circumference (WC) were taken, Corrected QT(QTc), QTc dispersion (QTcd), JTc dispersion (ms) and TpTe interval were all calculated from the 12 leads surface ECG. Lipid profile, fating blood sugar and serum insulin for calculation of HOMA-IR were assessed for both groups. Results: Mean QTcd and JTcd values were found to be significantly longer in the obese children while no changes in TpTe interval than the control group, abnormal lipid profile and hyperinsulinemia were noticed in obese group. QTcd and JTcd were positively correlated with BMI, WC, HOMA-IR and serum LDL. Conclusion: ventricular repolarization indices were affected in obese children in correlation to their metabolic indicators.
Introduction
Obesity is a major public health concern influenced by biological, developmental, environmental, behavioral, and genetic factors. Excessive calorie intake without sufficient physical activity is a common contributor to childhood and adolescent obesity. 1 Juvenile and teenage obesity rates have significantly surged over the past few decades and overweight has reached epidemic levels. 2
Numerous metabolic diseases, including dyslipidemia, reduced high-density lipoprotein (HDL), insulin resistance, hyperglycemia, hypertension, and pro-inflammatory state, are linked to obesity increasing the risk of cardiovascular diseases. 3
The main initiating factors of cardiac problems in obese children are increased endothelial dysfunction related to the formation of free fatty acids and fibrous plaques. These diseases cause early problems with cardiac repolarization according to several studies. 4
It is consistent across studies, that there’s a relationship between ECG changes and obesity, as metabolic abnormalities like insulin resistance which is a prominent feature of pediatric obesity; it is believed to be associated with electrocardiographic abnormalities as longer PR intervals and pathological Q waves, higher values of QT dispersion. 5
It is highlighted that alterations in ventricular repolarization seen in obese people play a significant role in ventricular arrhythmic events, mortality, and sudden death. Early detection of obesity and prevention of these consequences is crucial, even in childhood. 6
A prolonged QT interval is recognized as a marker of abnormal ventricular repolarization. Novel repolarization markers are categorized into 2 groups: early and late repolarization indices. 7 Early repolarization indices include the JTpeak interval, while late repolarization indices include the Tpeak-Tend interval (Tp-e). 7
Rationale of the study
Despite the extensive research on cardiovascular health risks in obese children, there is little insight into understanding the relationship between ventricular repolarization ECG changes and parameters such as anthropometric measures, insulin resistance, and lipid profile abnormalities in this population. Hence, we can prevent such changes by proper management of childhood obesity.
So, this study aims to detect the relationship between various metabolic indicators and ventricular repolarization indices among obese and normal-weight children (primary objective). Additionally, it seeks to compare ventricular repolarization indices between obese children with and without metabolic syndrome and healthy ones (secondary objective).
Methods
Study design, setting, and population
A case-control study, from July 2023 to June 2024, was conducted among ninety Egyptian children, randomly selected from pediatric outpatient clinics at Al-Azhar University Hospital. The sample size was calculated using G* Power 3.1 software https://www.statisticssolutions.com/how-to-determine-sample-size-from-gpower/ considering 0.05 as an α-error and 80% as the power with using the mean difference of ECG parameters between children of normal weight and obese children from earlier studies. 8
The children in the study were divided into 2 age- and sex-matched groups, with a case-to-control ratio of 1:1. Of the total 90 children, 45 were classified as obese (cases) and 45 as normal weight (controls). The case group was further subdivided based on the presence of metabolic syndrome: 33 children were categorized as obese without metabolic syndrome, while 12 children were classified as obese with metabolic syndrome. 9
Inclusion criteria
The study included children aged 6 to 18 years. The case group consisted of those with a body mass index (BMI) at or above the 95th percentile, while the control group included children with a BMI between the 5th and 85th percentiles, following the Centers for Disease Control and Prevention (CDC) standardized BMI percentile criteria. 10
Exclusion criteria
Children with idiopathic or secondary cardiomyopathies, pericardial or valvular diseases, congenital cardiac disease, or chronic illnesses were excluded from the study.
Study tools and procedures included the following
- Measurement of the subject’s waist circumference (which is used to estimate central obesity) by horizontally encircling their body with plastic tape halfway between the iliac crest and the lower ribcage. 11
Blood pressure measurements
- We measured blood pressure (BP) following the steps based on the European Society of Hypertension (ESH), as the child was seated in a quiet, comfortable environment with their back supported, feet flat, and arm resting on a table. As children were fasting, so no effect of stimulant substances (eg, cocoa or cola), and they had no exercise within 30 minutes before the measurement. We selected the appropriate cuff size by measuring the mid-upper arm circumference at the midpoint between the elbow and shoulder and positioned the cuff on the arm above the antecubital fossa. After 3-5 minutes of rest, we took the first BP measurement, followed by 2 more readings at 2-minute intervals. The average of the last 2 measurements was the ambulatory BP value. 12
- Children’s SBP and DBP levels above the 95th percentile were considered high, according to the American Academy of Pediatrics. 13
Laboratory analysis
- Following a 10-hours fast, a blood sample was taken to evaluate the fasting insulin, fasting plasma glucose and lipid profile. Venous blood was drawn (5 mL), split into 2 serum-separator tubes, and centrifuged for 10 min at 3500 rpm.
- The following measurements were made using 3 mL: fasting plasma glucose (FPG), triglycerides, total cholesterol, HDL, and LDL by Cobas Integra 400 Plus; Roche Diagnostics, Germany.
- Fasting plasma glucose level ⩾100 mg/dL considered abnormal glucose level. 14 A total cholesterol value of 170 mg/dL, an LDL-C value of 130 mg/dL, an HDL-C value of 45 mg/dL, and a triglyceride value of 130 mg/dL were considered abnormal lipid profiles. 15
- For the analysis of fasting insulin, the remaining part of the serum was frozen at −20°C till the time of analysis. The test range for the ELISA kit, which was provided by DiaMetra Company, Italy, was 3-200 IU/mL. Using fasting insulin and plasma glucose, HOMA-IR was computed using the following formula: HOMA-IR = FPG × fasting insulin⁄405.
Electrocardiographic measurements
A standard physical examination was followed by a 12-lead body surface ECG while the patient was breathing freely and supine. With the paper speed set at 25 mm/s, the gain was adjusted to 10 mm/mV. The QT interval (QTi), QT dispersion (QTd), R-R intervals, heart rate (HR), and corrected QT interval (QTc) were all assessed. The QTi (ms) was measured from the beginning of the Q wave to the end of the T wave at the point of return to the isoelectric line. QTc = QT/√RR (Bezett's formula) was used to calculate QTc after heart rate correction. Calculating QTcd involved by subtracting the longest and shortest QTc observed in the 12-lead ECG data. Measurements were averaged over at least 3 consecutive cardiac cycles for each lead. 16
In children 1-15 years of age, a QTc >440 ms is considered to be the borderline upper limit of the QTc interval, while QTc >460 ms is considered prolonged according to the national guidelines. 17 Normal values for children >15 years as in adults, the QTc ranges from 350 to 450 ms for men and from 360 to 460 ms for women.18,19 QTcd normally ranges from 47.3 ± 16.6. 20
- By deducting the QRS duration (normal range from 30 to 100 ms) from the QT or QTc interval on the surface ECG, the JT and JTc intervals were measured. In children 1-15 years of age JTc interval ranges normally from 360 to 420 ms. 19 The difference between the longest and shortest JTc interval durations is known as JT corrected dispersion (JTcd). 21
- TpTe interval was measured in milliseconds (ms) by measuring the T wave's peak to the point where the isoelectronic line at lead V5 and the tangent at the steepest point of the T wave's downslope intersect, 22 Nathan et al. 23 assert that normal transmural dispersion of repolarization (TDR), as measured by Tp-e interval in children “is 40 to 50 milliseconds with the upper limit of normal considered to be 65 milliseconds. A TDR of 75 milliseconds has been found in patients with LQTS.
- Performed measurements were analyzed by two cardiologists, and the methods for obtaining them are outlined in Supplemental Table S1.
Data management and statistical analysis
Statistical analysis was performed using SPSS version 26 (IBM, Armonk, NY). Before analysis, the data were thoroughly filtered to ensure accuracy, consistency, and completeness. Categorical variables were summarized as frequencies and percentages, while continuous variables were presented as mean ± standard deviation (SD). For comparisons of continuous variables between 2 groups, we employed the independent samples t-test. When comparisons involved more than 2 groups, we utilized one-way analysis of variance (ANOVA), followed by Tukey’s post-hoc test to identify specific group differences contributing to overall statistical significance. Pearson’s correlation coefficient (r) was calculated to examine relationships between continuous variables reporting strength and direction. Statistical significance was defined as a P-value ⩽ .05.
Results
There were no significant differences between the 2 groups regarding mean age or gender distribution. Additionally, there was a significant rise in BMI, waist circumference, and level of blood pressure among obese children compared to controls. Obese participants had also significantly higher serum levels of triglycerides, cholesterol, LDL, HOMA-IR, and fasting insulin; these results are displayed in Table 1 and (Figure 1).
Demographic, anthropometric, and laboratory profile of the studied children.

Abreviation: n = number.
In concern to ECG parameters, obese children exhibited notably greater JTc dispersion (ms) and QTc dispersion (ms) in comparison with controls (Figures 1–3). However, there was no significant difference in heart rate, P duration, P-R interval, QRS duration, and Tp-e interval (ms) (Figure 1) between the 2 groups. Although the two groups QRS axes differed significantly from one another, both remained within the normal range as shown in Table 2.
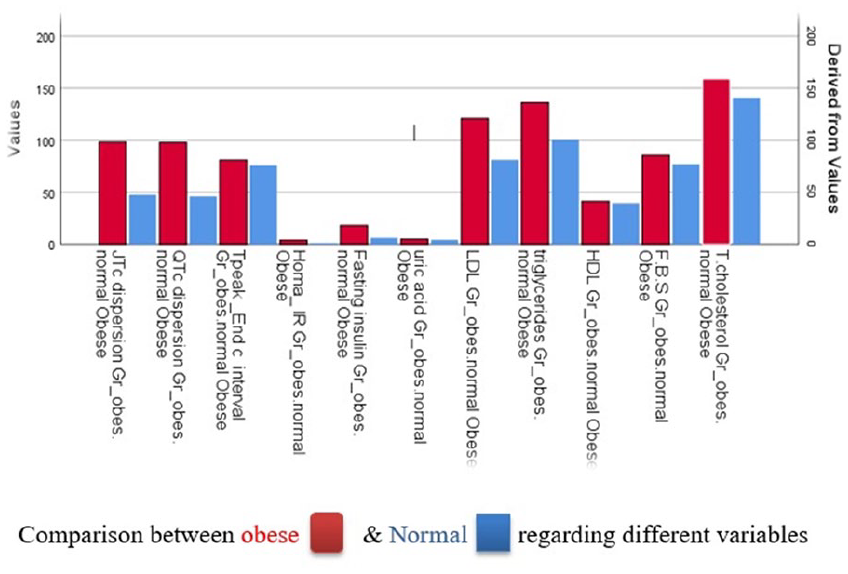
Shows comparison between obese and normal children regarding different variables.

Shows normal child with normal QTcd, JTcd, and Tpe intervals.
ECG parameters of the studied children.

Abbreviations: Gr, Group; n, number.
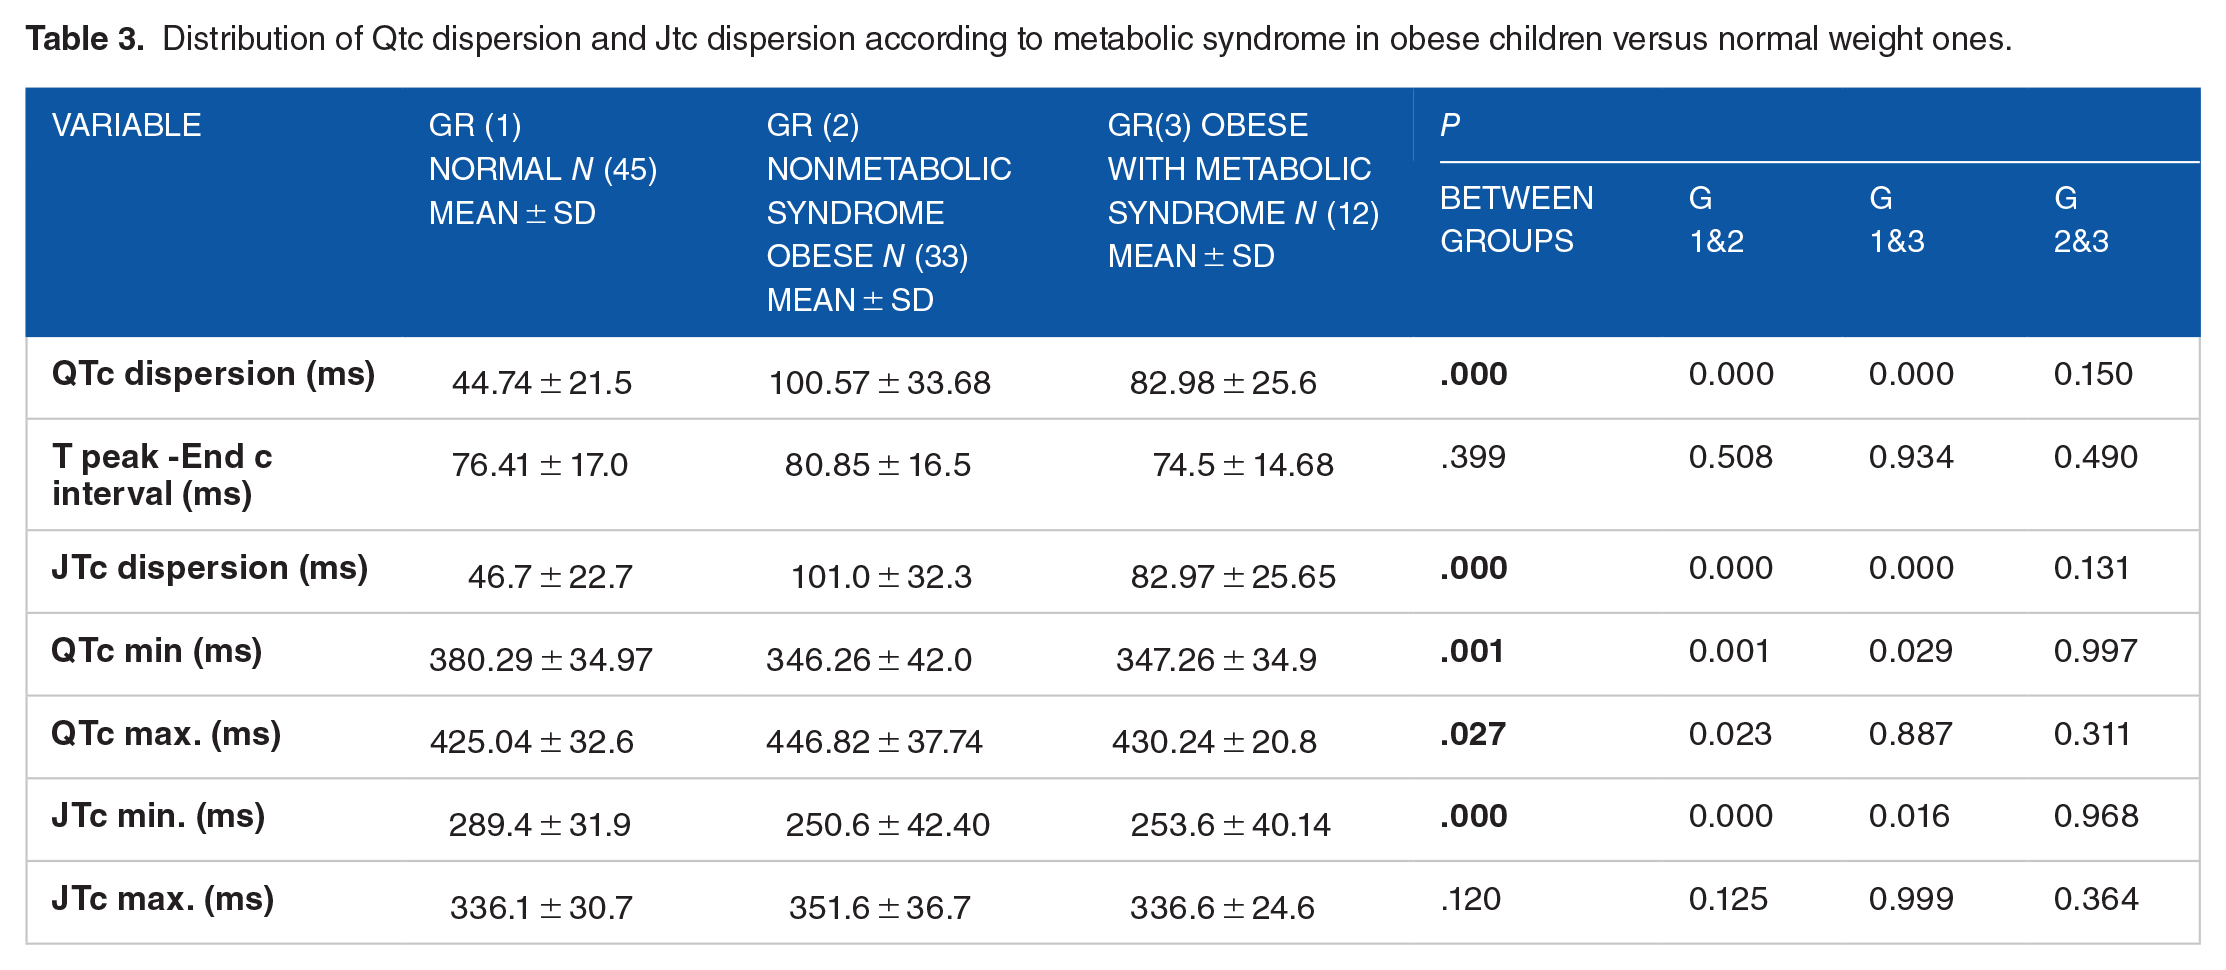
Table 3 illustrates no significant difference between obese children with and without metabolic syndrome regarding ventricular repolarization ECG parameters.
Distribution of Qtc dispersion and Jtc dispersion according to metabolic syndrome in obese children versus normal weight ones.
In the correlation analysis shown in Tables 4 and 5, there was a significant positive correlation between both QTc and JTc dispersion and the following variables: waist circumference (Figures 4 and 5), BMI (Figures 6 and 7), SBP, DBP, fasting insulin, HOMA-IR index, and LDL. Conversely, the QRS axis exhibited negative correlations with waist circumference, BMI, serum LDL, HOMA-IR, and fasting insulin.
Correlation of ECG parameters with anthropometric measures and blood pressure among obese children.

Significance level ≤ .05.
Correlation of ECG parameters with lipid profile and insulin resistance parameters among obese children.

Significance level ≤ .05.

Shows obese child witth prolonged QTcd, JTcd, and Tpe intervals.

Shows correlation between waist circumference (WBC) and QTc dispersion (r = .618).

Shows correlation between waist circumference (WBC) and JTc dispersion (r = .606).

Shows correlation between body mass index (BMI) and QTc dispersion (r = .606).

Shows correlation between body mass index (BMI) and JTc dispersion (r = .582).
Discussion
The main initiating factors of cardiac problems in obese children are increased endothelial dysfunction related to the formation of free fatty acids and fibrous plaques. These diseases cause early problems with cardiac repolarization according to several studies. 24
ECG is a simple, non-invasive, cost-effective, and widely available method with good reproducibility for detecting the harmful effects of obesity on cardiovascular outcomes. This includes identifying left ventricular hypertrophy (LVH) using several criteria, despite the generally low sensitivity and specificity of most ECG methods in detecting LVH. 25 For example, the sensitivity of 8%-40% for Sokolow–Lyon voltage and 2%-41% for Cornell voltage criterion. 26 The specificity is relatively decent and ranges 53%-100% and 89%-100% respectively, for criterion mentioned before. 26 Numerous publications have reported improvements in the sensitivity and specificity of these methods by adjusting the LVH criteria for BMI, waist-to-hip ratio (WHR), and incorporating visceral fat levels.27 -29 Additionally, ECG can detect abnormalities such as” QRS prolongation, T wave abnormalities, QT durations, and various types of arrhythmias.” 30
Kaplan et al. 31 observed that individuals with increased epicardial fat thickness showed elevated ECG repolarization parameters, including QTc, QTcd, and Tp-e intervals, which could suggest a higher risk of ventricular arrhythmias."
The study found no significant differences in the P wave, PR intervals, or QRS durations between obese children and the healthy control group, consistent with Dağlı et al. 24 However, Sun et al. 32 reported longer PR intervals and greater QRS durations in overweight or obese children, while Sobhani et al. 33 observed a link between extended QRS duration and cardiovascular risk factors, including hypertension, high BMI, elevated LDL and triglycerides, and low HDL levels.
In the current study, a significant decrease in QRS axis degree was observed in obese children, though still within the normal range. This contrasts with Sun et al., 32 who found leftward changes in the frontal P-wave and QRS axis in obese children. Additionally, the QRS axis was negatively correlated with serum HOMA-IR, LDL, BMI, and WC in our study. Kurisu et al. 34 also reported an inverse relationship between BMI and the QRS axis, noting a leftward shift as BMI increased. Similarly, Kumar 35 found an inverse relationship between the QRS axis, BMI, waist circumference, and insulin resistance in non-obese hypertensive adults.
The present study found higher QT corrected dispersion (QTcd) in obese children compared to controls, consistent with Dağlı et al., 24 who reported significantly higher QT dispersion (QTd) and QTcd in obese children. Similarly, Nigro et al. 8 observed elevated QTcd in obese children. Inanir et al. 36 and Yildirim et al. 37 demonstrated that obese children might show an early increase in QT and QTcd on ECGs. In contrast to previous findings, a study by Orgun and Akbaş 6 reported no significant differences in QTc interval and QTcd between obese children and controls. The higher QTcd values observed in the current study may be due to autonomic neuropathy in obesity, which can cause sympathetic dysregulation and lead to an extended QTc interval. 38
The study found a positive correlation between waist circumference, BMI, and QTcd, suggesting that both general and central obesity may contribute to ventricular repolarization delay, as indicated by QTcd prolongation. This finding is supported by Seyfeli et al, 39 who found a positive correlation between BMI and QTcd, and by Piché et al., 40 who linked waist circumference to cardiometabolic disease and cardiovascular disease (CVD).
This study identified a relationship between hyperinsulinemia, HOMA-IR, and prolonged QTcd, suggesting that insulin resistance in obese children and adolescents may contribute to QTcd prolongation. This is consistent with Nigro et al. 8 and in contrast with Guler and Oran. 41 This can be explained by increasing sympathetic nerve activity due to high insulin levels which raise cardiac cell membrane refractoriness and prolong the QTc interval, 42 while insulin-induced hypokalemia can further extend the QTc interval. 43
Increased LDL cholesterol stiffens cell membranes, reducing ion channel efficiency and delaying ventricular repolarization. 44 The study found a link between higher LDL levels and increased QTcd, but no correlation with total cholesterol, triglycerides, or age. This agrees with Szabo et al. 45 who observed a significant association between LDL-C and QT dispersion in type IIb hyperlipoproteinemia.
Higher blood pressure was linked to increased QTcd in the studied obese children. Similar correlations between QT and blood pressure were observed by Jayanthi et al. 46 in young adults. Annila et al. 47 noted that QTc prolongation is due to sympathetic activation, with a sympathovagal imbalance from elevated blood pressure contributing to this prolongation. 48
Long-term JTcd was found in the obese participants compared to the healthy controls, this came in line with Nigro et al. 8 who found higher JTcd values in obese children. Hyperinsulinemia, higher LDL, also higher blood pressure in obese children play a role in prolonged JTcd in those children, besides increased waist circumference and BMI marker influence JTcd prolongation in the studied obese children.
Tp-e/QT, Tp-e/interval, and Tp-e/QTc ratios are sensitive ECG markers for ventricular arrhythmias and sudden death. 49 The study found no significant difference in Tp-e intervals between obese and non-obese children, aligning with Braschi et al. 50 However, Türe et al, 51 Dağlı et al., 24 and Tanriverdi et al. 52 reported significant differences in Tp-e intervals between obese children and healthy controls.
In the current work, it's observed that no significant difference between obese children with and without metabolic syndrome regarding ventricular repolarization ECG parameters, while Khushboo et al. 53 observed higher values of QTc dispersion and TpTe intervals in metabolic syndrome adults compared to the control group.
Study limitations
This study was conducted at a single center with a relatively small sample size, and a notable gender imbalance in the sample, which could limit their applicability to the broader population. Additionally, the study did not account for the hormonal profile which can significantly affect metabolic outcomes. Hence, future research should aim to address these limitations.
Conclusion
JTc dispersion (ms) and QTc dispersion (ms) were significantly greater in obese children compared to healthy ones, with a significant positive correlation between dispersions, and waist circumference, BMI, blood pressure, fasting insulin, HOMA-IR index, and LD. While there is no significant difference between obese children with and without metabolic syndrome regarding ECG parameters. Therefore, it is recommended to prevent obesity and detect early cardiovascular risks in children through promoting healthy diets, physical activity, and regular screening of BMI, waist circumference, and metabolic indices. Routine ECG monitoring should be also performed in at-risk children that would help track the progression of any cardiac issues over time and provide more comprehensive data.
Supplemental Material
sj-docx-1-end-10.1177_11795514251316248 – Supplemental material for Impact of Different Metabolic Indicators on Ventricular Repolarization Indices in Obese Children: A Case Control Study
Supplemental material, sj-docx-1-end-10.1177_11795514251316248 for Impact of Different Metabolic Indicators on Ventricular Repolarization Indices in Obese Children: A Case Control Study by Asmaa A El Sehmawy, Rasha Abd El Samad Fawaz, Nadia Ahmed Agiba, Eman Aziz Elsherbiny, Nglaa Fathi Agaba, Doaa Sayed Mohammed, Haidy Mahmoud Nasr, Fatma Elzhraa AE Diab, Amal M Ahmed, Shorouk Issa Mahfouz, Heba T Okda and Doaa Sadek Ahmed in Clinical Medicine Insights: Endocrinology and Diabetes
Footnotes
References
Supplementary Material
Please find the following supplemental material available below.
For Open Access articles published under a Creative Commons License, all supplemental material carries the same license as the article it is associated with.
For non-Open Access articles published, all supplemental material carries a non-exclusive license, and permission requests for re-use of supplemental material or any part of supplemental material shall be sent directly to the copyright owner as specified in the copyright notice associated with the article.