
Abstract
Background:
A frequent comorbidity in cystic fibrosis (CF) is CF related diabetes (CFRD) caused by a gradual decline in insulin secretion. The reduction in the anabolic hormone, insulin, might explain the weight loss that precedes onset of CFRD. We investigated the association between muscle and fat mass in relation to glucose tolerance and insulin function.
Methods:
In a cross-sectional study with CF patients (⩾18 years), we conducted an oral glucose tolerance test and dual energy X-ray absorptiometry scan (DXA). Based on plasma glucose, glucose tolerance was defined as normal (NGT): 1-hour <11.1 mmol/L and 2-hour <7.8 mmol/L, impaired (IGT): 2-hour ⩾7.8 and <11.1 mmol/L or CFRD: 2-hour ⩾11.1 mmol/L. Insulin resistance (HOMA-IR) was derived from fasting levels of plasma glucose and plasma insulin, and fat-free and fat mass index (kg/m2) from DXA. Associations were evaluated using linear regression models adjusted for age, sex, and pancreas insufficiency.
Results:
Among 79 CF patients with exocrine pancreas insufficiency, impairment of glucose tolerance corresponded to reduced insulin secretion. In the IGT group the fat-free mass index (FFMI) was 1.2 kg/m2 (95% CI: [−2.3, −0.03] kg/m2, P = .044) lower compared to the NGT group. FFMI increased insignificantly by 0.4 kg/m2 (95% CI: [−0.6, 1.5] kg/m2, P = .422) among the insulin-treated CFRD group compared to IGT. Fat mass index (FMI) was not different between groups but tended to decrease with glucose tolerance impairment. For each 100 pmol/L increase in fasting insulin FFMI increased by 1.77 kg/m2 (95% CI: [0.21, 3.33] kg/m2/pmol/L/100) and FMI increased by 6.15 kg/m2 (95% CI: [3.87, 8.44] kg/m2/pmol/L/100). In multivariate analyses, HOMA-IR was positively associated with FFMI (β = 0.5 kg/m2/HOMA-IR, 95% CI: [0.08, 0.92] kg/m2/HOMA-IR, P = .021) and FMI (β = 1.5 kg/m2/HOMA-IR, 95% CI: [0.87, 2.15] kg/m2/HOMA-IR, P < .001).
Conclusions:
Muscle mass was significantly lower among participants with impaired glucose tolerance (IGT), while muscle mass was normalized among those treated with insulin.
Introduction
Individuals with cystic fibrosis (CF) associated with exocrine pancreas insufficiency are prone to develop diabetes with a prevalence up to 50% among adult CF patients. 1 Insulin deficiency in CF tends to develop slowly, thus abnormal glucose tolerance may be present for years prior to onset of CF related diabetes (CFRD). 2 An accelerated deterioration in clinical parameters has been described in the 4 years preceding the CFRD onset. Lung function declines and body mass index (BMI) decreases to a larger degree than in CF patients who do not progress to CFRD. 3 It has been described that a delay in peak insulin secretion during an oral glucose tolerance test (OGTT) is associated with poor nutritional status in CF, 4 which might result in reduced survival. 5
Insulin is an anabolic hormone that upregulates net lipid storage and protein synthesis. 6 A former case-control study from Denmark showed that BMI was regained in individuals with CFRD after 2 years of insulin treatment 7 and among children with impaired glucose tolerance (IGT), BMI significantly improved after 12 months of long acting insulin treatment. 8 A small study on 3 newly diagnosed CFRD patients showed that insulin supplementation increased fat mass and tended to increase fat-free mass, an indicator of muscle mass. 9 The study also found that protein breakdown is higher in untreated CFRD patients compared to both CF patients with normal glucose tolerance (NGT) and insulin-treated CFRD patients. We therefore hypothesized that insulin secretion deficiency in CF patients with IGT results in net catabolism leading to reduced muscle mass.
Theoretically, reduced muscle mass could impair the glucose tolerance further by increasing the peripheral insulin resistance. A study in healthy adults has shown that low muscle mass and high fat mass are associated with insulin resistance, 10 and in type 2 diabetes low thigh muscle mass is also associated with insulin resistance. 11 CF patients with IGT have a higher peripheral insulin resistance compared to CF patients with NGT, 12 moreover CF patients, who experience an accelerated deterioration in glucose tolerance, have a corresponding increase in insulin resistance. 13 Still, it is not known whether muscle loss in CF contributes to worsening of the glucose tolerance.
The primary aim of this study was to assess associations between body weight, muscle/fat mass and glucose tolerance status/insulin secretion in a cross-sectional study in adults with CF. Furthermore, we aimed to assess whether muscle and fat mass were associated with indices of insulin secretion and insulin activity.
Methods
During 2017 we conducted a cross-sectional study including CF patients from the Copenhagen CF Center, Denmark. 14 The study was approved by the Danish Ethical Committee (H-16022305) and all patients gave written informed consent before participating in the study.
Independent of glucose tolerance status, all non-pregnant CF patients above 18 years were invited for the study. All participants fasted overnight before the test. Venous blood was sampled immediately before and 1 and 2 hours after the intake of 75 g glucose. Data on the use of oral steroids and pancreas exocrine function, assessed by pancreas enzyme replacement therapy use, were collected. Patients were categorized as chronically infected if they had a pulmonary infection with a persistent bacterial strain.
All blood samples were collected in EDTA tubes and centrifuged within 60 minutes after sampling. The plasma (p) was stored at −80°C and subsequently analyzed in one batch. P-insulin and p-glucose were analyzed using Cobas 8000, e801 module and Cobas 8000, c702 module, respectively.
Glucose tolerance was classified as follows: (1) NGT; 2-hour p-glucose <7.8 mmol/L and 1-hour p-glucose <11.1 mmol/L, (2) Indeterminate; 2-hour p-glucose <7.8 mmol/L and 1-hour p-glucose ⩾11.1 mmol/L, (3) IGT; 2-hour p-glucose ⩾7.8 mmol/L and <11.1 mmol/L, and (4) CFRD; 2-hour p-glucose ⩾11.1 mmol/L.
Insulin resistance was estimated using the homeostatic model assessment for insulin resistance (HOMA-IR) equation 15 and insulin sensitivity was calculated using the Matsuda index equation.16,17
The insulin secretion rate (ISR1hour), as an estimate of beta cell function, was derived from the differences between the fasting and 1-hour samples. 18 The disposition index was defined as the product of ISR1hour and the Matsuda index, 19 and was used as an expression of peripheral insulin activity. 20 To obtain the indices above, we used a conversion factor for p-glucose: 18.0182 (mg/dL)/(mmol/L) and for p-insulin: 0.143988 (micro IU/mL)/(pmol/L). 21
We used a dual energy X-ray absorptiometry (DXA) scan (Lunar Prodigy Pro, GE Healthcare, Madison, WI, USA) within 6 months of the OGTT to determine fat-free and fat mass. Fat-free mass was used as a measure of muscle mass. Fat-free mass index (FFMI) and fat mass index (FMI) were calculated using: [fat-free mass (kg)/height (m)2] and [fat mass (kg)/height (m)2], respectively. BMI, which is closely related to the sum of FFMI and FMI, was obtained from weight and height measured on the day of the DXA.
Statistical Analyses
Data were analyzed using R x64.22,23 The geometric mean of the p-glucose, p-insulin, insulin resistance/sensitivity, and insulin secretion/activity indices were calculated for each group of glucose tolerance. Significant variations between groups were detected by one-way ANOVA (Table 1). Linear regression models, adjusted for age and sex, were used to assess differences in body composition parameters (BMI, FFMI, and FMI) between glucose tolerance groups. The analysis included only patients with pancreas insufficiency. All patients treated with daily insulin were categorized as CFRD independent of 2-hour p-glucose and CFRD patients, who were untreated with daily insulin, for any reason, were categorized as IGT (Table 2; Figure 1). Associations between FFMI and FMI versus p-insulin, insulin resistance/sensitivity, and insulin secretion/activity indices were estimated by linear regression models including all patients not treated with insulin. The models were adjusted for age, sex, pancreas function (sufficient or insufficient), and oral steroid intake (users or non-users). P-insulin (pmol/L) were divided by hundred to ease presentation and interpretation of beta-coefficients (Tables 3 and 4). Linear regression models, adjusted for age and sex, were used in sensitivity analyses to estimate the association between chronic pulmonary infection and insulin resistance among all the patients. The association between FFMI and FMI were calculated in the same way.
Metabolic characteristics of 79 patients with cystic fibrosis and pancreas insufficiency by glucose tolerance status.
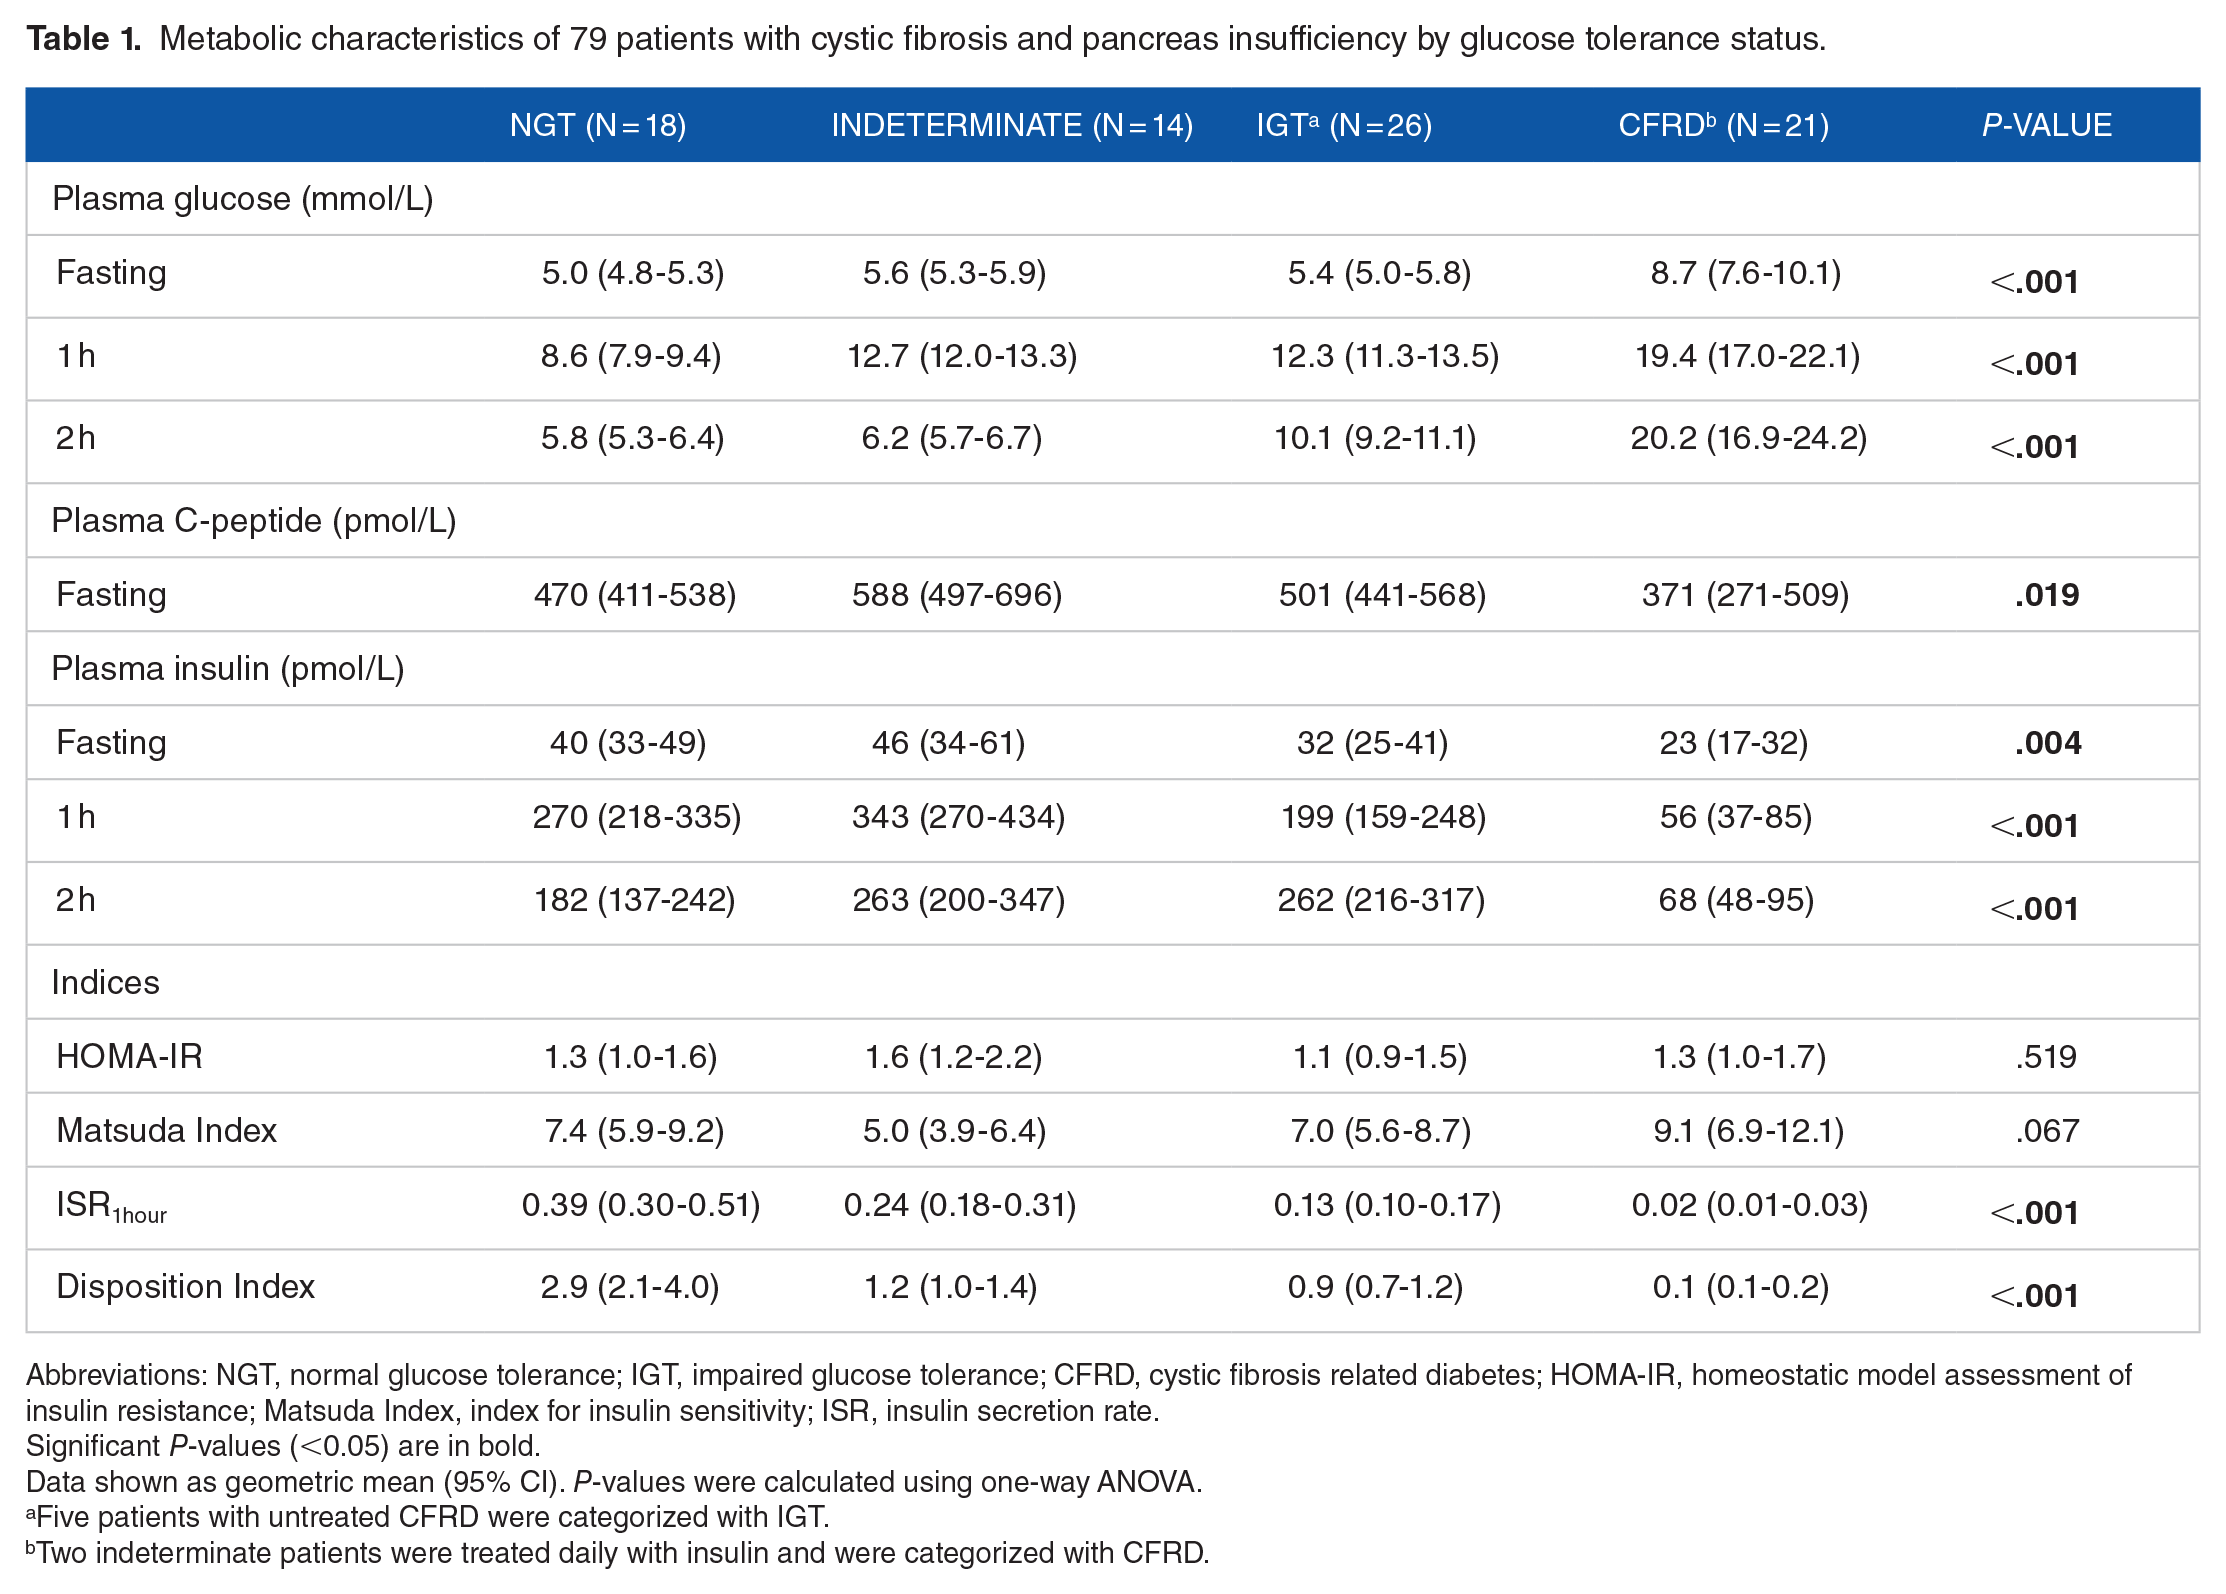
Abbreviations: NGT, normal glucose tolerance; IGT, impaired glucose tolerance; CFRD, cystic fibrosis related diabetes; HOMA-IR, homeostatic model assessment of insulin resistance; Matsuda Index, index for insulin sensitivity; ISR, insulin secretion rate.
Significant P-values (<0.05) are in bold.
Data shown as geometric mean (95% CI). P-values were calculated using one-way ANOVA.
Five patients with untreated CFRD were categorized with IGT.
Two indeterminate patients were treated daily with insulin and were categorized with CFRD.
Difference in body mass and subcomponents between different glucose tolerance status groups among 79 pancreas insufficient patients with cystic fibrosis.
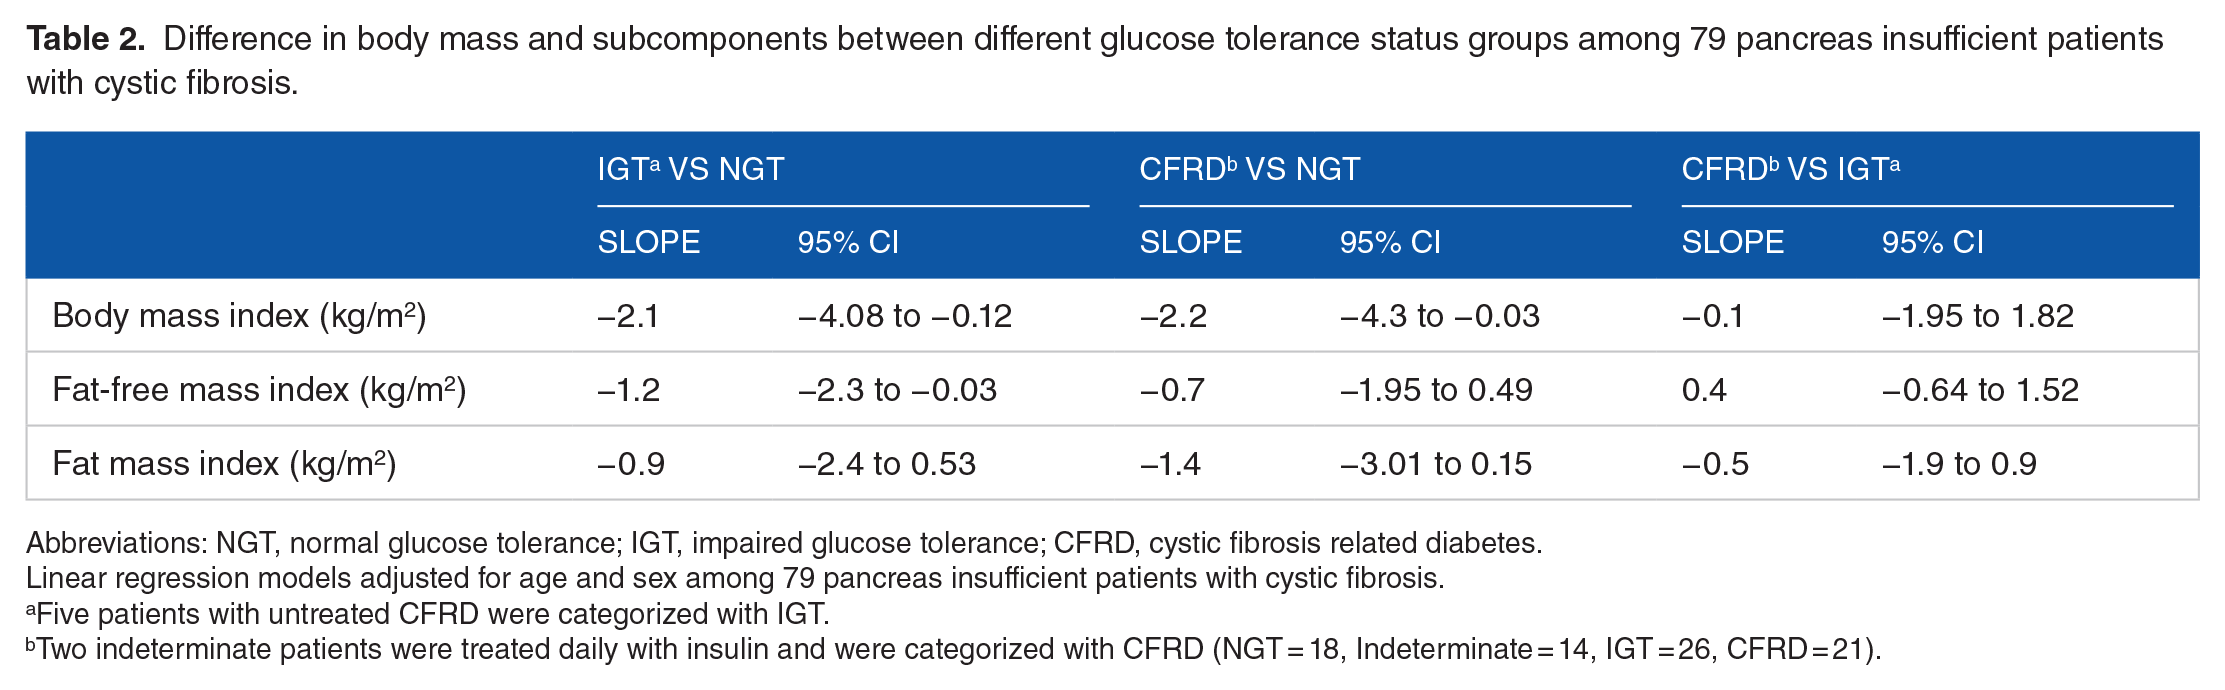
Abbreviations: NGT, normal glucose tolerance; IGT, impaired glucose tolerance; CFRD, cystic fibrosis related diabetes.
Linear regression models adjusted for age and sex among 79 pancreas insufficient patients with cystic fibrosis.
Five patients with untreated CFRD were categorized with IGT.
Two indeterminate patients were treated daily with insulin and were categorized with CFRD (NGT = 18, Indeterminate = 14, IGT = 26, CFRD = 21).
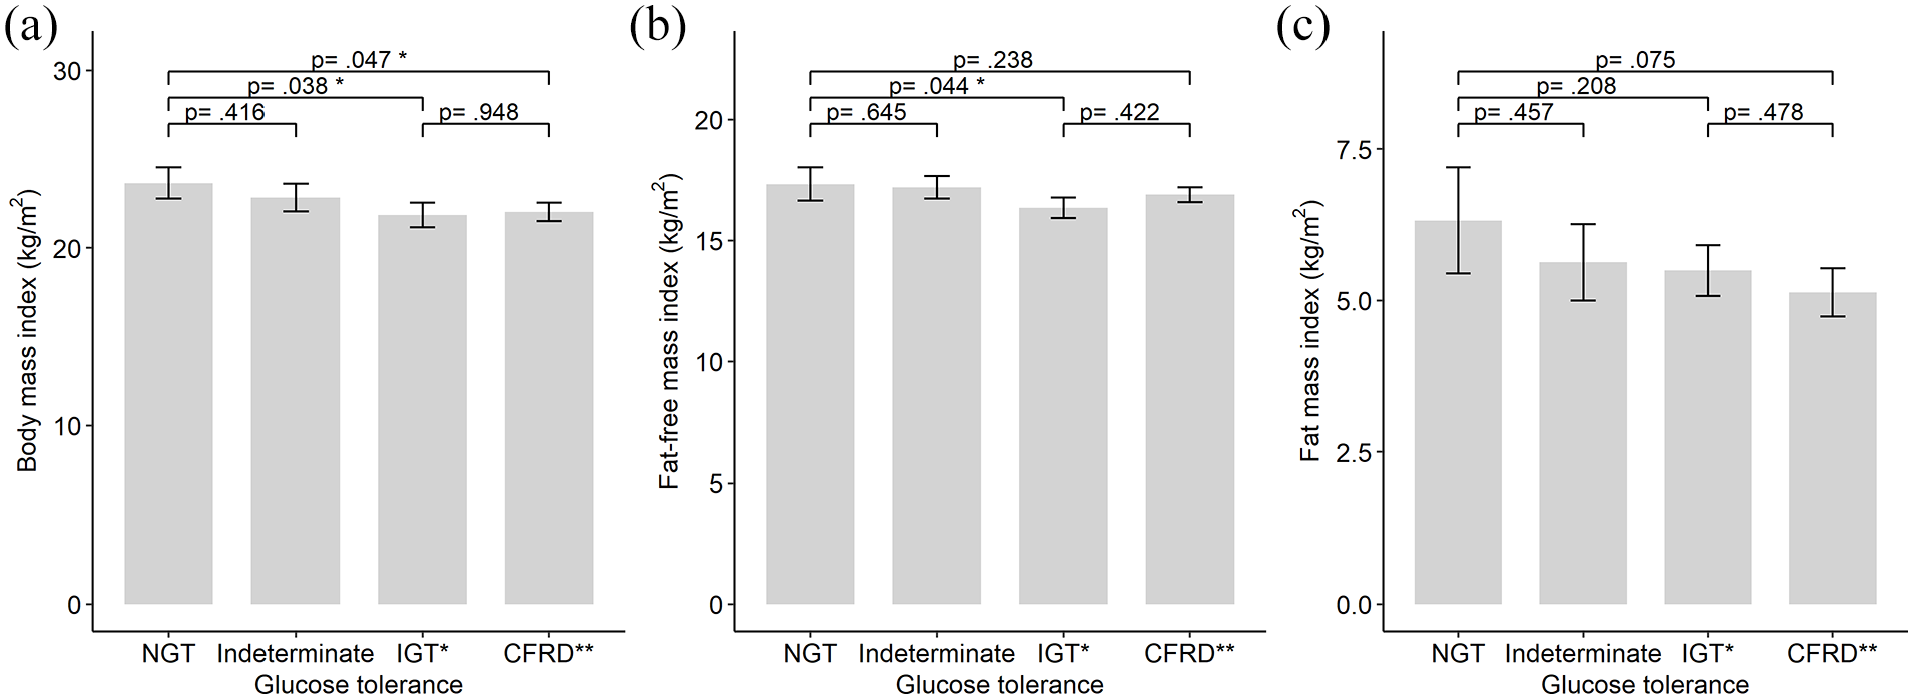
Body mass and subcomponents by glucose tolerance status among 79 pancreas insufficient patients with cystic fibrosis: (A) body mass index, (B) fat-free mass index and (C) fat mass index among 79 pancreas insufficient patients with cystic fibrosis by glucose tolerance status. Data shown as mean (±standard error).
Correlates of fat-free mass index among 72 cystic fibrosis patients not treated with insulin.

Abbreviations: HOMA-IR, homeostatic model assessment of insulin resistance; Matsuda Index, index for insulin sensitivity; ISR, insulin secretion rate.
Significant P-values (<0.05) are in bold.
Linear regression models adjusted for age, sex, pancreas function (sufficient/insufficient) and oral steroid treatment (user/non-user).
Correlates of fat mass index among 72 cystic fibrosis patients not treated with insulin.

Abbreviations: HOMA-IR, homeostatic model assessment of insulin resistance; Matsuda Index, index for insulin sensitivity; ISR, insulin secretion rate.
Significant P-values (<0.05) are in bold.
Linear regression models adjusted for age, sex, pancreas function (sufficient/insufficient) and oral steroid treatment (user/non-user).
Results
During 2017, 93 adult patients were included and had an OGTT and a DXA performed. The median age was 32.2 years (interquartile range (IQR): [25.1, 38.9] years) and 39 participants (42%) were females. Fifty-six participants (60%) were homozygous for F508del. The proportions of participants with exocrine pancreas insufficiency and chronic pulmonary infection were 85% and 73%, respectively, and the overall median forced expiratory volume in one second percent predicted (FEV1%) was 74.5% (IQR: [55.9, 92.4] %). In total, 29 (31%) had NGT, 18 (19%) had indeterminate and 21 (23%) had IGT. Twenty-five patients (27%) were categorized as CFRD due to the OGTT results. Of all the participants 21 (23%) were treated with daily insulin, among whom the median duration of insulin treatment was 12.3 years (IQR: [5.4, 15.6] years). Among the 79 pancreas insufficient participants, fasting p-C-peptide, p-insulin, ISR1hour, and disposition index decreased by groups with increasing glucose tolerance impairment. There was no variation in HOMA-IR or Matsuda index between glucose tolerance groups (Table 1).
BMI was lower in the IGT group and in the CFRD group compared to the NGT group (Table 2 and Figure 1A). FFMI was 1.2 kg/m2 (95% CI: [−2.3, −0.03] kg/m2, P = .044) lower among the IGT group compared to the NGT group. Insulin-treated CFRD had an insignificantly higher FFMI than IGT (Table 2 and Figure 1B). There were no significant differences in FMI between any of the groups (Figure 1C).
Among all the 72 patients not treated with daily insulin, no associations were found between FFMI and p-insulin in univariate analyses. However, after adjusting for sex, age, pancreas function, and oral steroid use (4 patients), fasting p-insulin was positively associated with FFMI (coefficient: 1.77 kg/m2/pmol/L/100, 95% CI: [0.21, 3.33] kg/m2/pmol/L/100, P = .027). The association between 1-hour p-insulin and FFMI did not reach significance (Table 3), neither did the association between fasting C-peptide and FFMI (coefficient: 0.19 kg/m2/pmol/L/100, 95% CI: [-0.02, 0.41] kg/m2/pmol/L/100, P = .079).
In the adjusted analyses, HOMA-IR was positively associated with FFMI and there was a negative association between Matsuda index and FFMI. ISR1hour and the disposition index were not associated with FFMI (Table 3).
High measurements of insulin were associated with high FMI. Most pronounced, we found that fasting p-insulin (univariate coefficient: 6.49 kg/m2/pmol/L/100, 95% CI: [3.96, 9.01] kg/m2/pmol/L/100, P < .001) was positively associated with FMI. The estimate was similar in the multivariate analysis (Table 4). Fasting p-C-peptide was also positively associated with FMI in both analyses (adjusted coefficient: 0.64 kg/m2/pmol/L/100, 95% CI: [0.30, 0.98] kg/m2/pmol/L/100, P < .001).
HOMA-IR was positively associated with FMI and correspondingly Matsuda index was negatively associated with FMI in the univariate analysis. The associations were similar in the multivariate analyses. ISR1hour was only positively associated with FMI in the univariate analysis. While, disposition index was only negatively associated with FMI in the multivariate analysis (Table 4).
Sensitivity analyses using unadjusted linear models showed that chronic pulmonary infection tended to have a lower HOMA-IR (−0.41 HOMA-IR, 95% CI: [−0.86, 0.04] HOMA-IR, P = .072) compared to patients without. The same tendency was found after adjusting for age and sex (−0.34 HOMA-IR, 95% CI: [−0.80, 0.12] HOMA-IR, P = .151). FFMI was associated with FMI in models adjusted for age and sex (coefficient: 0.26 kg/m2/kg/m2, 95% CI: [0.14, 0.39] kg/m2/kg/m2, P < .001).
Discussion
Among 79 CF patients with pancreas insufficiency, we found measures of muscle mass and body fat (ie, BMI, FFMI, and FMI) to be highest among individuals with a normal or near-normal glucose tolerance. Individuals with a most severe untreated hyperglycemia (ie, IGT) had the lowest measures of muscle mass, and the effect was not driven by age or gender. Individuals with insulin-treated CFRD appeared to have regained some of the lost muscle mass compared to individuals with IGT. Fasting p-insulin was associated with muscle and fat mass among 72 CF patients without daily insulin treatment, irrespectively of age and gender.
Our results suggest that the decline in BMI observed in individuals with pre-CFRD is caused by a reduction in skeletal muscle mass but not fat mass. A possible explanation for the decline in body mass could be a reduced insulin secretion secondary to progressive pancreatic degeneration. 2 Consistently, impairment of glucose tolerance corresponded with a reduced insulin secretion in our study. The lack of endogenous insulin might lead to reduced anabolic stimulation and subsequently loss of muscle mass. In support of the anabolic effect of insulin, the muscle mass tended to be higher in the insulin-treated CFRD patients compared to those with IGT.
The anabolic effect of insulin is known to be mediated by inhibition of proteolysis rather than protein synthesis stimulation. 24 In support of our findings, a previous study showed that proteolysis was correlated to glucose tolerance in CF 25 and that exogenous insulin suppressed the proteolysis, though the effect was less than in healthy controls.25,26 Considering the overall higher proteolysis in CF compared to healthy controls,25,26 it seems likely that a reduction in insulin secretion in CF can lead to loss of muscle mass with significant impact on various body functions, such as pulmonary function, growth, and physical capacity.
A previous study has suggested that insulin resistance is related to poor clinical status in CF. 27 Moreover, high levels of TNF-alfa during chronic inflammation have been speculated to be associated with reduced glucose tolerance in CF 28 and weight loss. 29 However, our results do not support that chronic pulmonary inflammation is a confounding cause of muscle mass loss in IGT patients, as chronically infected patients had a tendency toward reduced insulin resistance and since FFMI was positively associated with insulin resistance. Rather, the positive association between FFMI and insulin-resistance is likely to be explained by high fat mass leading to both a higher fat-free mass and a higher insulin resistance.
Measures of insulin secretion and insulin resistance were positively associated with FMI in patients not receiving insulin treatment. A high fat mass might result in a higher demand for insulin secretion during an OGTT, due to higher insulin resistance. However, it has also been speculated that insulin levels could stimulate fat mass growth, 9 implying that a decline in insulin secretion could lead to a reduced fat mass followed by improved insulin sensitivity. Hence, the consequence of insulin deficiency on glucose tolerance might be mitigated by increased insulin sensitivity related to reduced fat mass. Consistently, a previous study from Minnesota has shown improved peripheral insulin resistance in pancreas insufficient CF patients with IGT compared to pancreas sufficient CF patients with normal glucose tolerance. 30 Despite the positive association between fat mass and insulin levels in our study, neither the FMI nor the HOMA-IR were reduced in the patients with IGT compared to NGT implicating that the fat storing effect of insulin was of little clinical significance. Overall, our data support that insulin resistance plays a minor role in the progression toward CFRD.
The insulin secretion and capacity estimated using ISR1hour and disposition index were not associated with FFMI. An explanation for this might be that the effects of insulin secretion and insulin resistance neutralize each other, as the denominators in both indices correlates with insulin secretion and the numerators of the indices correlate with insulin resistance. Previously, ISR, as a marker of insulin secretion, has been calculated from the 30 minutes assessments, 18 while we only sampled after 1 hour and potentially missed the opportunity to determine any first phase insulin secretion effects. As fasting p-insulin was significantly associated with both FFMI and FMI and 1-hour p-insulin tended to be associated with these, we speculate that the association between FFMI and the first phase insulin secretion might have been found if the 30-minutes p-insulin was used. However, Moran et al 31 showed that during an OGTT the insulin peak in CF occurred after 60 minutes or later, indicating that the 1-hour p-insulin measures reflects the 30-minutes p-insulin and the first phase insulin secretion in CF. Hence, we believe we did not miss any associations between body components and the first phase insulin secretion.
A limitation of the study is the cross-sectional nature that limits firm conclusions on causality. A long-term longitudinal study would have allowed investigating changes in body composition related to progression of CFRD, which usually occurs with increasing age. This means we are not able to rule out that differences in body composition between groups of glucose tolerance are a consequence of changes in CF management over time. However, the association between insulin secretion and body composition persisted in the age and gender adjusted analyses, which reduce the history bias.
Progressive impairment in glucose tolerance in CF was associated with decreasing insulin secretion without worsening insulin resistance. Muscle mass was significantly lower in participants with IGT and increased with insulin therapy and muscle and fat mass were positively associated with insulin resistance. Progression toward CFRD is not prevented by the increased insulin sensitivity associated with weight loss. Though longitudinally studies are still warranted, our study supports the importance of detecting and treating CFRD in early stages to prevent excessive and potentially harmful loss in muscle mass. Further studies investigating the clinical impact of muscle loss in CF and the clinical effect of early insulin treatment are needed.
Footnotes
Funding:
The author(s) received no financial support for the research, authorship, and/or publication of this article.
Declaration of Conflicting Interests:
The author(s) declared no potential conflicts of interest with respect to the research, authorship, and/or publication of this article.
Author Contributions
Conceived and designed the analyses: IM, DF, PO, BU, JS, TK, TQ, TP, and RK. Collected the data: IM. Contributed data or analysis tools: PO. Performed the analysis: BU and CR. Wrote the paper: BU, IM, DF, TA, CR, PO, JS, TK, TQ, TP, and RK.
Ethical Approval
Ethical Committee of the Capital Region, Denmark (H-16022305).