
Abstract
Introduction:
Pulse pressure variation (PPV) has been shown to be useful to predict fluid responsiveness in patients ventilated at tidal volume (Vt) >8 mL kg−1. Nevertheless, most conditions in critical care force to use lower Vt. Thus, we sought to evaluate the operative performance of PPV when a Vt ⩽8 mL kg−1 is used during mechanical ventilation support.
Methods:
We searched PubMed and Embase databases for articles evaluating the operative performance of PPV as a predictor of fluid responsiveness in critical care and perioperative adult patients ventilated with tidal volume ⩽8 mL kg−1 without respiratory effort and arrhythmias, between January 1990 and January 2019. We included cohort and cross-sectional studies. Two authors performed an Independently selection using predefined terms of search. The fitted data of sensitivity, specificity, and area under the curve (AUC) were assessed by bivariate and hierarchical analyses.
Results:
We retrieved 19 trials with a total of 777 patients and a total of 935 fluid challenges. The fitted sensitivity of PPV to predict fluid responsiveness during mechanical ventilation at Vt ⩽8 mL kg−1 was 0.65 (95% confidence interval [CI]: 0.57-0.73), the specificity was 0.79 (95% CI: 0.73-0.84), and the AUC was 0.75. The diagnostic odds ratio was 5.5 (95% CI: 3.08-10.01, P < .001) by the random-effects model.
Conclusions:
Pulse pressure variation shows a fair operative performance as a predictor of fluid responsiveness in critical care and perioperative patients ventilated with a tidal volume ⩽8 mL kg−1 without respiratory effort and arrhythmias.
Introduction
Intravenous fluid resuscitation is a key piece in the management of patients with circulatory shock. 1 Fluid loading aims to increase cardiac output (CO) to improve the convective transport of oxygen to the tissues. Nevertheless, fluids can be harmful when excessively administered. 2 Indeed, higher fluid balances have been related to adverse clinical outcomes in septic shock, 3 whereby strategies to prevent fluid overload are highly desirable and represent a priority in sepsis research. 4
Prediction of fluid response could potentially avoid unnecessary volume load during resuscitation of circulatory shock. Several tools can be used to predict the increase in CO after a fluid load 5 and potentially, some of these might improve clinical outcomes when incorporated as a part of treatment algorithms of intravenous fluid management.6-10 Pulse pressure variation (PPV) can predict fluid responsiveness in critically ill patients,11-13 and although with some limitations, it might better predict fluid responsiveness than stroke volume and systolic pressure variations. 11
Mechanical ventilation with low tidal volumes is widely recommended in patients with acute respiratory distress syndrome 14 and other many circumstances in critical care. 15 Nevertheless, the operative performance of PPV may be substantially reduced when mechanical ventilation is set at low tidal volumes 16 or when lung compliance is severely compromised 17 because, under such conditions, the effects of mechanical ventilation on the cardiac extramural and intramural pressures are limited. Besides, at higher respiratory rates (RR) and low heart to RR ratios, the usefulness of PPV could also be limited18,19
Although several meta-analyses and systematic reviews have described the operative performance of PPV as a predictor of fluid responsiveness, the particular usefulness of PPV under Vt ⩽8 mL kg−1 and high heart rate to RR ratio is controversial. Thus, we propose to perform a meta-analysis and systematic review about the performance of PPV as a predictor of fluid responsiveness in adult patients ventilated at tidal volume ⩽8 mL kg−1 without arrhythmias and active respiratory efforts in the critical care and perioperative settings.
Methodology
Protocol
This systematic review was conducted by Preferred Reporting Items for Systematic Reviews and Meta-Analyses (PRISMA) recommendations. 20
Study selection and inclusion criteria
We look for prospective studies assessing the operative performance of PPV as a predictor of fluid responsiveness in the critical care and perioperative adult patients ventilated at Vt ⩽8 mL kg−1 without excessive respiratory efforts and arrhythmias. Only those in which PPV was used as a predictor of fluid responsiveness and revealing data about its operative performance were finally included for analysis. Indeed, an explicit definition of fluid responsiveness and the percentage of fluid response should also be revealed to be included. Only manuscripts written in English were selected. We did not include studies including patients younger than 18 years of age or pregnant women. We also did not include case reports, studies in abstract form, or studies conducted in animals.
Search strategy and data extraction
A highly sensitive search strategy was conducted in Embase and in MEDLINE using the PubMed interface from January 1990 to January 2019. We applied no restrictions apart of language restrictions (as previously described). Data extraction and eligibility assessment were performed independently in an unblinded, standardized manner by 2 reviewers (J.I.A.S. and J.D.C.R.). We used the following terms: (“pulse pressure variation” [All Field] OR “Fluid Challenge” [All field]) AND (respiration [MeSH] OR Respiration, Artificial [MeSH] OR Respiratory Distress Syndrome, Adult [MeSH] OR Tidal volume [MeSH] OR Lung Compliance [MeSH]) filtered by full text.
Study selection and data collection process
Two authors (J.I.A.S. and J.D.C.R.) reviewed titles independently and abstracts potentially eligible. Those studies fulfilling the inclusion criteria were pooled in a list, and then, the 2 files were compared to select those to be finally included for analysis. We also search for additional studies using the bibliography of previously chosen studies. Any disagreement between the authors was resolved through discussion; if it continued, a third author reviewed the article and facilitated a consensus among all review authors.
Data items
Data extracted from each clinical trial included authors, year of publication, type of population (critical or surgical) enrolled in the trial, type of study, number of patients enrolled, device or technique used to determinate PPV; type and volume of fluid used during the fluid loading; operational definition of intravenous fluid responsiveness; percentage of positive fluid response; cut-off point of PPV used; ventilatory settings (particularly tidal volume, RR, and lung compliance); finally, data about sensitivity, specificity, and area under the curve (AUC) reported for PPV.
Quality assessment
The quality of studies was assessed by the Quality Assessment of Diagnostic Accuracy Studies 2 (QUADAS-2) using 4 domains: patient selection, index test, reference standard, and flow and time. Each area was assessed for risk of bias, classified as “low,” “high,” or “unclear.” Besides, its risk of applicability had 3 domains: patient selection, index test, and reference standard, which were assessed as “low,” “high,” or “unclear.” 21
Statistical analysis
Analysis of individual studies
The data of sensitivity, specificity, diagnostic odds ratio (DOR) were calculated by a contingency table.
Analysis of summary measures
The pooled data of sensitivity, specificity, DOR were assessed by the random-effects methods. The fitted data of sensitivity, specificity, and AUC were assessed by bivariate and hierarchical analyses. The summary receiver operating characteristic (ROC) curve was evaluated by the Rutter and Gatsonis method. An area under curve receiver operating (AUROC) greater than 0.7 would mean a fair operative performance. 22
The heterogeneity of trials was assessed by Cochran Q statistics; its effects were quantified using inconsistency (I2). I2 greater than 50% would mean significant heterogeneity. 23
Analysis of risk of bias across studies
Asymmetry was assessed by a contour-enhanced funnel plot and by the Thompson and Sharp tests. Publication bias was fitted by the trim-and-fill method.
Additional analysis
We performed a subgroup and meta-regression analysis to assess the association between clinical setting, lung compliance, variable measured to determine fluid responsiveness, a method for indices, type of fluid, hemodynamic endpoint, outlier studies, and tidal volume used, and DOR and Log-DOR. The threshold effect was assessed by Spearman rank correlation coefficient and by the Moses-Shapiro-Littenberg method.
The data were analyzed using R version 3.4.3 with the mada and meta packages. The data are expressed as a value (95% confidence interval [CI]). P < .05 was considered statistically significant.
Results
Study selection
From a total of 255 studies, we finally retrieved 19 fulfilling all inclusion criteria and providing complete information about mechanical ventilation settings. The complete searching process is depicted in Figure 1.

Adapted from Moher D, Liberati A, Tetzlaff J, Altman DG, The PRISMA Group (2009). 20
Study characteristics
A total of 19 studies were incorporated in the meta-analysis; these included 18 prospective cohort studies and 1 cross-sectional study for a total of 777 patients. General characteristics are summarized in Tables 1 and 2. A total of 935 fluid challenges were performed, with an average of fluid responsiveness of 51.51%. Seven studies were performed in a surgical setting, whereas 12 were conducted in the critical care setting. Eight studies used crystalloids, 8 used colloids, and 3 used both fluids during the fluid loads. Cardiac output was determined by different methods: pulmonary artery catheter (PAC) (n = 7), Pulse Contour Cardiac Output (PiCCO and PiCCO2) (n = 7), ProAQT (n = 2), PAC or PiCCO (n = 2), and Lithium Dilution Cardiac Output (LiDCO) (n = 1). A positive response to fluids was considered when CO, stroke volume index, or cardiac index increase >15% in 15 studies and >10% in 4 studies.
Select characteristics of included studies.

Abbreviations: CI, cardiac index; CO, cardiac output; CR, crystalloid; HES, hydroxyethyl starch; IBW, ideal body weight; LR, Ringer’s lactate; NA, not available; NR: not reported; PAC, pulmonary artery catheter; PBW, predicted body weight; SV, stroke volume; SVI, stroke volume index; PPV, pulse pressure variation.
Values are expressed as pooled value (95% confidence interval) or median (IQR).
Calculated.
Diagnostic performance of pulse pressure variation for prediction of fluid responsiveness in patients with tidal volume ⩽8 mL kg−1 from included studies.

Abbreviations: tn, true negative; tp, true positive; PPV, pulse pressure variation.
Values are expressed as pooled value (95% confidence interval). AUC; area under curve; n1, number of patients who were positive fluid responsiveness; n2, number of patients who were negative fluid responsiveness; nt, number total of patients included.
Calculated.
The data of sensitivity, specificity, and DOR are shown in Figures 2 to 4 and in Table 2.

Sensitivity of pulse pressure variation in patients with tidal volume ⩽8 mL kg−1.

Specificity of pulse pressure variation in patients with tidal volume ⩽8 mL kg−1.

Diagnostic odds ratio of pulse pressure variation in patients with tidal volume ⩽8 mL kg−1.
Risk of bias within studies
The risk of bias was low in most of the included studies. Two studies were at high risk of bias in the item of patient selection and flow and timing (see additional Supplemental Table 1).
Syntheses of results
The cut-off point average of PPV was 10.28%. Pooled sensitivity was 0.65 (95% CI: 0.57-0.73) by the random-effects model. The pooled specificity was 0.79 (95% CI: 0.73-0.84) by the random-effects model. The pooled DOR was 7.49 (95% CI: 4.50-12.45) by the random-effects model. The studies revealed moderate heterogeneity (Q = 42.21, degrees of freedom [df] = 18, P = .001; I2 = 57.4, 95% CI: 28.9-74.4). Fitted sensitivity was 0.65 (95% CI: 0.57-0.73, P < .01), whereas the fitted specificity was 0.79 (95% CI: 0.73-0.84, P < .001). The AUC was 0.75 (Figure 5).
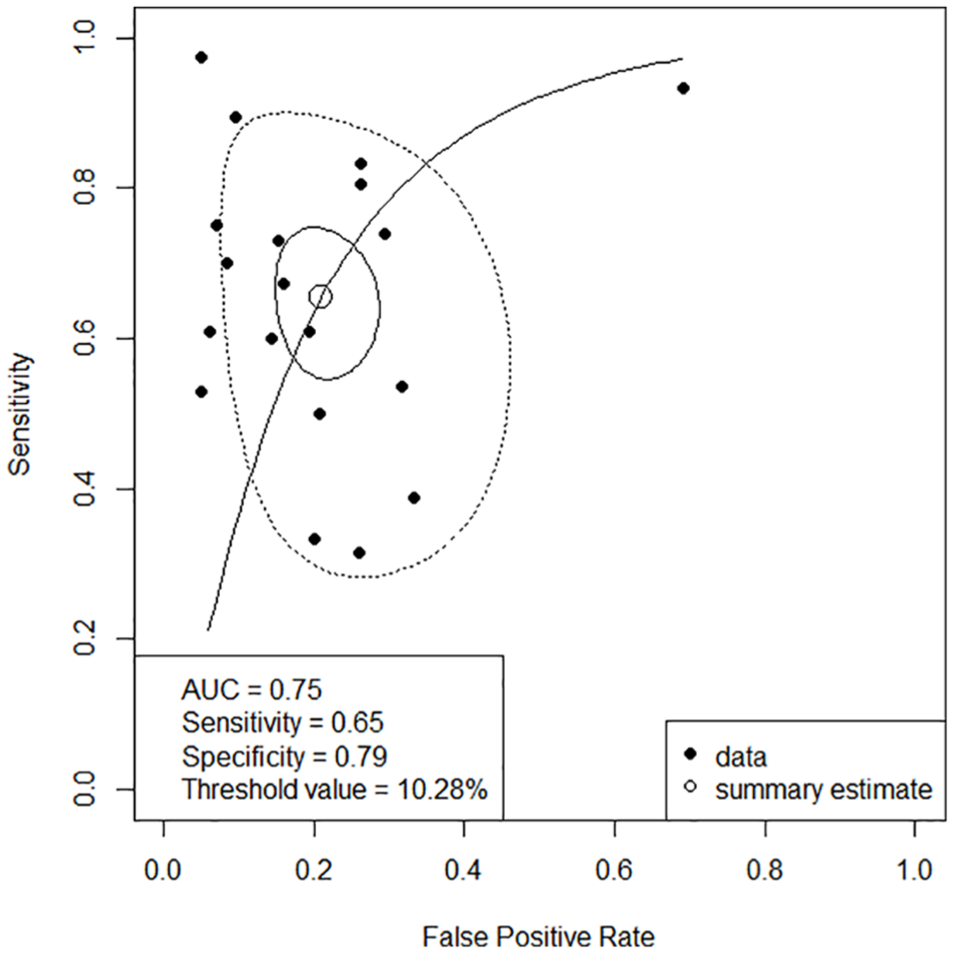
Summary ROC curve. Solid closed curve: 95% confidence region; dotted closed curve: 95% prediction region; solid line: summary ROC curve; open circle: summary estimate; close circle: study.
Risk of bias across studies
Two studies showed a specificity of 100%,24,35 and 1 study showed a sensitivity of 100%. 17 Their specificity and sensitivity needed to decrease to values nearer to 0.9 to calculate their standard error and perform an asymmetry analysis. We found asymmetry in the contour-enhanced funnel plot (Figure 6), and it was statistically significant (P < .01). The asymmetry was by publication bias; we found 4 studies with P > .1 versus 15 studies with P < .1, and then the asymmetry was fitted by the trim-and-fill method. We found a fitted DOR by the random-effects model (5.5; 95% CI: 3.08-10.01, P < .001; Figure 7).

Contour enhanced funnel plot for a meta-analysis of pulse pressure variation for prediction of fluid responsiveness in patients with tidal volume ⩽8 mL kg−1. Filled circles show an estimated treatment effect (Log diagnostic odds ratio) and its precision (standard error). In addition to individual study results, the fixed-effect estimates (vertical dashed line) with 95% confidence interval limits (diagonal dashed lines) and the random-effects estimate (vertical dotted line) are shown in the figure.

Funnel plot for meta-analysis analysis of pulse pressure variation for prediction of fluid responsiveness in patients with tidal volume ⩽8 mL kg−1 after applying the trim-and-fill method. Filled circles in the figure show trials included in the meta-analysis, whereas open circles in the figure show unpublished trials.
Additional analysis
When we performed a subgroup and meta-regression analysis, we found that lung compliance was associated with an improvement in its operative performance (DOR = 13.14 [95% CI: 6.48-26.65, P = .058 by random-effects, P = .03 by fixed-effect]); see additional Supplemental Table 2. Neither clinical setting nor tidal volume was associated with a change in its operative performance. Also, We found 2 outlier studies25,30; these were a source of heterogeneity.
We did not find a correlation between sensitivity and specificity among the studies included (ρ = 0.11, P = .63). Moreover, the slope found by the Moses-Shapiro-Littenberg method was not statistically significant (P = .465).
Discussion
This systematic review and meta-analysis suggest a fair operative performance of PPV on fluid responsiveness in patients mechanically ventilated at Vt ⩽8 mL kg−1.
Respiratory variations in stroke volume have been shown to be associated with preload dependency in mechanically ventilated patients without spontaneous breathing efforts. Pulse pressure variation could be considered, in some extent, a surrogate of stroke volume variation (SVV), and it might predict fluid responsiveness better than static indices of cardiac preload.39-41 However, SVV and PPV are generated by respiratory-induced variations, which might be limited when mechanical ventilation is provided at low tidal volumes. Thus, the reliability of PPV could be theoretically limited in mechanically ventilated patients with increased lung elastance or under conditions in which mechanical ventilation at low tidal volume is selected. Several meta-analyses assessed the operative performance of PPV as a predictor of intravenous fluid responsiveness.11-13 Nevertheless, studies incorporated in such meta-analyses included patients using a wide variety of tidal volumes. For example, Marik and collaborators included patients with Vt >7 mL kg−1, whereas other authors included mechanically ventilated patients at Vt from 4.9 to 12 mL kg−1 and even >8 mL kg−1.12,13 Conversely, we focused on studies including patients ventilated at Vt ⩽8 mL kg−1, and we also extended the search to the perioperative setting. As suggested by our results, PPV exhibits a fair operative performance in mechanically ventilated patients at such tidal volumes. Surprisingly, such operative performance was not as bad as expected, which suggests that some patients included in the studies should be highly preload dependent. Thus, although some physicians could consider the sensitivity and specificity of the PPV as low in this clinical setting, PPV can retain some capacity to predict fluid responsiveness in cases of a high preload dependence in patients ventilated with a tidal volume ⩽8 mL kg−1.
Variations in Vt influences PPV. 42 De Backer et al suggested that low Vt (⩽8 mL kg−1) decreases the operative performance of PPV to predict fluid responsiveness, 16 whereas other studies have shown different results.24,26,28,30 Our meta-analysis confirms a fair performance of PPV to predict fluid responsiveness when mechanical ventilation is set at Vt ⩽8 mL kg−1. However, some strategies could improve such performance, and although these are out of the scope of this meta-analysis, we can mention the adjusting of PPV by the changes in pleural pressure 34 and the use of “tidal volume challenges” consisting in transitory increases in Vt to evaluate variations in PPV. 35 Nevertheless, such transitory increments of Vt could be not harm-free, and there are no broad data confirming its reliability.
So, the practical question would be, “What can we do to predict fluid responsiveness in mechanically ventilated patients with tidal volumes lower than 8 mL kg−1?” One possibility would be using low cut-offs for PPV to identify responders and nonresponders such as suggested by De Backer et al. 16 However, lower cut-offs might be more profoundly influenced by small errors in measurements. Another possibility might be to consider the traditional cut-off values (ie, 12%), expecting a low sensitivity but a convenient specificity. 24 Unfortunately, data showed in the studies included in our meta-analysis do not provide sufficient information to conduct additional analysis using different cut-off points.
Significant limitations or advantages can result from different statistical strategies to perform meta-analyses, comparing the efficacy of diagnostic tests.43,44 We found moderate heterogeneity between studies, which decreased when we removed 2 outlier ones. Importantly, we did not find another source to clinical heterogeneity by analysis of subgroups and meta-regression; also, we did not find a threshold effect and methodological heterogeneity because, within the quality assessment of the included studies, the risk of bias was low in most of them. All of these reflect the strength of our results.
Our meta-analysis has some limitations. First, most studies included represent small and heterogeneous populations. Second, most of such studies did not evaluate the coexistence of other limitations of PPV, such as right-heart failure, intra-abdominal hypertension, increased lung elastance, or even high RRs, which might limit the conclusions. Moreover, the information retrieved from these studies did not allow exploring other sources of clinical heterogeneity potentially influencing the operative performance of PPV as a predictor of fluid responsiveness in patients mechanically ventilated at Vt lower than 8 mL kg−1. Third, the information provided in the studies included is not enough to conduct new analysis searching for different cut-off points predicting fluid responsiveness in these particular and prevailing conditions.
Future investigations should resolve some questions about the predictors of fluid intravenous responsiveness in patients under protective ventilatory strategies and limited respiratory system and lung elastance.
Conclusions
Our meta-analysis shows a fair operative performance of PPV as a predictor of intravenous fluid responsiveness in critical care and perioperative patients ventilated with a tidal volume ⩽8 mL kg−1 without respiratory effort and arrhythmias.
Supplemental Material
Table_1_additional – Supplemental material for Use of Pulse Pressure Variation as Predictor of Fluid Responsiveness in Patients Ventilated With Low Tidal Volume: A Systematic Review and Meta-Analysis
Supplemental material, Table_1_additional for Use of Pulse Pressure Variation as Predictor of Fluid Responsiveness in Patients Ventilated With Low Tidal Volume: A Systematic Review and Meta-Analysis by Jorge Iván Alvarado Sánchez, Juan Daniel Caicedo Ruiz, Juan José Diaztagle Fernández, Gustavo Adolfo Ospina-Tascón and Luis Eduardo Cruz Martínez in Clinical Medicine Insights: Circulatory, Respiratory and Pulmonary Medicine
Supplemental Material
Table_2_additional – Supplemental material for Use of Pulse Pressure Variation as Predictor of Fluid Responsiveness in Patients Ventilated With Low Tidal Volume: A Systematic Review and Meta-Analysis
Supplemental material, Table_2_additional for Use of Pulse Pressure Variation as Predictor of Fluid Responsiveness in Patients Ventilated With Low Tidal Volume: A Systematic Review and Meta-Analysis by Jorge Iván Alvarado Sánchez, Juan Daniel Caicedo Ruiz, Juan José Diaztagle Fernández, Gustavo Adolfo Ospina-Tascón and Luis Eduardo Cruz Martínez in Clinical Medicine Insights: Circulatory, Respiratory and Pulmonary Medicine
Footnotes
Funding:
The author(s) disclosed receipt of the following financial support for the research, authorship, and/or publication of this article.
Declaration of conflicting interests:
The author(s) declared no potential conflicts of interest with respect to the research, authorship, and/or publication of this article.
Author Contributions
JIAS contributed to design, performed the literature review, acquisition of data, statistical analysis, interpretation of data, and wrote the manuscript. JDCR contributed to design, performed the literature review, acquisition of data, interpretation of data, and wrote the paper. JJDF and GAO-T contributed to design, analysis of data, and wrote the article. LECM contributed to design, interpretation of data, and wrote the paper.
Supplemental Material
Supplemental material for this article is available online.
References
Supplementary Material
Please find the following supplemental material available below.
For Open Access articles published under a Creative Commons License, all supplemental material carries the same license as the article it is associated with.
For non-Open Access articles published, all supplemental material carries a non-exclusive license, and permission requests for re-use of supplemental material or any part of supplemental material shall be sent directly to the copyright owner as specified in the copyright notice associated with the article.