
Abstract
We developed a simplified automated algorithm to interpret noninvasive gas exchange in healthy subjects and patients with heart failure (HF, n = 12), pulmonary arterial hypertension (PAH, n = 11), chronic obstructive lung disease (OLD, n = 16), and restrictive lung disease (RLD, n = 12). They underwent spirometry and thereafter an incremental 3-minute step test where heart rate and Sp
Introduction
Noninvasive cardiorespiratory gas exchange during exercise has been a commonly used clinical test to help guide clinical judgment regarding exercise intolerance (typically fatigue or dyspnea) and assess functional capacity, general clinical status, and response to therapy for a number of disease pathologies. 1 However, many of the currently available commercial systems produce a large array of breath-by-breath measures over the course of a test leaving interpretation to a relatively complicated review by individuals with significant expertise. In addition, the testing is typically performed by pushing individuals to their maximum, requiring significant safety measures and available trained personnel in case of emergent issues.2,3 However, for most disease pathologies, many cardiorespiratory abnormalities and symptoms become evident with submaximal exercise, and for simple screening purposes, tracking of clinical health status or response to therapy, maximal testing is not necessary. 4
Thus, we have proposed a simplified approach to testing using a submaximal step test and more recently have developed an automated algorithmic approach to differentiate patients into various disease likelihood bins or silos. Our hypothesis was that this automated algorithm would differentiate patients according to their primary disease pathology with only submaximal exercise. An advantage, as well, of this type of algorithm was that most patients have associated comorbidities with multiple pathologies influencing their respiratory gas exchange, and thus, the ranking algorithm weighted not only the primary limitation or abnormality but also the comorbidities as well.
Methods
For this study, patients with known primary pathologies in heart failure (HF, n = 12), pulmonary arterial hypertension (PAH, n = 11), chronic obstructive lung disease (OLD, n = 16), and restrictive lung disease (RLD, n = 12) and a healthy cohort (n = 19) were recruited. Table 1 illustrates the subject characteristics. Subjects were recruited from our outpatient cardiology practice over the course of approximately 6 months.
Subject characteristics.

Abbreviations: BMI, body mass index; HF, heart failure; OLD, obstructive lung disease; PAH, pulmonary arterial hypertension; RLD, restrictive lung disease.
All values are reported by mean and standard deviation.
Prior to participating in the study, the subjects were informed about the sequence of the study protocol and completed informed consent. Thereafter, they underwent simplified spirometry (pulmonary function tests) at rest and underwent an incremental submaximal exercise test. The exercise mode was a 6-minute test and it consisted of 2-minute rest, 3-minute submaximal exercise using a 5.75-inch step with a metronome used to guide the step frequency followed by1-minute recovery. During submaximal exercise, the step frequency was increased every minute targeting 60, 80, and 100 steps or foot movements per minute (equal to 15, 20, and 25 actual steps up per minute). During exercise, heart rate (HR) and Sp
For this study, we present our primary metrics for the algorithm used and display how these variables compare for each of the disease silos of interest, including cardiac disease, pulmonary vascular disease, OLD, and RLD. This includes essentially incorporating previously published cardiorespiratory normative values and abnormalities obtained during exercise from the literature, creating normative and disease severity ranges and ranking disease likelihood accordingly. From the literature and our previous work, key variables were selected for each disease category and illustrated as disease silos. For the HF silo, ventilatory efficiency (VE/VCO2) slope,5,6 oxygen pulse to oxygen consumption (O2p/V
Algorithm following disease categories and cutoff values based on disease severity.

Abbreviations: CircEqV
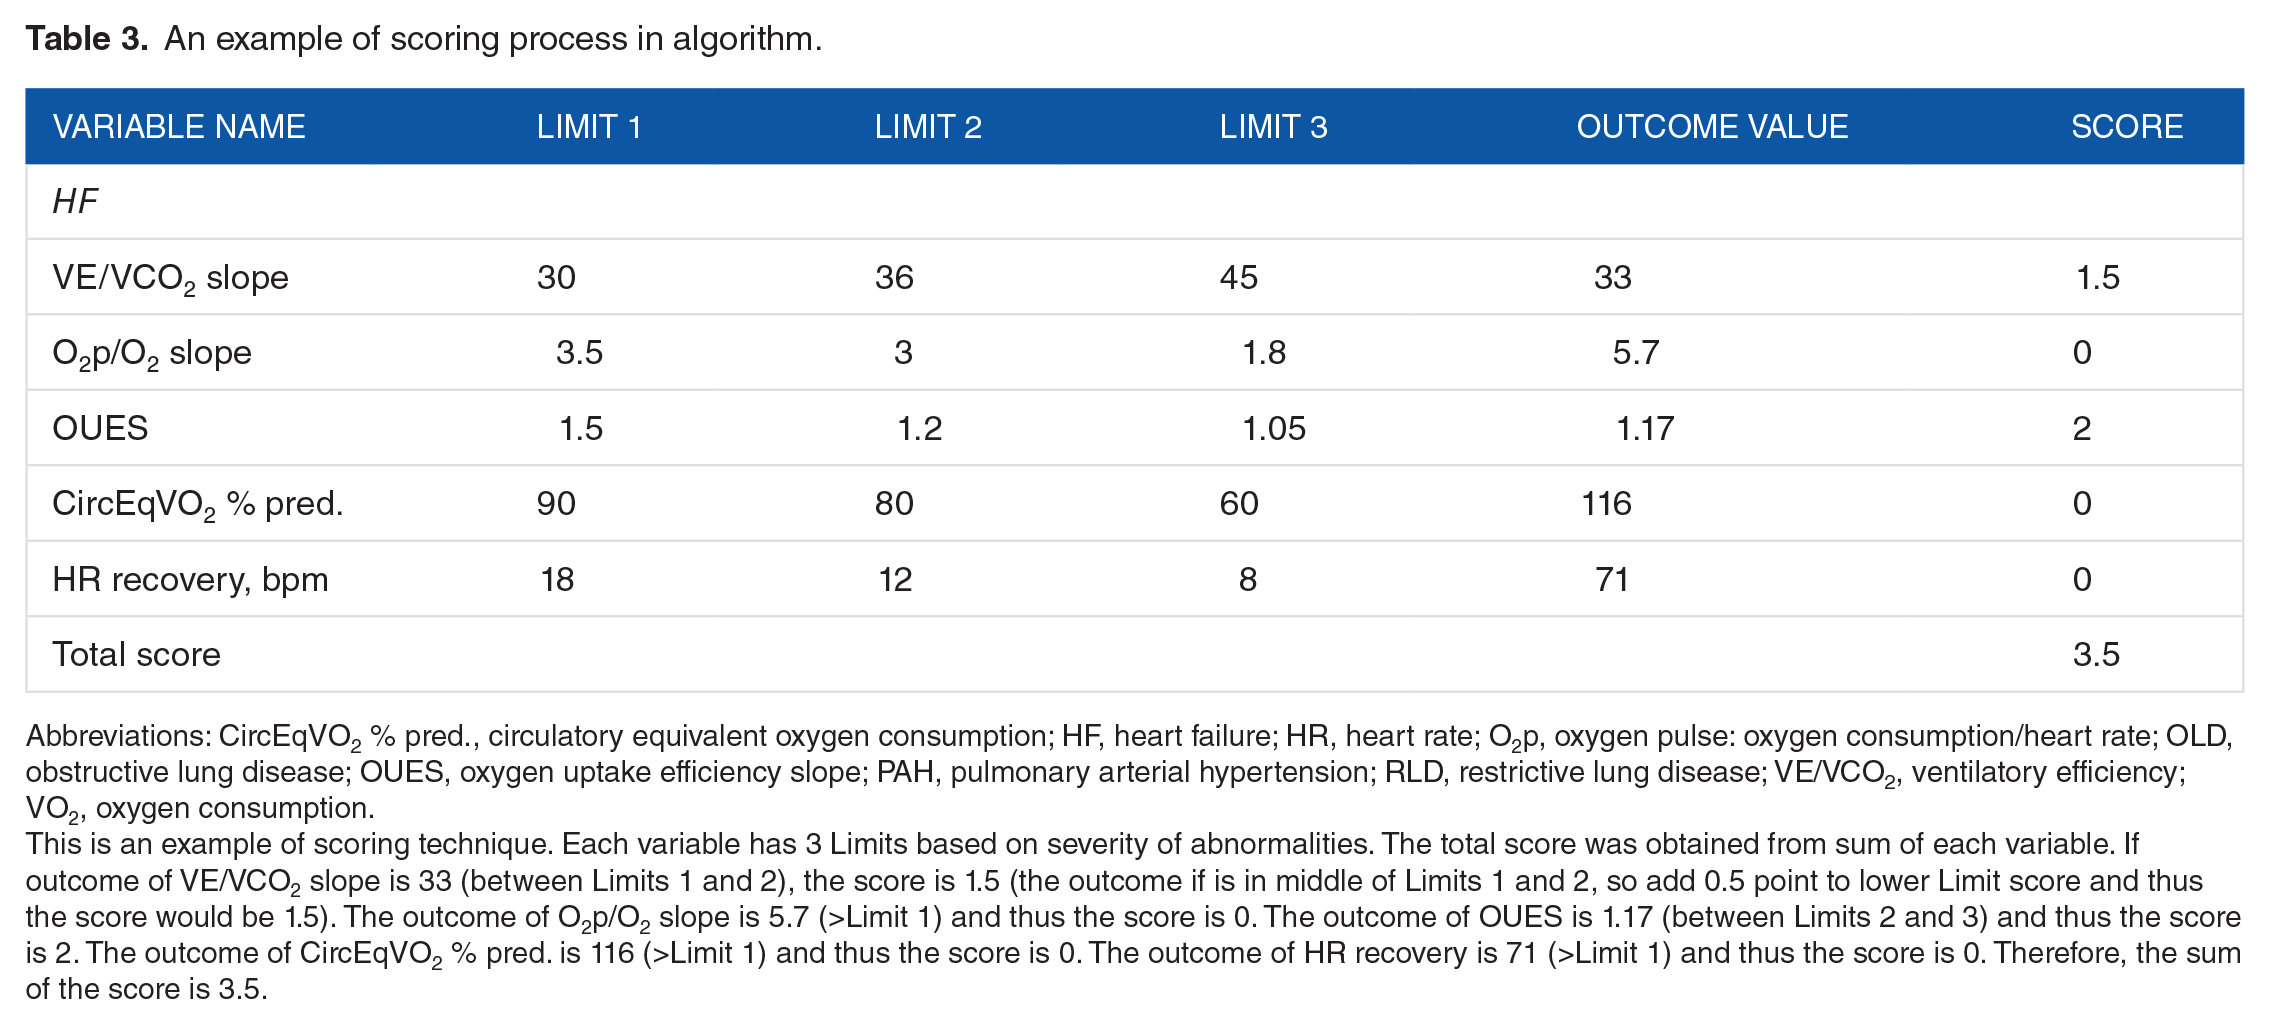
Table 3 is an example of the scoring technique for the algorithm explaining how a score was derived. Each disease category has 3 Limits (risk cutoff values) based on the severity of abnormality or how far a value deviated from normal. The outcome which is less or greater (depending on variables) than the value of Limit 1 was the normal range, and thereafter as the Limit increased, the score increased (Normal: 0 point, Limit 1: 1 point, Limit 2: 2 points, and Limit 3: 3 points). After obtaining all points from each variable, all points were averaged to obtain the final score. In the results, a higher score was associated with a more severe pathology or as we refer to as the likelihood for more severe pathology. To determine the capability of key variables for differentiating disease pathology and the sensitivity of silos, nonparametric analyses of variance (ANOVAs) were conducted. Subsequently, post hoc analysis was performed to demonstrate the differences between disease groups. The significance was set at .05.
An example of scoring process in algorithm.
Abbreviations: CircEqV
This is an example of scoring technique. Each variable has 3 Limits based on severity of abnormalities. The total score was obtained from sum of each variable. If outcome of VE/VCO2 slope is 33 (between Limits 1 and 2), the score is 1.5 (the outcome if is in middle of Limits 1 and 2, so add 0.5 point to lower Limit score and thus the score would be 1.5). The outcome of O2p/O2 slope is 5.7 (>Limit 1) and thus the score is 0. The outcome of OUES is 1.17 (between Limits 2 and 3) and thus the score is 2. The outcome of CircEqV
Results
When compared with the healthy group, the HF group demonstrated significantly impaired VE/VCO2, OUES, CircEqV
Each disease patient vs healthy subjects.

Abbreviations: CircEqV
Bold values denote significant difference from healthy group. All values are reported by mean and standard deviation.
Significant difference between groups.
Significantly different values when comparing with each disease silo.
In the HF silo (Figure 1), HF demonstrated the highest score and was significantly different from OLD, RLD, and healthy groups (P < .05) except PAH (P > .05). In the PAH silo (Figure 1B), PAH showed the highest score and was significantly different from HF, OLD, and healthy groups (P < .05) but not RLD (P > .05). In addition, in the RLD silo, RLD demonstrated the highest score and was significantly different from PAH, OLD, and healthy groups (P < .05; Figure 1D) but not different from HF (P > .05). Based on ANOVA, there was no significant difference across groups in the OLD silo (P > .05), despite the higher score in the OLD group relative to the other primary disease entities. However, if we compared one group at a time with the OLD silo, we do note that when performing independent t tests, the OLD group was different from PAH and RLD, but not HF.

Silo score distribution. (A) Heart failure (HF) silo: * denotes a significant difference from HF. (B) Pulmonary arterial hypertension (PAH): * denotes a significant difference from PAH. (C) Obstructive lung disease (OLD): * denotes a significant difference from OLD. (D) Restrictive lung disease (RLD): * denotes a significant difference from RLD.
Discussion
We recruited patients based on clinical diagnoses in each of the 4 primary disease categories to determine how well a simple, novel algorithm tracked these disease entities with cardiorespiratory measures from a simplified submaximal exercise test. A challenge of such a test is the fact that rarely does a single chronic disease entity exists without comorbidities, but in general, we have found that the disease likelihood algorithm score ranked the primary disease pathology the highest in most categories. However, it is clear that chronic cardiorespiratory disease has pathology that typically affects both the heart and lungs, and although this makes it challenging to identify a primary disease pathology or exercise limitation, the algorithm developed allows a method to weight and display multiple disease entities and therefore better visualize and understand contributors to exercise intolerance.
In clinical practice, noninvasive measures of respiratory gas exchange, breathing pattern, and other variables (eg, Sp
In this study, the disease likelihood scoring per primary disease entity ranked the primary referral disease the highest in most silos, and this may suggest that the algorithm was capable of differentiating disease. However, each disease silo demonstrated coexistent disease pathologies. Given the intimate relationship of the heart and lungs, it is no surprise that when evaluating these seemingly diverse groups, multiple silos also register or “light up” other than the primary one. For example, it is well known that many patients with HF develop pulmonary hypertension, obstructive, and restrictive pulmonary disorders, and subjects are often overweight, further contributing to their restrictive lung presentation. Furthermore, patients with PAH may be cardiac limited due to the high pulmonary vascular resistance and also often develop restrictive lung changes. Obstructive lung disease is also a complex disease that includes not only airway obstruction but also degradation of the pulmonary vasculature, areas of hypoxic pulmonary vasoconstriction, and mixed or a restrictive component to their disease. In our own data, it was clear that these comorbidities exist together, and even with our attempts to find subjects with a “primary” disease entity, it was clear that these rarely exist on their own. Thus, although an attempt was made to develop an algorithm to weight a particular disease state, it is clear in reality that many of these patients have coexistent issues that contribute to gas exchange abnormalities as well as to exercise intolerance.
Although this study demonstrated the capability of a simplified automated algorithm to identify primary disease pathology, a relatively smaller sample size limits the ability to address the findings. A larger number of subjects per group would have strengthened the study and help confirm the preliminary outcomes.
Conclusions
We have attempted to create an approach to clinical exercise testing that could greatly simplify testing and reduce complexities around interpretation. To do this, we developed an automated algorithm based on classic measures of breathing pattern, respiratory gas exchange, pulse oximetry, as well as use of simplified spirometry. This algorithm, for the most part, appeared to isolate patient groups relative to their primary pathology. In addition, it demonstrated that chronic cardiorespiratory disease does not typically exist alone but rather tends to coexist with other pathologies of the heart and lungs. Future studies will need to determine the utility of this type of submaximal testing and algorithm relative to traditional clinical expert test interpretation.
Footnotes
Acknowledgements
The authors appreciate the volunteer participation of our subjects.
Peer Review:
Three peer reviewers contributed to the peer review report. Reviewers’ reports totaled 718 words, excluding any confidential comments to the academic editor.
Funding:
The author(s) disclosed receipt of the following financial support for the research, authorship, and/or publication of this article: The study was funded by Shape Medical Systems Inc.
Declaration of Conflicting Interests:
The author(s) declared no potential conflicts of interest with respect to the research, authorship, and/or publication of this article.
Author Contributions
C-HK, JEH, DJM, and BDJ conceived and designed the experiments; analyzed the data; contributed to the writing of the manuscript; agree with manuscript results and conclusions; made critical revisions; and approved the final version. C-HK and BDJ wrote the first draft of the manuscript. JEH and DJM jointly developed the structure and arguments for the paper. All authors reviewed and approved the final manuscript.
Disclosures and Ethics
As a requirement of publication, authors have provided to the publisher signed confirmation of compliance with legal and ethical obligations including but not limited to the following: authorship and contributorship, conflicts of interest, privacy and confidentiality, and protection of human subjects. The authors have read and confirmed their agreement with the ICMJE authorship and conflict of interest criteria. The authors have also confirmed that this article is unique and not under consideration or published in any other publication, and that they have permission from rights holders to reproduce any copyrighted material. Any disclosures are made in this section. The external blind peer reviewers report no conflicts of interest.