
Abstract
Background:
Despite several prediction models to estimate cardiovascular risk (CVR) being available, most have been developed and validated in populations under 70 years of age. To improve this estimation in older adults aged 70 years or older, the SCORE2-OP model was developed; however, its application outside Europe may under- or overestimate true CVR.
Objective:
To assess the concordance between the CVR measured by 4 widely used CVR tools (Framingham, ASCVD-2013, SCORE2) and the SCORE2-OP in older adults aged ⩾ 70 years.
Methods:
Secondary analysis of adults aged ⩾ 70 years from the SABE Colombia study, which was conducted between April and September 2015. The concordance between the 4 different CVR prediction models and SCORE2-OP was assessed via Cohen’s quadratically weighted kappa coefficient and Lin’s concordance correlation coefficient.
Results:
Among the 23 694 participants in the SABE Colombia study, 23 108 were excluded due to insufficient data to estimate the CVR for any of the tools evaluated. 586 individuals met the inclusion criteria and were analyzed. The concordance between the ASCVD-2013 (weighted kappa 0.24; 95% CI 0.22-0.26) and Framingham algorithms (0.22; 95% CI 0.20-0.24) calibrated to the Colombian population and SCORE2-OP were both classified as fair. In contrast, agreement between SCORE2 calibrated for Colombia and SCORE2-OP reached a moderate level (0.43; 95% CI 0.40-0.46). Higher values were observed compared with the SCORE2-OP model developed for intermediate-risk regions.
Conclusions:
Our results suggest that, among adults aged ⩾ 70 years, there is variable agreement between widely used CVR prediction models and SCORE2-OP, with the latter overestimating CVR compared to nationally validated CVR scores. This highlights the need for region-specific validation to ensure accurate estimation of CVR in this population.
Keywords
Introduction
The global population is undergoing a continuous and dynamic aging process that is progressing at a faster rate than it has been in previous decades.1 -3 It is projected that the proportion of the global population over the age of 60 will nearly double between 2015 and 2050, increasing from 12% to 22%. Additionally, it is estimated that by 2050, 80% of older adults will live in low- and middle-income countries. 1
The prevalence of cardiovascular disease (CVD) increases dramatically with age. It reaches 86% in patients 80 years of age or older and 75% in patients 60 to 79 years of age. This represents a major public health concern and underscores the importance of age-specific prevention and management strategies.4,5
Furthermore, social determinants of health have been associated with the incidence of CVD in Latin America, indicating that socioenvironmental and economic factors exacerbate cardiovascular risk (CVR).6 -8 These disparities could cause widely used CVR models to overestimate or underestimate the CVR in vulnerable populations, such as older adults, especially those aged 70 or older, who might benefit from primary prevention strategies.
To address this issue, the SCORE2-OP CVR estimation tool was developed, 9 although few studies have evaluated the degree of concordance between the widely used CVR prediction tools and the SCORE2-OP. 9 Particularly in our country, the SCORE2-OP has not been externally validated or calibrated, whereas other CVR scales, such as ASCVD-2013, SCORE2, or Framingham, have. 10
Moreover, although 6 CVR scores have recently undergone external validation and calibration in Colombia, 10 showing that these conventional CVR scores tend to overestimate the CVR in our country, the SCORE2-OP score was not among them, leaving an important gap in the evidence regarding its utility for estimating the CVR in adults aged 70 years and older. This study aimed to assess the concordance between CVR measured by ASCVD-2013, Framingham, and SCORE2 calibrated to Colombia, 10 with SCORE2-OP 9 in older adults aged 70 years or older.
Methods
Design, Context and Data Collection
This study constitutes a secondary analysis of a cross-sectional survey conducted between April and September 2015, known as the SABE study, which included a sample of 23 694 older adults. 11 This survey was carried out as a multicenter initiative led by the Pan American Health Organization, with support from the Epidemiological Office of Colombia’s Ministry of Health.
To obtain a representative sample of the older adult population, the survey targeted Colombian individuals aged 60 years and above, employing a combination of purposive and random sampling methods across both urban and rural areas. To ensure the reliability of the data, trained personnel collected information through personal interviews and physical assessments following standardized protocols. 11
The data processing and coding for the 2015 SABE study included a thorough review and validation phase to ensure the accuracy of the data and their internal consistency. Errors, such as duplicate entries, logical inconsistencies, and out-of-range values, were identified and corrected. Closed-ended responses were assigned numerical codes, and open-ended responses were manually categorized according to predefined coding frameworks. Each participant was assigned a unique identifier, and the data were standardized in accordance with the survey’s variable dictionary to ensure uniformity across the dataset. 11
Digital data entry was performed either manually or through direct input from electronic devices, depending on the design of the data collection instrument. Subsequently, statistical software such as SPSS, Stata, or R was employed to organize and process the data, following the coding guidelines and variable dictionary established by the survey. 11
For this secondary analysis from the SABE study, 11 we included patients who were 70 years or older and excluded those who had insufficient data to calculate their CVR according to Framingham, ASCVD-2013, SCORE2 and SCORE2-OP. We also excluded those with a history of prior acute myocardial infarction or stroke.
The reporting of the study adhered to the Strengthening the Reporting of Observational Studies in Epidemiology (STROBE) guidelines for cross-sectional research. 12 In addition, we used the STROBE reporting checklist 13 for editing, which is included in the Supplemental material. Ethical approval for the secondary analysis conducted in this study was granted by the institutional ethics and research committee (CIE-0530-25). Moreover, owing to the nature of the study, as it was an anonymized secondary analysis of a national database available for research use, informed consent was not needed. Moreover, the study was carried out in accordance with the latest version of the Declaration of Helsinki.
Operational Definitions of the Variables
CVR was assessed via Framingham, ASCVD-2013, and SCORE2 calibrated to Colombia. 10 Since SCORE2 does not permit the entry of ages 70 or older, it was estimated via the original equation in the statistical software R, with every value of 70 years or older assumed to be 70 years. In addition, as SCORE2-OP has not been externally validated in Colombia, it was calculated without a conversion factor. For both SCORE2 and SCORE2-OP, the high-risk algorithm was applied in accordance with the standardized overall cardiovascular mortality rates (per 100 000 population) observed in the Colombian population. 14
Regarding CVR categorization, because the original versions of the 4 CVR models have different categories and thresholds for their absolute CVR results as percentages and because assessing their agreement with these original categories would not be feasible or appropriate, the absolute CVR was initially estimated as a percentage for each of the 3 equations—ASCV-2013, Framingham, and SCORE2—and then categorized using the SCORE2-OP categories to evaluate their agreement via quadratically weighted Cohen’s kappa. The thresholds from the SCORE2-OP used were low–moderate CVR risk, defined as a risk under 7.5%; high risk, between 7.5% and 15%; and very high risk, defined as a CVR of 15% or more. 9
Sample Size Estimation
Sample size was calculated using Hong et al’s method, 15 which enables estimation for agreement analysis based on the kappa statistic. This approach uses a non-central parameter (λ) to derive sample size according to predefined α and power (1–β) levels, accounting for the number of categories and their marginal prevalences. Using Hong’s nomogram for 3 categories, with assumed marginal prevalences of 0.3, 0.3, and 0.4, a power of 80%, and a 2-sided α of 0.05, the required sample size was 500 participants.
Statistical Analysis
Categorical variables are expressed as absolute frequencies and corresponding percentages. Continuous variables are reported as the means and standard deviation errors, as the data were distributed normally according to the Shapiro‒Wilk test.
To evaluate the degree of concordance between ASCVD-2013, Framingham and SCORE2 with SCORE2-OP, Cohen’s quadratically weighted kappa was estimated with its 95% confidence interval (CI). The interpretation of the Kappa coefficient value and its concordance degree was interpreted as suggested by Landis and Koch. 16
In addition, Lin’s concordance correlation coefficient (CCC) with its 95% CI was estimated between Framingham, ASCVD-2013, SCORE2 and the SCORE2-OP absolute percentage values. Furthermore, a sensitivity analysis was performed to estimate Lin’s CCC using the moderate-risk region algorithms for the SCORE2 and the SCORE2-OP due to the fluctuations in overall cardiovascular mortality rates (per 100 000 population) observed in the Colombian population over the past decades. 14 Statistical tests were 2-tailed, with a P value < 0.05 considered statistically significant. Analyses were performed via StataCorp Stata Statistical Software (Release 16). StataCorp LP, College Station.
Results
Among the 23 694 patients in the SABE Colombia 2015 study who were 70 years of age or older, 586 patients were included. The remaining 23 108 patients were excluded because they lacked the information necessary to estimate their CVR via the SCORE2-OP or to calculate their CVR via Framingham, ASCVD 2013, and SCORE2 validated for Colombia. 10 Specifically, of the 23 108 patients excluded, 18 588 were excluded because they did not have blood pressure measurements, 3558 because they did not have cholesterol level measurements, 278 because they had a history of acute myocardial infarction or stroke, and 684 because they were 69 years or under (Figure 1). The characteristics of the patients excluded from the SABE Colombia 2015 study are summarized in Supplemental Table 1. Gender, race identity, smoker status and physical activity were similar to those observed for included patients.

Study patient selection flowchart. AMI = acute myocardial infarction.
Among the 586 patients, 58.53% were women, 38.23% were mixed races, 40.44% had incomplete primary school education, 60.23% had hypertension, 14.85% had diabetes mellitus, and 84.47% were physically inactive. Similarly, the mean LDL cholesterol in the study population was 125 ± 33 mg/dl. Table 1 provides an extensive description of the sociodemographic characteristics of the population.
Sociodemographic Characteristics of the Population.
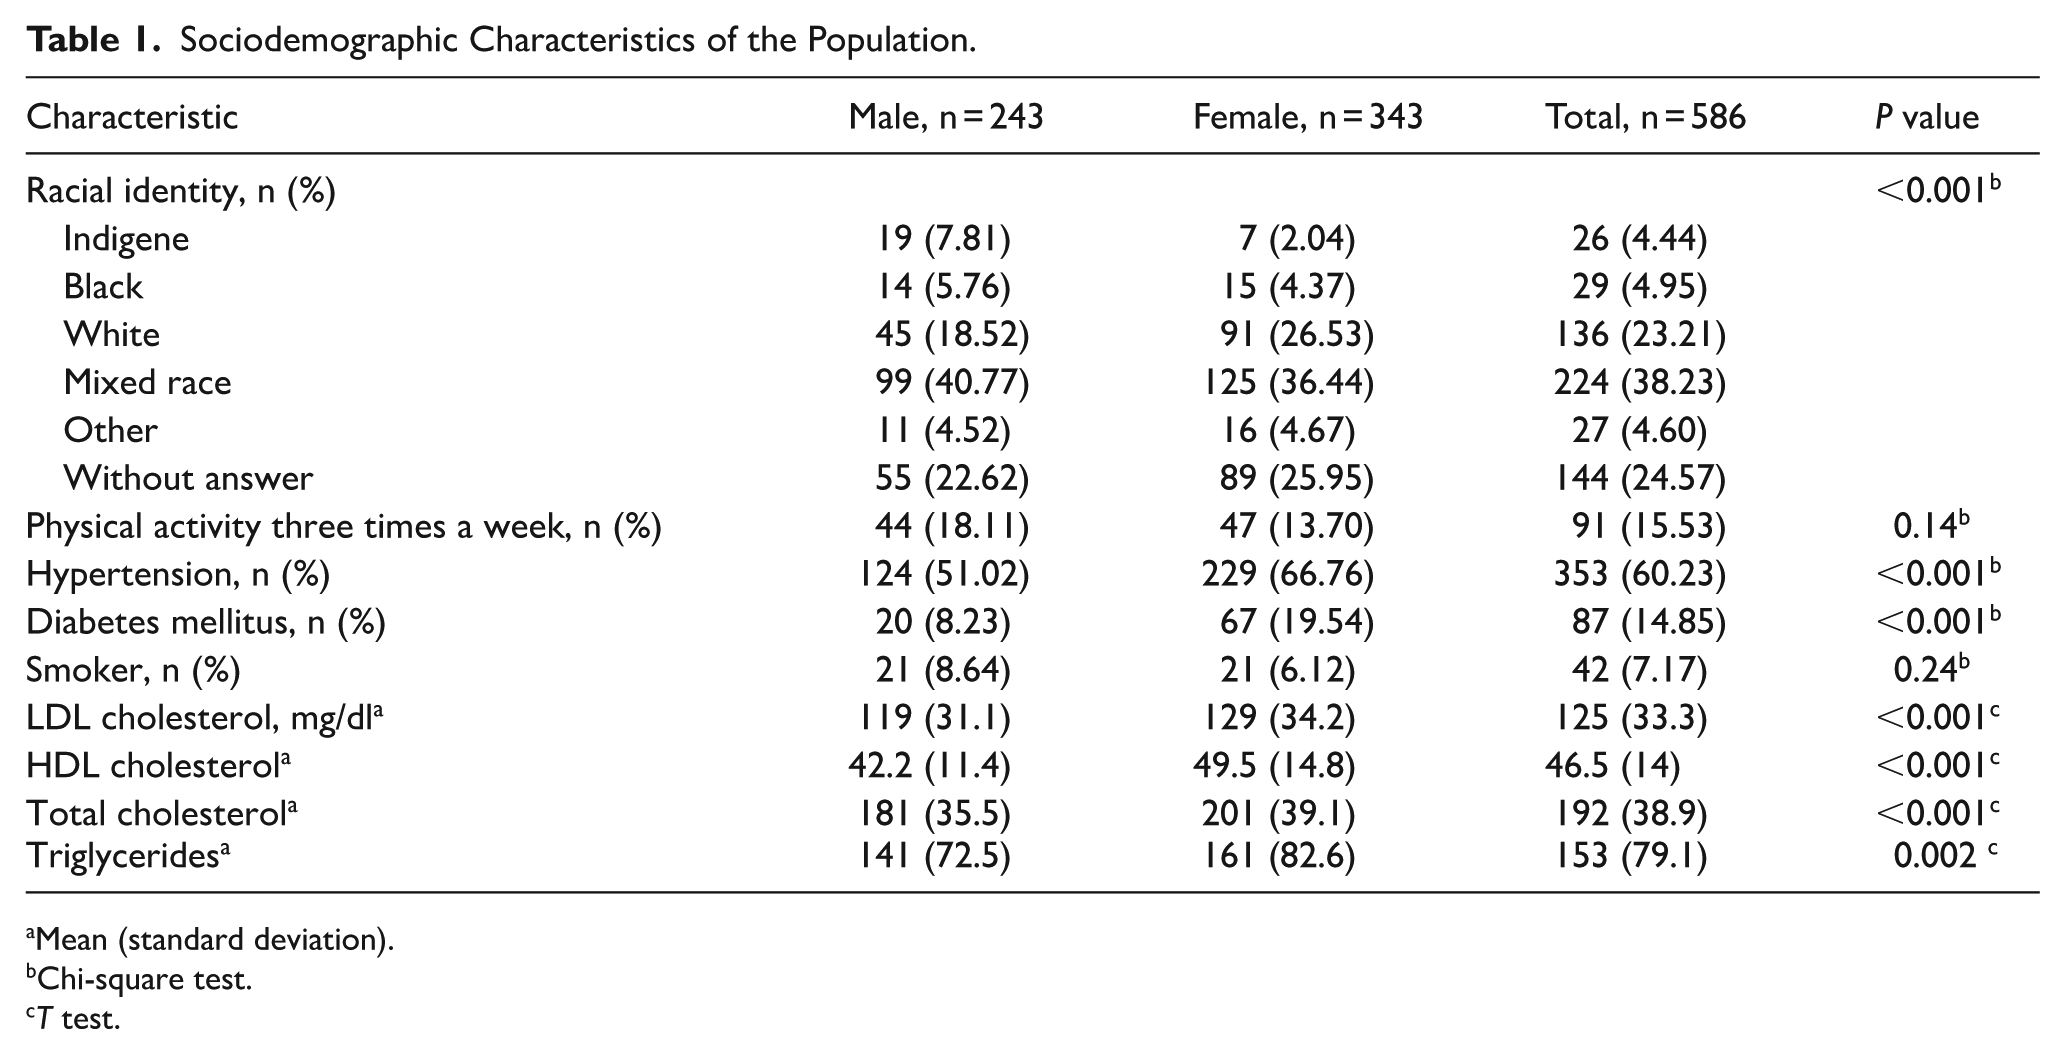
Mean (standard deviation).
Chi-square test.
T test.
CVR Categories Across the Four Prediction Models
Regarding the Framingham CVR categories calibrated to Colombia, 10 14.7% (n = 86) were at low-moderate risk, 48.8% (n = 286) were at high risk, and 36.5% (n = 214) were at very high risk. The risk categories according to the ASCVD-2013 calibrated to Colombia 10 were 17.2% (n = 101) at low-moderate risk, 44.5% (n = 261) at high risk, and 38.2% (n = 224) at very high risk.
With reference to SCORE2 calibrated to Colombia, 10 63.1% (n = 370) of the patients were at very high risk, and 35% (n = 205) were at high risk, with 1.9% (n = 11) of patients being in the low-moderate risk category. Similarly, concerning the SCORE2-OP CVR categories, 87.4% (n = 512) were at very high risk, 12.5% (n = 73) were at high risk, and 0.2% (n = 1) were at low-moderate risk.
Concordance Between Prediction Models
Cohen’s quadratically weighted kappa was 0.59 (95% CI: 0.55, 0.63; P < 0.01) for SCORE2-OP and ASCVD-2013 without calibration, 0.47 (95% CI: 0.43, 0.51; P < 0.01) for Framingham without calibration, and 0.89 (95% CI: 0.85, 0.93; P < 0.01) for SCORE2 without calibration. Table 2 summarizes the obtained weighted kappa coefficient values, as well as their 95% confidence intervals (CIs) and P values.
Cohen’s Quadratically Weighted Kappa Values Between the Estimated Cardiovascular Risk Between SCORE2-OP and ASCVD-2013, Framingham and SCORE2 Without Calibration. A. B. C.

The Cohen’s quadratically weighted kappa coefficient between SCORE2-OP and the other calibrated scores for Colombia 10 was significantly lower. The values were 0.24 (95% CI: 0.22-0.26, P < 0.01) for ASCVD-2013, 0.22 (95% CI: 0.20-0.24) for Framingham, and 0.43 (95% CI: 0.40-0.46, P < 0.01) for SCORE2. Table 3 summarizes the weighted kappa coefficients obtained, along with their corresponding 95% CIs and P values.
Cohen’s Quadratically Weighted Kappa Values Between the Estimated Cardiovascular Risk Between SCORE2-OP and ASCVD-2013, Framingham and SCORE2 Calibrated to Colombia. 10

Figure 2 presents Lin’s CCC between SCORE2-OP and the different scores without calibration. The highest value was obtained between SCORE2 and SCORE2-OP (CCC = 0.95; 95% CI = 0.94-0.96). Lin’s CCC was lower when SCORE2-OP was compared with different calibrated scales, with values ranging from 0.35 (95% CI 0.31-0.39) for Framingham to 0.67 (95% CI 0.64-0.70) for SCORE2 (Figure 2).

Concordance correlation coefficients (CCC) between SCORE2-OP (high-risk region algorithm, y-axis) and other cardiovascular risk prediction models (x-axis). Panels (A-C) show comparisons with international (uncalibrated) risk scores: (A) Framingham, (B) ASCVD-2013, and (C) SCORE2. Panels (D-F) show comparisons with Colombian-calibrated versions of the same scores: (D) Framingham-COL, (E) ASCVD-2013-COL, and (F) SCORE2-COL. The dashed line represents the line of perfect concordance (45° identity line), and the solid line represents the reduced major axis regression fit. CCC values with 95% confidence intervals are displayed within each panel.
Sensitivity analysis of Lin’s CCC using the moderate-risk region algorithm for SCORE2 and SCORE2-OP yielded similar values for scales not calibrated for Colombia: 0.47 (95% CI, 0.43-0.52) for SCORE2-OP and Framingham without calibration, 0.54 (95% CI, 0.51-0.57) for ASCVD-2013 without calibration, and 0.79 (95% CI, 0.77-0.81) for SCORE2 without calibration. Additionally, Lin’s CCC values between Framingham, ASCVD-2013, and SCORE calibrated to Colombia 10 were obtained, showing better performance than the values obtained with the algorithm for high-risk regions. Figure 3 summarizes Lin’s CCC results when the moderate-risk region algorithm is used.

Concordance correlation coefficients (CCC) between SCORE2-OP (moderate-risk region algorithm, y-axis) and other cardiovascular risk prediction models (x-axis). Panels (A-C) show comparisons with international (uncalibrated) risk scores: (A) Framingham, (B) ASCVD-2013, and (C) SCORE2. Panels (D-F) show comparisons with Colombian-calibrated versions of the same scores: (D) Framingham-COL, (E) ASCVD-2013-COL, and (F) SCORE2-COL. The dashed line represents the line of perfect concordance (45° identity line), and the solid line represents the reduced major axis regression fit. CCC values with 95% confidence intervals are reported in each panel.
Discussion
This study evaluated the degree of concordance between 3 widely used CVR prediction models and the SCORE2-OP in adults aged 70 years and older. The findings revealed that the level of agreement varied depending on the specific models being compared, but it was not perfect or almost perfect for any scale.
For example, the quadratically weighted kappa coefficient values between the SCORE2-OP and ASCVD-2013 scales and the Framingham scale calibrated for Colombia 10 indicated a fair degree of concordance; however, the values obtained between the SCORE2 values calibrated to Colombia 10 and SCORE2-OP demonstrated a moderate degree of agreement. However, regarding this latter result, it should be emphasized that we cannot rule out that, owing to the extremely skewed distribution of SCORE2-OP, the kappa coefficient was artificially inflated, overestimating the level of agreement; therefore, these values should be interpreted with caution.
Moreover, when the weighted kappa values were estimated between the prediction models without calibration (Framingham, ASCVD-2013 and SCORE2) and the SCORE2-OP, a better degree of agreement was obtained in ranges of concordance between moderate and substantial, suggesting that the results could be more consistent with scales that have not been calibrated in Colombia.
The results obtained via Lin’s CCC were similar to the high values obtained when comparing SCORE2 without calibration and SCORE2-OP and lower values obtained when comparing SCORE2-OP with Framingham and ASCVD calibrated to Colombia, 10 using the high-risk region algorithm for SCORE2 and SCORE2-OP. When the moderate-risk region algorithm was applied to SCORE2 and SCORE2-OP, the Lin’s CCC values were better in the calibrated prediction models.
These results highlight that the 4 CVR prediction models should not be used interchangeably and that they would be inadequate for clinical decisions regarding CVRs that require high precision. Additionally, these results could be explained by the fact that the SCORE2-OP scale is not calibrated for Colombia; therefore, it tends to overestimate the estimated CVR for the Colombian population in a similar way to previous findings in younger populations. 10
Moreover, in another study carried out by Muñoz et al, which was carried out in patients between 40 and 69 years of age, a kappa coefficient of concordance was calculated between the high-risk category according to the SCORE prediction model via both the low- and high-risk country algorithms. In their study, they also reported a fair degree of concordance between the Framingham high-risk category and the SCORE high-risk category via the low-risk country algorithm, with a kappa coefficient value of .28, and a similar concordance degree, with a kappa coefficient value of .22, via the high-risk country algorithm. 17
Similarly, another study conducted in older adults aged 60 years or older by our lab revealed that although significant concordance was demonstrated between the highest CVR categories from Framingham, ASCVD-2013 and SCORE2 calibrated to Colombia, the degree of concordance was slight between Framingham and global SCORE2 (Kappa coefficient value 0.16, P value < 0.0001) and between ASCVD-2013 and global SCORE2 (Kappa coefficient value 0.15, P value < 0.0001); however, a moderate degree of concordance was found between Framingham and ASCVD-2013 (Kappa coefficient value 0.48, P value < 0.0001). 18
Similarly, in the validation study performed by van Trier et al., 19 which was designed with the aim of evaluating discrimination, calibration, and clinical utility from the SCORE2 and SCORE2-OP using the European Prospective Investigation of Cancer Norfolk prospective cohort study, the SCORE2 low-risk model had fair discrimination and calibration, with an area under the curve (AUC) of 0.75 (95% CI 0.74-−0.77) and an observed (O)/expected (E) ratio of 1 (95% CI 1.0-1.1), in addition to having clinical benefit for preventive treatment initiation decisions. However, in that study, 19 in older adults aged 70-79 years, SCORE2-OP showed poor discriminatory capacity, with the CVR being underestimated in both sexes, with an AUC of 0.63 (95% CI 0.60-0.65) and an O/E ratio of 1.6 (95% CI 1.5-1.7), respectively, indicating limited clinical utility.
Moreover, another Asian cohort study with 324 384 subjects, which was designed with the purpose of evaluating the performance of the SCORE/SCORE-OP and the SCORE2/SCORE2-OP in the East Asian population, also revealed that both the SCORE/SCORE-OP and SCORE2/SCORE2-OP prediction models overestimate the CVR in the Asian population. 20 Furthermore, in another study conducted by Sud et al 21 involving a Canadian cohort of 9885 individuals aged 70-89 years, the application of the SCORE2-OP algorithm was found to overestimate the CVR in this population.
Additionally, in Latin America, few studies have aimed to validate a CVR prediction model for older adults aged 70 years or older, such as that carried out by Hierrezuelo et al 22 in Cuba, who designed their own new cardiovascular prediction model, which demonstrated a better discriminatory capacity than the CVR EPICARDIAN Spain scale. 23
Finally, when CVR in older adults is measured, traditional risk prediction models do not consider the competitive risk of non-CVD mortality, which could affect the estimated risk.24,25 Therefore, in the latest guidelines from the European Society of Cardiology, the use of the updated SCORE2 and SCORE2-OP has been recommended, which include significant updates compared with previous versions, including adjustments for the noncompetitive risk of noncardiovascular mortality.9,26 Moreover, when we estimated the CVR across the 4 models, the CVR equations employed did not handle competing risks.
Together, the evidence described above and our findings underscore that validation and risk score calibration according to the specific region are needed across the widely used CVR prediction models used in older adults aged 70 years or older, including the last version of the SCORE2-OP, which has the advantage of adjusting for competing non-CVD mortality, 9 to accurately estimate the CVR in this vulnerable population.
Furthermore, SCORE2-OP tends to overestimate the CVR with respect to the 3 CVR equations, which were calibrated to Colombia (ASCVD 2013, Framingham, SCORE2), 10 both when it is compared with the absolute predicted percentage risk using the CCC and even when it is compared with the CVR stratified by categories. Similarly, this tendency of SCORE2-OP to overestimate the CVR was observed even when the high-risk region algorithm or the moderate-risk region algorithm was employed to estimate the CVR with SCORE2-OP and SCORE2. Because of this, a possible alternative to consider could be not to estimate the CVR via this scale and to treat this population according to the current clinical practice guidelines.26 -28
Our findings imply that it is not reasonable to assume that CVR estimation via conventional models (Framingham, ASCVD-2013, and SCORE2) is acceptable. The SCORE2-OP scale should not be used without validation in our context. According to current national and international guidelines, each patient’s treatment should be tailored to their unique needs while considering recommendations for this population. Using these scales could lead to increased and unnecessary treatment costs and increase the risk of adverse events related to statin treatment.
Despite our large sample size and the fact that the degree of concordance was evaluated via calibrated and uncalibrated CVR prediction models, our study has certain limitations. First, owing to the cross-sectional nature of our design the predictive ability cannot be measured. Second, it is possible that biases commonly associated with survey-based research, such as selection bias, nonresponse bias, recall bias, and information bias, may not have been entirely avoided. However, the qualitative variables used to estimate the CVR in the 4 predictive models, such as age, sex, smoking status, and the presence of diabetes or hypertension, were relatively simple for participants to recall and answer accurately. Furthermore, quantitative variables, including systolic blood pressure, total cholesterol, and high-density lipoprotein (HDL) cholesterol, were obtained through direct measurement during the survey.
Third, we were able to include only 586 patients from the SABE study, 11 however, it is worth noting that 18 588 were excluded because they did not have blood pressure measurements, 3558 because they lacked serum cholesterol measurements, 278 because of a history of myocardial infarction, and 684 because they were 69 years of age or younger—all of which were exclusion criteria for the study.
An additional limitation concerns how age was handled in SCORE2, which was capped at 70 years. This could lead to older adults being misclassified. This was necessary because the scale was designed for patients aged 40 to 69, and the calculator does not allow higher values to be included in order to avoid overestimation, as it does not take into account the competitive risk of death from other causes. Although SCORE2-OP was specifically developed for individuals aged 70 and over, it has not yet been validated or calibrated in Colombia. As our primary aim was to examine the concordance between Colombian-calibrated SCORE2 and other established models, we adopted this approach while explicitly acknowledging its methodological limitations.
Finally, another limitation is the year of data collection (2015), which may not fully reflect the current frequency of risk factors, considering the rapid change in life expectancy in Latin America. Therefore, future contemporary studies may be needed to confirm our results.
Conclusion
Our results suggest that there is only moderate concordance between commonly applied cardiovascular risk (CVR) prediction models and SCORE2-OP for adults aged 70 years and over. This model tends to overestimate risk compared to risk obtained from nationally validated tools. These findings emphasize the importance of region-specific validation of the model to accurately estimate CVR and of an individualized approach to managing CVR in this population until validated scales are available.
Supplemental Material
sj-docx-1-cic-10.1177_11795468251406976 – Supplemental material for Agreement Between Cardiovascular Risk Assessment Models (SCORE2, Framingham, ASCVD-2013, and SCORE2-OP) in Adults Aged 70 Years or Older: A Population-Based Study
Supplemental material, sj-docx-1-cic-10.1177_11795468251406976 for Agreement Between Cardiovascular Risk Assessment Models (SCORE2, Framingham, ASCVD-2013, and SCORE2-OP) in Adults Aged 70 Years or Older: A Population-Based Study by Cristian Orlando Porras Bueno, Hector Henry Lindarte Vargas, Maria Paula Ravagli Baquero, Fabian Gil, Oscar Mauricio Muñoz Velandia and Ángel Alberto García Peña in Clinical Medicine Insights: Cardiology
Footnotes
Acknowledgements
To the Pontifical Xavierian University for promoting research.
Ethical Considerations
This study was approved by the institutional ethics committee (CIE-0530-25).
Consent to Participate
Informed consent to participate was initially fulfilled for all the SABE study participants, and for this secondary analysis, it has been waived by the institutional ethics committee.
Author Contributions
PBCO: conceptualization, data curation, formal analysis, investigation, methodology, project administration, supervision, validation, writing (original draft), writing review, and editing. HHFL: conceptualization, data curation, formal analysis, investigation, methodology, project administration, supervision, validation, writing (original draft), writing review, and editing. MPR: conceptualization, data curation, formal analysis, investigation, writing (original draft), review, and editing. FG: conceptualization, data curation, formal analysis, investigation, writing (original draft), review, and editing. OMMV: conceptualization, data curation, formal analysis, investigation, writing (original draft), review, and editing. ÁAGP: conceptualization, data curation, formal analysis, investigation, methodology, project administration, supervision, validation, writing (original draft), writing review, and editing.
Funding
The authors disclosed receipt of the following financial support for the research, authorship, and/or publication of this article: This article has been funded by the Pontifical Xavierian University.
Declaration of Conflicting Interests
The authors declared no potential conflicts of interest with respect to the research, authorship, and/or publication of this article.
Data Availability Statement
The data that support the findings of this study are available from the corresponding author upon reasonable request and in compliance with the General Data Protection Regulation.
Supplemental Material
Supplemental material for this article is available online.
References
Supplementary Material
Please find the following supplemental material available below.
For Open Access articles published under a Creative Commons License, all supplemental material carries the same license as the article it is associated with.
For non-Open Access articles published, all supplemental material carries a non-exclusive license, and permission requests for re-use of supplemental material or any part of supplemental material shall be sent directly to the copyright owner as specified in the copyright notice associated with the article.