
Abstract
Background:
Blood pressure (BP) variability has been recognized as a significant risk factor for cardiovascular diseases (CVD). We aim to evaluate the association between mean arterial pressure (MAP) variability and the increased risk of ischemic heart disease (IHD) and ischemic stroke (IS) among hypertensive patients in Thailand.
Methods:
We analyzed data from the Thailand DM/HT study, which included hypertensive patients nationwide in 2014 to 2015 and 2018. MAP variability was computed based on the MAP values across 3 visits within 1 year and expressed as standard deviation (SD). We used multivariable log-binomial regression models to evaluate the associations between MAP variability and the risk of IHD and IS.
Results:
Among 92 854 individuals, 594 new-onset IHD events (0.64%) and 187 IS incidents among 95 486 individuals (0.20%). Compared to the lowest quartile (Q1), higher quartiles of SD were associated with increased risk of IHD, with adjusted risk ratios (aRRs) of 1.06 (95% confidence interval [CI]: 0.82-1.38) for Q2, 1.35 (95% CI: 1.06-1.72) for Q3, and 1.50 (95% CI: 1.18-1.90) for Q4. Similarly, higher SD quartiles raised the risk of IS, with aRRs of 1.35 (95% CI: 0.83-2.20) for Q2, 1.56 (95% CI: 0.98-2.48) for Q3, and 1.97 (95% CI: 1.26-3.07) for Q4, when compared to Q1.
Conclusion:
Our study demonstrated that higher visit-to-visit MAP variability in hypertensive patients was strongly associated with an increased risk of CVD. We emphasize the importance of incorporating BP variability into management strategies to help reduce the risk of CVD in these patients.
Keywords
Background
Prior studies consistently demonstrated the strong association between high blood pressure (BP) and the risk of cardiovascular disease (CVD), including ischemic heart disease (IHD) and ischemic stroke (IS).1 -6 Additionally, high BP variability was shown to significantly raise the risk of CVD and mortality, independent of mean BP levels.7 -11 Consequently, BP variability has emerged as a crucial risk factor for CVD and can provide more accurate predictions for clinical outcomes in adults. 12
The cyclic BP curve is determined by 2 distinct phenotypes: pulse pressure, which corresponds to large artery stiffness and wave reflections, and mean arterial pressure (MAP), which reflects the resistance of the microvascular network. 13 MAP provides a more comprehensive view of the average pressure in the arteries throughout the cardiac cycle. In contrast, systolic blood pressure (SBP) and diastolic blood pressure (DBP) only capture the peak pressures during systole and diastole, respectively. 14 Previous studies revealed that MAP serves as a more effective predictor of CVD risk than SBP and DBP. 15 Furthermore, prior research reported that MAP and overall CVD events were positively associated, including IHD, IS, and CVD deaths.15,16
Few studies assessed the potential impact of MAP variability on CVD outcomes. For example, recent evidence from the Atherosclerosis Risk in Communities (ARIC) study indicated that increased visit-to-visit MAP variability is a significant risk factor for heart failure (HF) and all-cause mortality. 17 Furthermore, although machine learning has been implemented using various variables in the existing dataset to predict CVD, such as coronary heart disease, MAP variability has not yet been incorporated into these models. 18 This omission reflects insufficient evidence regarding the relationship between MAP variability and CVD.
Hypertension (HTN) is a common chronic medical condition affecting approximately one-fourth of Thai adults. 19 Among Thai patients with HTN, IHD and IS are the most prevalent CVD complications, and they remain the leading causes of mortality in the Thai population.5,6,20 -22 Despite the high prevalence of HTN, limited information is available on the BP variability, particularly in MAP, and its association with CVD outcomes in patients with HTN. Therefore, our study seeks to investigate the association between visit-to-visit MAP variability and the risk of IHD and IS among patients with HTN who receive continuous care in Thailand.
Methods
Study Design and Subjects
We employed data from the 2014, 2015, and 2018 Thailand DM/HT studies. The study was supported by the National Health Security Office (NHSO) to conduct a series of annual surveys designed to evaluate the clinical outcomes of individuals with HTN and/or type 2 diabetes (T2D) aged 20 years or older who were receiving care at clinics in hospital nationwide in Thailand. 23 The study sample comprised 101 661 individuals with HTN who were enrolled in 2014, 2015, and 2018.
Figure 1 presents the eligible participants and the total number of participants included in the analysis. Regarding the availability of data based on Thailand DM/HT study data, BP information for each patient’s last 3 visits within 1 year was extracted from the medical records. To examine the association between visit-to-visit MAP variability and IHD incidence, we excluded 4011 individuals with a history of IHD at baseline (before 12 months from the date of data collection) and those without complete 3 BP measures within 1 year. This resulted in a final analysis sample of 92 854 participants without IHD at baseline and having 3 BP measurement records. Moreover, we assessed the association between visit-to-visit MAP variability and IS incidence by excluding 1255 individuals with a prior history of IS and those lacking complete 3 BP measurements within 1 year. This led to a final analysis sample of 95 486 participants without IS at baseline and having 3 BP measurement records.

Study flowchart with detailed study exclusion information.
Data Collection
Sakboonyarat et al published the details of data collection for the Thailand DM/HT study.23,24 The study involved a proficient registered nurse meticulously reviewing and extracting the data using a case report form (CRF) based on a standardized protocol. Then, the data were sent to the data management unit. The study participants’ characteristics encompassed several factors, such as sex, age, health insurance scheme, geographical region, hospital levels where patients receive HTN care, comorbidities (such as T2D, dyslipidemia, renal insufficiency, and atrial fibrillation), smoking status, weight, height, and antihypertensive medications, which were duly documented for analysis.
Typically, the attending physician documents information regarding patients with HTN diagnosed with CVD complications using the International Classification of Diseases, Tenth Revision (ICD-10) codes. Additionally, well-trained hospital staff conduct audits of the medical record reviews to ensure that the ICD-10 codes and diagnoses are used accurately. In the Thailand DM/HT study, the skilled registered nurse abstracted information on CVD complications, including IHD and IS, based on the ICD-10 codes and completed the CRF.
Outcomes
According to data from the Thailand DM/HT study, information on IHD and IS was extracted from medical records using these ICD-10 codes. The incidence of IHD was defined as the occurrence of IHD as a new onset in patients with hypertension within a span of 12 months. The definition was based on the ICD-10 I20-I25 or a recorded history of coronary revascularization. 25 Furthermore, the incidence of IS was defined as a new case of IS among hypertensive individuals within a period of 12 months, determined in accordance with the ICD-10: I63. 25
Exposures
The study participants’ BP information, which included SBP and DBP, was collected in the last 3 visits within 1 year and utilized for analysis purposes. The MAP was calculated through the following formula: MAP = DBP + [1/3(SBP – DBP)].
26
Then, the average MAP levels were computed across 3 visits for each participant. The visit-to-visit MAP variability measurements were calculated as follows: the SDMAP =
Covariates
In this study, the covariates considered comprised demographic variables and health-related information. Age was categorized into 2 categories: <65 years and ⩾65 years. Regions included North, Central, Northeast, and South. The health insurance scheme encompassed universal health coverage (UHC), civil servant medical benefits (CSMB), social security (SS), and others. The clinic’s location was classified as a regional hospital, provincial hospital, and community hospital. T2D, dyslipidemia (DLP), renal insufficiency, and a history of atrial fibrillation were defined based on medical records. Moreover, tobacco use was determined based on the smoking status recorded in the medical records as never smoked and ever smoked. Furthermore, height and weight data were collected and utilized to calculate the body mass index (BMI) and categorized as <25 kg/m2 and ⩾25 kg/m2. Duration of HTN was designated as <10 years, 10–19 years, and 20 years and over. Antihypertensive medication included angiotensin-converting enzyme inhibitors/angiotensin receptor blockers (ACEIs/ARBs), beta-blockers use, calcium channel blockers (CCBs) use, and diuretics use.
Statistical Analysis
Descriptive statistics were employed to determine the characteristics of the study participants. Categorical variables were presented as percentages, whereas continuous variables were reported as mean, standard deviation (SD), median, and interquartile range (Q1-Q3).
According to the Thailand DM/HT study data, which included a short follow-up of a closed cohort (1-year follow-up) with a binary outcome, we used log-binomial regression to estimate adjusted risk ratios (aRRs) and 95% confidence intervals (CIs) for the incidence of IHD and IS associated with higher MAP variability. Adjusted risk difference (RD) and 95% CI were estimated using logistic regression analysis with margins command (adjrr). The multivariable analysis models were adjusted for potential confounders as follows: model 1: age, sex; model 2: variables in model 1 plus regions, hospital level, health insurance scheme, T2D, DLP, renal insufficiency, history of atrial fibrillation, HTN duration, ACEIs/ARBs use, beta-blockers use, CCBs use, diuretics use, smoking status, BMI; and model 3: variables in model 2 plus the mean of MAP visits 1 to 3. Furthermore, a trend analysis in each model was conducted to evaluate the dose-response relationship between MAP variability and the outcomes, presenting it as p for trend. SDMAP spline curves for the average adjusted prediction of IHD and IS incidence were created using the margins command after the multivariable log-binomial regression model 3.
Subgroup analyses of key variables (sex, age, T2D, dyslipidemia, renal insufficiency, BMI, and smoking status) were performed to compare the incidence of IHD and IS between the highest (SD Q4) and the other 3 quartiles (SD Q1 + Q2 + Q3) of MAP variability. An interaction term between key variable and MAP variability was individually added to the adjusted log-binomial regression model 3, and the aRRs and CIs for these associations were estimated.
Sensitivity analyses were performed using the CV as an alternative method to evaluate MAP variability and its association with the risk of IHD and IS. In addition to dividing SDMAP and CVMAP into quartiles, we categorized the exposures into tertiles to evaluate the association between MAP variability and the risk of IHD and IS. To address the issue of missing BP records, we employed marginal structural models (MSMs) to analyze the association between MAP variability and the risk of IHD and IS. The methods for MSMs are detailed in the
Ethics Consideration
The study was reviewed and approved by the Institutional Review Board, the Royal Thai Army Medical Department, in compliance with international guidelines such as the Declaration of Helsinki, the Belmont Report, CIOMS Guidelines, and ICH-GCP (approval number S055h/65_Exp). A waiver of documentation of informed consent was obtained for the use of secondary data and was granted by the Institutional Review Board, the Royal Thai Army Medical Department.
Results
Characteristics of Study Participants
Table 1 lists the baseline characteristics of the study participants. Around two-thirds of the participants were women. The mean age of the participants was 63.9 ± 11.7 years and 64.1 ± 11.8 years in IHD and stroke outcome cohorts, respectively. The mean values of the average SBP, DBP, and MAP across 3 visits were 133.8 ± 11.5, 76.4 ± 8.4, and 95.5 ± 8.0 mmHg, respectively.
Baseline characteristics of study participants.

Abbreviations: ACEIs, angiotensin-converting enzyme inhibitors; ARBs, angiotensin receptor blockers; BP, blood pressure; MAP, mean arterial pressure; SD, standard deviation; CV, coefficient of variation
Association Between MAP Variability and the Risk of IHD Among Patients With HTN
Table 2 presents the association between MAP variability and the risk of IHD. Among the 92 854 patients with HTN without a history of IHD, 594 new-onset IHD events were observed (0.64%). After adjusting for potential confounders, the higher quartiles of SD Q3 and Q4 were associated with a 35% and 50% increased risk of incident IHD, respectively, compared to the lowest quartile of SD (Q1; aRR: 1.35 and 95% CI: 1.06-1.72; aRR: 1.50 and 95% CI: 1.18-1.90) Also, a dose-response relationship was noted between MAP variability measured by SD and incident IHD, with P for trend <.001. Figure 2A reveals that the average adjusted prediction of IHD increased with MAP variability measured by SD when it reached a higher level. Figure 3A and Supplemental Table 1 demonstrate the association between MAP variability and the risk of IHD on an additive scale. Subgroup analyses of key variables showed that the risk of IHD in the highest quartile of SD (Q4) was greater than that in the lower quartiles of SD (Q1 + Q2 + Q3; Table 3).
Association of visit-to-visit MAP variability measured by SD with the risk of ischemic heart disease and ischemic stroke.

Multivariable analysis; Model 1: adjusted for age and sex; Model 2: adjusted for Model 1 + regions, hospital level, health scheme, diabetes, dyslipidemia, renal insufficiency, history of atrial fibrillation, hypertension duration, ACEIs/ARBs use, beta-blockers use, calcium channel blockers use, diuretics use, smoking status, body mass index; Model 3: adjusted for Model 2+ mean of MAP visit 1 to 3.
Abbreviations: SD, standard deviation; MAP, mean arterial pressure; RR, risk ratio; CI, confidence interval
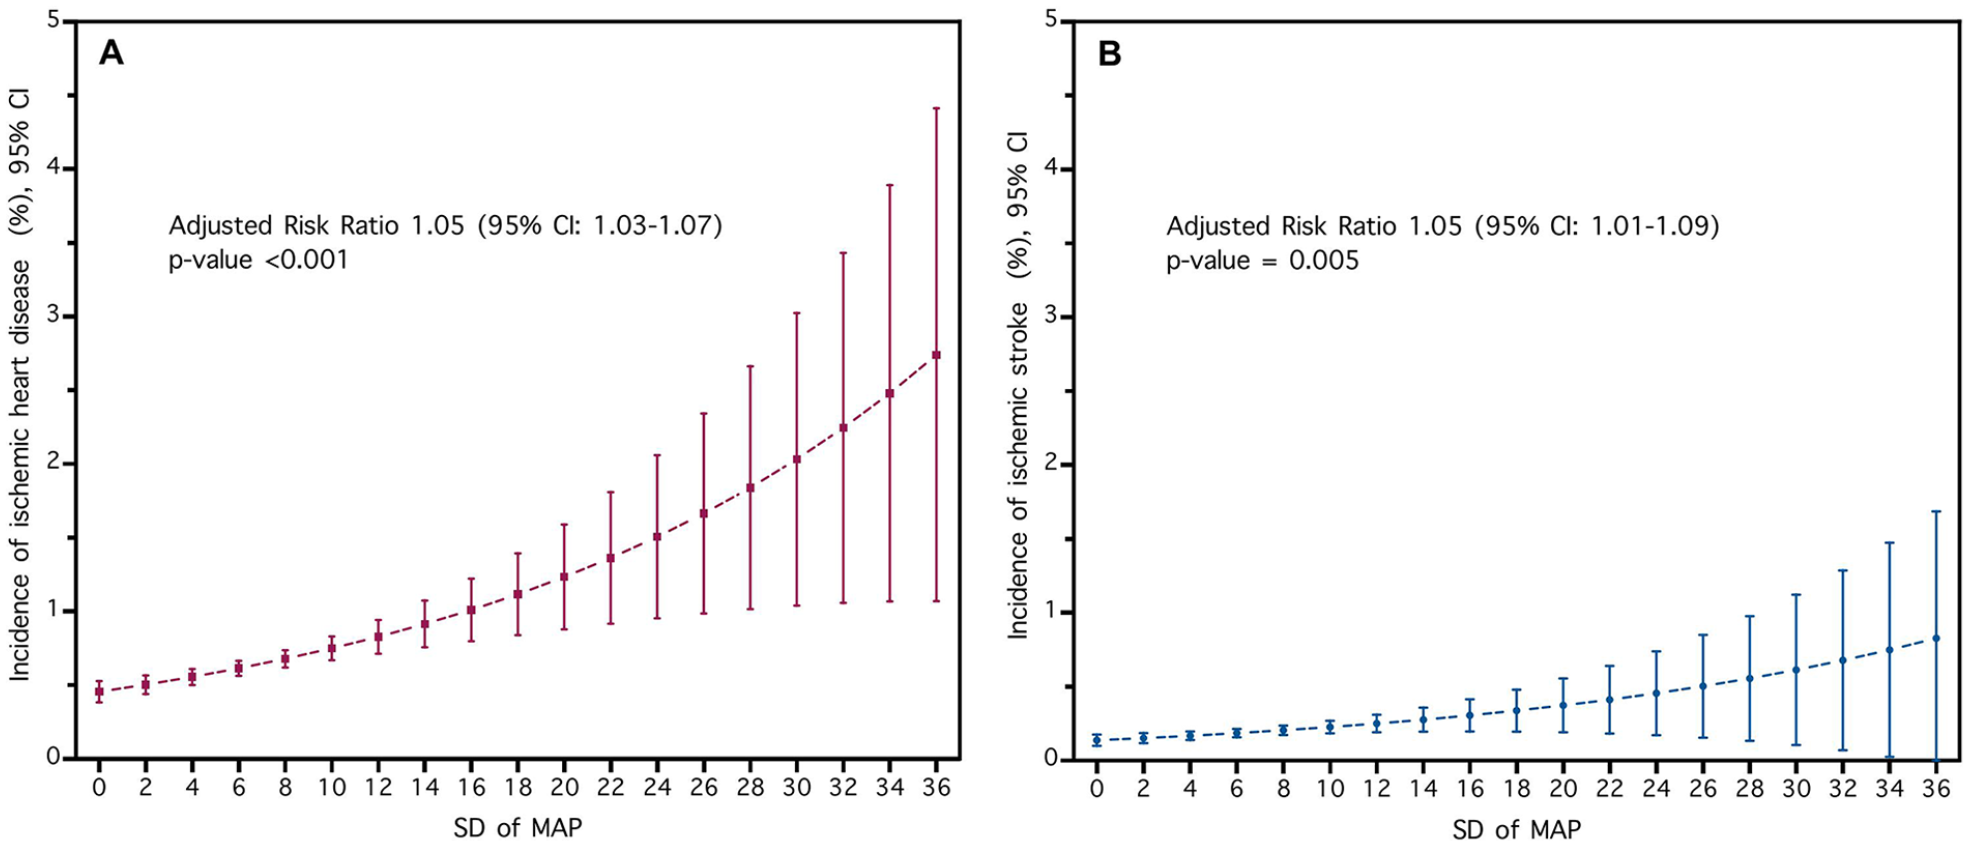
Spline curve of SDMAP for the average adjusted prediction of (A) ischemic heart disease incidence and (B) ischemic stroke incidence and 95% CI: (A) Average adjusted prediction of ischemic heart disease incidence among hypertensive patients, adjusting for age and sex, regions, hospital level, health scheme, diabetes, dyslipidemia, renal insufficiency, history of atrial fibrillation, hypertension duration, ACEIs/ARBs use, beta-blockers use, calcium channel blockers use, diuretics use, smoking status, body mass index, and mean of MAP visit 1 to 3, (B) Average adjusted prediction of ischemic stroke incidence among hypertensive patients, adjusting for age and sex, regions, hospital level, health scheme, diabetes, dyslipidemia, renal insufficiency, history of atrial fibrillation, hypertension duration, ACEIs/ARBs use, beta-blockers use, calcium channel blockers use, diuretics use, smoking status, body mass index, and mean of MAP visit 1 to 3. SD: standard deviation, MAP: mean arterial pressure, CI: confidence interval, aRR: Adjusted risk ratio for 1 unit of SD increase.
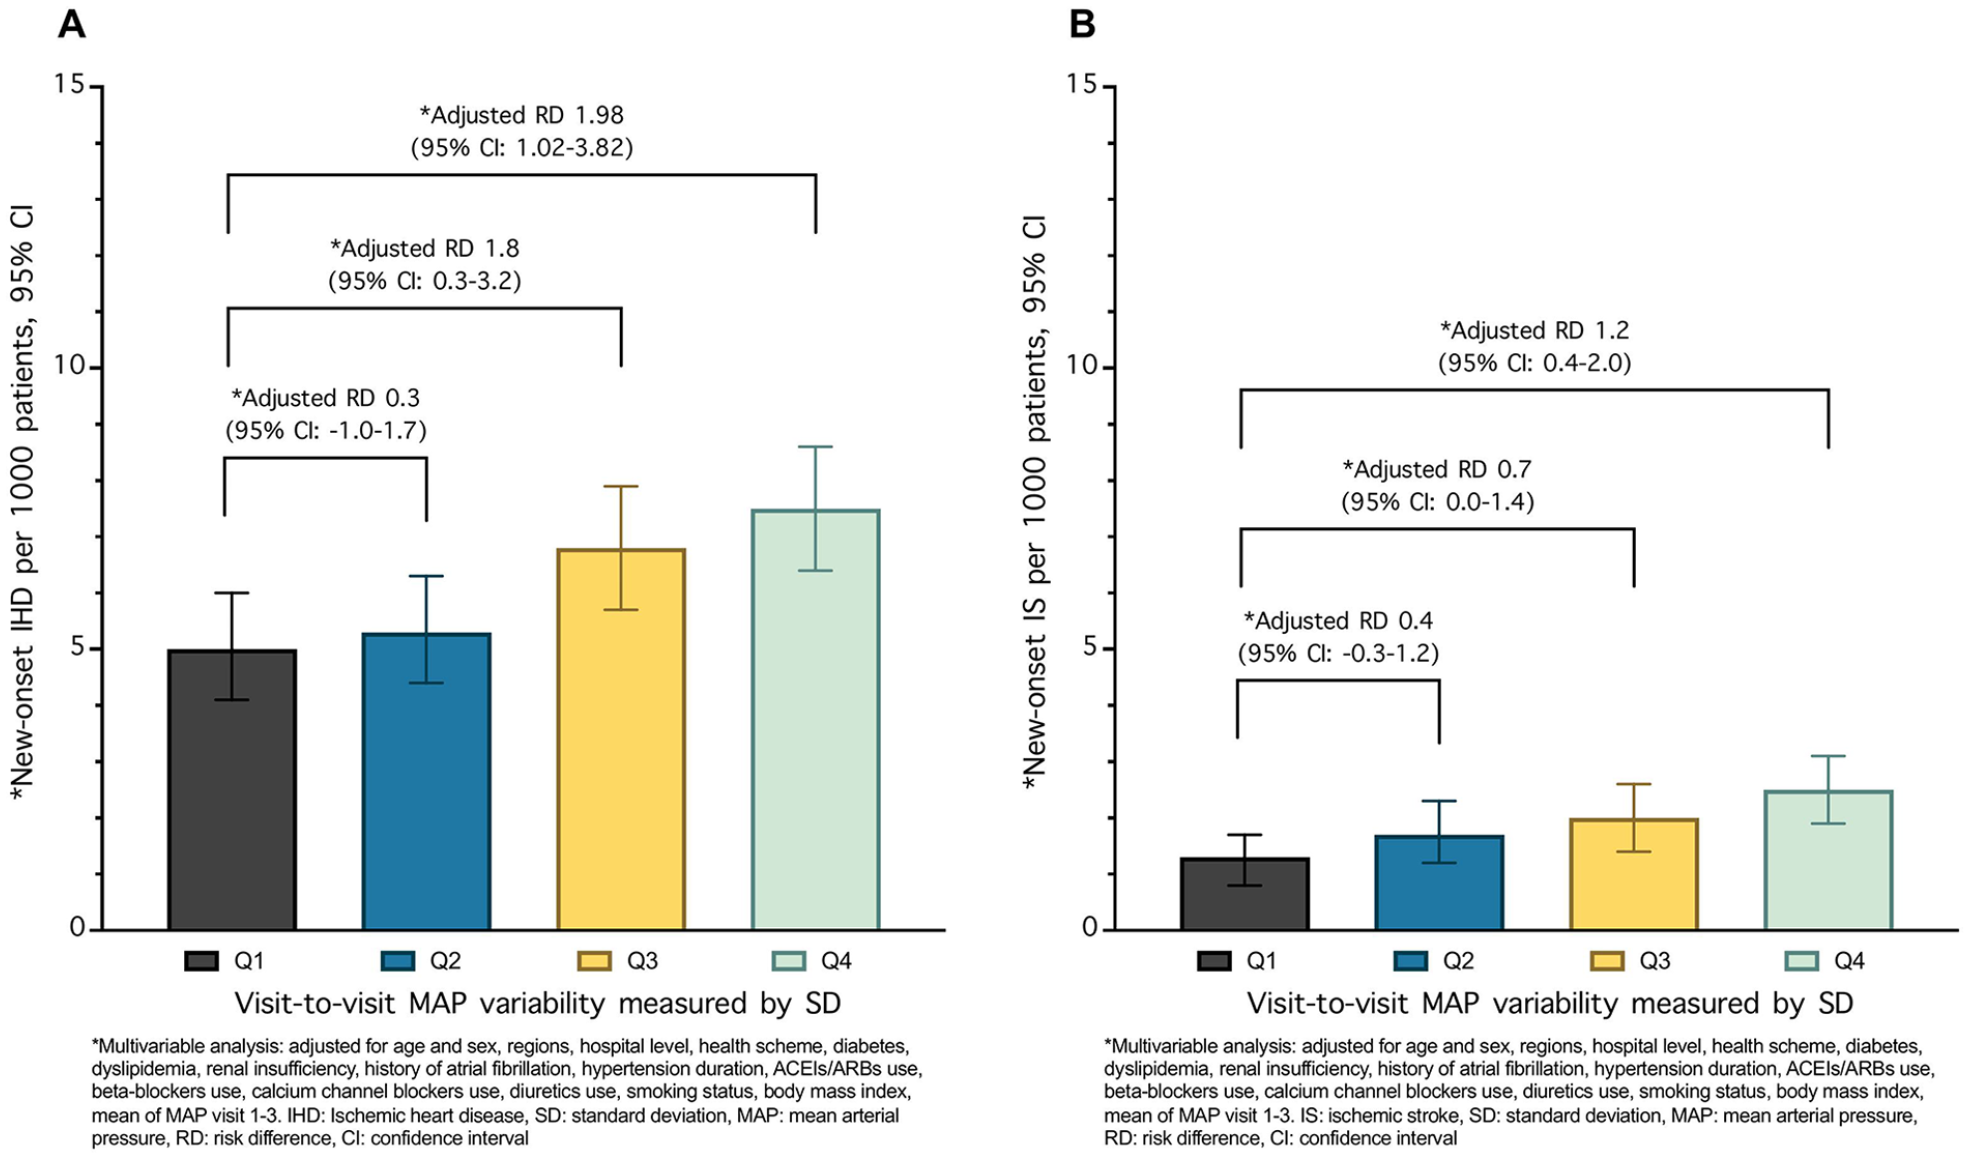
Association between MAP variability measured by standard deviation and (A) ischemic heart disease incidence and (B) ischemic stroke incidence on an additive scale.
Association of the highest quartile of MAP variability group (SD Q4) compared with the lower MAP variability group (SD Q1 + Q2 + Q3) for ischemic heart disease in subgroups.

Adjusted for age and sex, regions, hospital level, health scheme, diabetes, dyslipidemia, renal insufficiency, history of atrial fibrillation, hypertension duration, ACEIs/ARBs use, beta-blockers use, calcium channel blockers use, diuretics use, smoking status, body mass index, and mean of MAP visit 1 to 3.
Abbreviations: SD, standard deviation; MAP, mean arterial pressure; RR, risk ratio; CI, confidence interval
Association Between MAP Variability and the Risk of IS Among Patients With HTN
Out of the 95 486 patients with HTN without a history of IS, 187 incidents of new-onset IS were observed (0.20%). After controlling for potential confounding factors, the results demonstrated that patients in the higher quartile of MAP variability (SD Q4) had a considerably higher risk of developing incident IS than those in the lowest quartile of SD (Q1), with aRR of 1.97 (95% CI: 1.26-3.07; Table 2). A dose-response relationship between MAP variability measured by SD and incident IS was observed (P for trend = .002). Figure 2B illustrates that the average adjusted prediction of IS increased with MAP variability measured by SD when it reached a higher level. Figure 3B and Supplemental Table 1 reveal the association between MAP variability and the risk of IS on an additive scale. Subgroup analyses of key variables presented differential risks of IS in subgroups of sex, age, T2D, DLP, renal insufficiency, BMI, and smoking status. However, the interaction testing revealed no heterogeneity (Table 4).
Association of the highest quartile of MAP variability group (SD Q4) compared with the lower MAP variability group (SD Q1 + Q2 + Q3) for ischemic stroke in subgroups.

Adjusted for age and sex, regions, hospital level, health scheme, diabetes, dyslipidemia, renal insufficiency, history of atrial fibrillation, hypertension duration, ACEIs/ARBs use, beta-blockers use, calcium channel blockers use, diuretics use, smoking status, body mass index, and mean of MAP visit 1 to 3.
Abbreviations: SD, standard deviation; MAP, mean arterial pressure; RR, risk ratio; CI, confidence interval
Sensitivity Analyses
The sensitivity analyses assessed the association between MAP variability, measured by the CV, and the risk of IHD and IS. As detailed in Supplemental Table 2, these findings consistently supported the primary analysis results, revealing a substantial association between the highest quartile of MAP variability (CV Q4) and an increased risk of IHD and IS. In an alternative approach that categorized MAP variability into tertiles, we observed associations between MAP variability—both measured by SD and CV—and the risk of IHD and IS, as presented in Supplemental Tables 3 and 4. Furthermore, MSMs were employed to account for patients with HTN who did not have 3 BP readings documented in their medical records. The results were consistent with the primary analysis, demonstrating that higher MAP variability is associated with an increased risk of IHD and IS, as shown in Supplemental Table 5.
Discussion
In the present study, a positive association was observed between visit-to-visit MAP variability and the risk of both IHD and IS among patients with HTN receiving continuous care in Thailand. This relationship remained significant even after adjusting for potential confounding factors, including mean MAP, and was robust across a range of sensitivity analyses. Our findings suggest that visit-to-visit MAP variability may represent a potentially important risk factor for IHD and IS in patients with HTN. Furthermore, they may offer a more accurate estimate of risk than the mean MAP alone.
To the best of our knowledge, this study represents the first comprehensive investigation to date into the relationship between visit-to-visit MAP variability and IHD and IS. Our findings reveal that individuals in the highest quartile of SDMAP have a 50% increased risk of developing IHD—equating to an additional 3 cases per 1000 individuals—and a 97% increased risk of experiencing IS, which corresponds to an additional case per 1000 individuals, compared to those in the lowest quartile of SDMAP.
MAP is a fundamental driving force for the perfusion of vital organs and is also associated with end-organ damage, such as ischemia and infarction, which can occur if MAP drops for an extended period. 26 Prior studies reported that MAP and overall CVD events are positively associated, including IHD, stroke, and CVD mortality.15,16 However, few studies evaluated the potential impact of MAP variability on CVD outcomes. Recent findings from the ARIC study stated that long-term MAP variability and HF and all-cause mortality are related. 17 Our study demonstrates the association of visit-to-visit MAP variability with IHD and IS in a large population with HTN in Thailand. This finding aligns with the evidence that MAP variability may be a potential risk factor for IHD and IS. Therefore, minimizing MAP variability to achieve optimal BP management may be beneficial.
Previous studies demonstrated that SBP trajectories over time are superior predictors of stroke, coronary heart disease, and cardiovascular mortality compared to a single SBP assessment.10,11,27 For instance, a large-scale study conducted on 3 285 684 US veterans revealed that elevated SBP variability in individuals with and without HTN was linked to higher risks of IHD, stroke, and all-cause mortality. 11 The current study builds upon these earlier findings. It demonstrates that 1-year visit-to-visit MAP variability, similar to SBP variability, is associated with the risks of IHD and IS. The findings support and emphasize the importance of BP variability for health-related outcomes, particularly concerning MAP.
Regarding the subgroup analysis of key variables, our findings demonstrated that the highest quartile of MAP variability was associated with a higher risk for IHD and IS. Moreover, the effect of measure modification of DLP on the association between MAP variability and IHD on a multiplicative scale was observed. Our analysis indicated a weaker association between MAP variability and IHD among those with DLP. This finding may be explained by DLP being a significant risk factor for IHD. 28 Individuals with DLP are more likely to have a higher risk for IHD than those without DLP; therefore, it dilutes the effect of higher MAP variability on the risk of IHD.
Consistent with prior research, elevated BP variability was linked to an enhanced likelihood of cardiovascular complications. This phenomenon may be elucidated by a number of proposed mechanisms, including alterations in the elastic characteristics of blood vessels and aortic distensibility, 29 as well as lifestyle factors such as noncompliance with antihypertensive medications 30 and exposure to emotional stimuli and psychological stressors.31,32 Moreover, a prior investigation on patients with T2D revealed that BP variability exhibited a positive relationship with pulse wave velocity and a reverse association with ankle-brachial index, thereby revealing a potential association between BP variability and vascular dysfunction.33,34 Notably, increased BP variability exerts stress on blood vessels, leading to endothelial dysfunction, a possible risk factor for the atherosclerotic process and a plausible contributor to developing IHD and IS.35,36 Furthermore, the MAP variability can result in a direct decrease in myocardial perfusion and impact blood perfusion in cerebral tissues. 26 As MAP acts as a primary driving force for vital organ perfusion, repeated transient reductions in MAP over time could potentially raise the risk of relative hypoperfusion in both cardiac and cerebral tissues.26,37
Another possible mechanism that could explain our findings is the role of autonomic dysfunction related to CVD. Autonomic dysfunction pertains to issues within the autonomic nervous system, including both the sympathetic and parasympathetic branches. This dysfunction may manifest as increased BP variability. 38 Consequently, BP variability could serve as a proxy indicator, allowing for noninvasive measurements to monitor changes in autonomic function. 39
Our findings display that MAP variability, including SD and CV, can be applied in clinical practice to reduce CVD risk among patients with HTN. Healthcare providers may incorporate MAP variability into HTN treatment by adjusting antihypertensive medications based on MAP variability as a target. This approach focuses on reducing variability and lowering mean BP to achieve the optimal target BP. 40 Additionally, BP variability may help identify individuals at high risk for CVD among patients with HTN. In our subgroup analysis, we found a stronger relationship between MAP variability and IHD and IS in individuals aged 65 and older (aRR:1.50 for IHD; aRR: 1.86 for IS) compared to those under 65 (aRR of 1.09 for IHD and 1.11 for IS). Therefore, older patients with HTN with higher BP variability should be closely monitored for CVD complications, including IHD and IS. Therefore, we suggest conducting further detailed studies that clarify the role of MAP variability and the underlying mechanisms involved in developing IHD and IS to better our understanding of optimal BP management and provide better guidance for clinical practice.
Several strengths characterized our study. First, we were able to analyze a large sample size of almost 100 thousand individuals, providing a robust dataset for our analyses. Additionally, the study population was highly representative of Thai patients with HTN receiving continuous care nationwide, thereby enhancing the generalizability of our findings. Furthermore, this study, while focused on Thai individuals, may yield findings relevant to other populations regarding HTN management, mainly through the lens of BP variability rather than BP levels.
However, our study also had several limitations. One major limitation was the relatively short duration of visit-to-visit MAP measurements, which were taken over just 1 year. Therefore, the findings indicated a cross-sectional association. Moreover, due to the potential confounding factors inherent in an observational study, causality between MAP variability, IHD, and IS cannot be established. Typically, BP measurements at outpatient clinics follow the Thai guidelines for treating HTN, which suggest the standard procedure for BP measurement. Nonetheless, the data used in this study was collected from the Thailand DM/HT study, which may have introduced measurement errors in BP readings taken by hospital staff nationwide. Therefore, misclassification of the exposure may occur and may bias the results. Despite our efforts to account for potential confounding factors using multivariable analyses, residual confounding remains, particularly concerning dietary behavior, physical activity, and adherence to antihypertensive medication, which were not available in the Thailand DM/HT study data. This may introduce bias into our findings. This study included Thai patients with HTN receiving continuous care nationwide; therefore, the generalizability may be limited to this population. However, subgroup analyses of key variables and several sensitivity analyses yielded consistent results, thereby bolstering the robustness of our findings.
Conclusion
Our study involving Thai patients with HTN receiving continuous care revealed that higher visit-to-visit MAP variability was strongly associated with an increased risk of IHD and IS. This finding suggests that MAP variability could be a potential risk factor for both IHD and IS. In addition to monitoring BP levels, it is crucial to account for BP variability in managing HTN. This approach can guide medication adjustments to achieve optimal BP targets and help identify patients at high cardiovascular risk.
Supplemental Material
sj-docx-1-cic-10.1177_11795468251342338 – Supplemental material for Association Between Visit-to-Visit Mean Arterial Pressure Variability and the Risk of Ischemic Heart Disease and Ischemic Stroke Among Patients With Hypertension in Thailand
Supplemental material, sj-docx-1-cic-10.1177_11795468251342338 for Association Between Visit-to-Visit Mean Arterial Pressure Variability and the Risk of Ischemic Heart Disease and Ischemic Stroke Among Patients With Hypertension in Thailand by Boonsub Sakboonyarat, Jaturon Poovieng and Ram Rangsin in Clinical Medicine Insights: Cardiology
Footnotes
Acknowledgements
The authors thank the National Health Security Office in Thailand for supporting the Thailand DM/HT study dataset.
Abbreviations
HTN: Hypertension
CVD: Cardiovascular disease
IHD: Ischemic heart disease
IS: Ischemic stroke
BP: Blood pressure
SBP: Systolic blood pressure
DBP: Diastolic blood pressure
MAP: Mean arterial pressure
SD: Standard deviation
CV: Coefficient of variation
T2D: Type 2 diabetes
DLP: Dyslipidemia
Ethical Considerations
This study was reviewed and approved by the Institutional Review Board, Royal Thai Army Medical Department, following international guidelines including the Declaration of Helsinki, the Belmont Report, CIOMS Guidelines, and the International Conference on Harmonization of Technical Requirements for Registration of Pharmaceuticals for Human Use–Good Clinical Practice (ICH–GCP) (approval number S055h/65_Exp).
Consent to Participate
Due to the use of secondary data, a waiver of documentation of informed consent was utilized. The Institutional Review Board, Royal Thai Army Medical Department, approved an informed consent waiver.
Consent for Publication
Consent for publication is not applicable.
Author Contributions
BS conducted the study concept, analyzed and interpreted the data, and was a major contributor to writing the manuscript. JP conducted the study concept and interpretation of the data. RR performed the study concept/design, data collection, and interpretation of the data. All authors read and approved the final manuscript.
Funding
The author(s) disclosed receipt of the following financial support for the research, authorship, and/or publication of this article: This study was funded by the Phramongkutklao College of Medicine, Bangkok, Thailand.
Declaration of Conflicting Interests
The author(s) declared no potential conflicts of interest with respect to the research, authorship, and/or publication of this article.
Data Availability Statement
Data cannot be shared publicly because the data set contains identifying information; additionally, the data belong to the Thailand DM/HT study of the Medical Research Network of the Consortium of Thai Medical Schools (MedResNet). Thus, ethical restrictions exist on the data set. Data are available from the Thai National Health Security Office (NHSO), Bangkok, Thailand (contact via ![]() ) for researchers who meet the criteria for access to confidential data.
) for researchers who meet the criteria for access to confidential data.
Supplemental Material
Supplemental material for this article is available online.
References
Supplementary Material
Please find the following supplemental material available below.
For Open Access articles published under a Creative Commons License, all supplemental material carries the same license as the article it is associated with.
For non-Open Access articles published, all supplemental material carries a non-exclusive license, and permission requests for re-use of supplemental material or any part of supplemental material shall be sent directly to the copyright owner as specified in the copyright notice associated with the article.