
Abstract
Background:
The alarming increase in the prevalence of obesity and arthritis in America in recent times is concerning both in terms of the deleterious health effects on the individuals and economic cost. The wear and tear on the musculoskeletal and the inflammatory effects of obesity may be the reasons for the rise in arthritis among individuals with obesity.
Objective:
To investigate the association between obesity and the development of arthritis among adults in the United States.
Design:
A total of 17 016 participants were included from the 2012 to 2018 National Health and Nutrition Examination Survey (NHANES). Most of the participants were aged 30 years and above (79.7%). The racial distribution included 64.0% Non-Hispanic whites, 15.3% Hispanics, 11.4% Non-Hispanics blacks, and 9.4% from all other races.
Methods:
Obesity was defined as a body mass index (BMI)
Result:
Nearly 40% of all participants were individuals with obesity, and 27.5% reported having some form of arthritis. The risk of developing arthritis was higher in individuals with obesity (OR: 1.55, 95% CI: 1.35-1.80), women (OR: 1.94, 95%CI: 1.66-2.28), and individuals 30 years or older (OR: 10.81, 95% CI: 6.36-18.37) with non-Hispanic whites being the most affected race. The C-reactive protein (CRP) and white blood cell count (WBC) levels were higher in all individuals with obesity even though there was no statistical difference between individuals with obesity with and without arthritis.
Conclusions:
Obesity substantially heightens the risk of developing arthritis due to the mechanical stress on weight-bearing joints and subsequent chronic-low level inflammation contributing to disease progression.
Plain Language Summary
What is already known about this subject?
Studies show overweight and individuals with obesity are more likely to develop any of the different types of arthritis. Obesity and arthritis are both caused by a combination of risk factors, including genetics and environmental factors.
What does this study add?
Explored relationship between obesity and arthritis has been focused mainly on a single type of arthritis, often in adults over 40 years old, and ignoring important covariates. This study does more; by looking at the relationship between obesity and several types of arthritis together in individuals 30 years and above taking into consideration most of the potential confounders.
The study also explores further whether it is the inflammatory or the effects of increased wear-and-tear with obesity that drive the increase in arthritis prevalence in the United States.
How might this impact on clinical practice?
Study findings highlight the importance of lifestyle modification such as dieting and exercising aimed at weight management in individuals with obesity who are at particular risk for many diseases and health conditions such as the development of arthritis.
Introduction
Globally, the prevalence of obesity has been rising rapidly, tripling between 1975 and 2016. 1 The World Health Organization (WHO) estimated in 2016 alone, that 39% of adults aged 18 years and over were overweight (BMI > 25 kg/m2), 650 million of whom (representing about 13% of the world’s population) were considered as individuals with obesity. 1 In the United States alone, according to the Centers for Disease Control and Prevention (CDC), the prevalence in 2015 to 2016 was 39% of the total adult population and 18.5% adolescents with many of the affected adults being between the ages of 40 to 59. 2
Energy imbalance between calories consumed and calories expended is the fundamental cause of obesity which is defined as an individual with a Body Mass Index (BMI) of 30 kg/m2 or higher. 3 Overnutrition, high intake of fat and sugars, low physical activity, and a sedentary lifestyle are important contributors to this global pandemic of obesity.
The risk for many chronic noncommunicable diseases increases with rising BMI, and obesity is a risk factor for several diseases among the top ten leading causes of death in the United States, including heart disease, cancer, cerebrovascular disease (mainly stroke), and diabetes. 4
Obesity is also a known risk factor for many musculoskeletal disorders that affect one in every two American adults. 5 Arthritis is the most common type of this disorder that affects the locomotor system, including the muscles, bones, joints, and associated tissues (tendons and ligaments). It may be caused by an injury, infection, abnormal metabolism, dysfunctional immune systems, and other environmental and genetic factors.6,7
Arthritis causes disabling degeneration of the joints due to inflammation, often leading to pain. It is a common cause of disability among adults residing in the United States,8,9 limiting everyday activities for about 24 million Americans.1,9 As the global population ages and the prevalence of the risk factors for noncommunicable diseases increases, the prevalence and impact of musculoskeletal conditions such as arthritis are predicted to rise as well. 10 It affects all ages, sexes, and races, 11 but it is especially high in adults aged 45 to 64 at 30.7%. 12
Generally, it is hard to estimate how many people live with arthritis because many people do not seek treatment until their symptoms become severe. However, Crowson’s 2013 study, estimated that 15% of Americans (1 in every 5) were affected by some form of arthritis. 12 This number that has since changed to more than one in four adults with rural America most affected (1 in 3 adults).13,14
Studies show overweight and individuals with obesity are more likely to develop any of the different types of arthritis.8,15 In a large American retrospective case-control study, for instance, Daïen and Sellam 15 noted that obesity was associated with an increased risk of developing RA adjusting for smoking status. Two other cohort studies also found that obesity was associated with incident seronegative inflammatory polyarthritis as well as with psoriatic arthritis and spondylarthritis. 2 Several studies, including those conducted utilizing data from the first NHANES data set, reveal a significant association between obesity and osteoarthritis across diverse demographic segments.7,16-19
Most of the studies that explored the relationship between obesity and arthritis focused on a single type of arthritis in adults over 40 years old, often ignoring vital covariates such as dieting, alcohol consumption, smoking, moderate exercise, and others.12,15,20-26. This study aims to investigate the relationship between obesity in Americans aged 30 years and above and the various forms of arthritis (including rheumatoid arthritis [RA], ankylosing spondylitis [AS], osteoarthritis [OA], and psoriatic arthritis [PSA]) using more diverse and representative data controlling for important covariates.
Also, the role of obesity in the causal pathway of arthritis remains unclear. Injuries from the weight-bearing pressure exerted on the joints and the wear-and-tear of cartilages of various joints of individuals with obesity or obesity-induced inflammation could explain why more individuals with obesity seem to have arthritis. The study also aims to explore further whether it is the inflammatory or the effects of increased wear-and-tear with obesity that drive the increase in arthritis prevalence in the United States.
Methodology
Study population and sample selection
This is a cross-sectional study that utilized data from the 2012 to 2018 National Health and Nutrition Examination Survey (NHANES) program designed by the National Center for Health Statistics (NCHS) to assess the health and nutritional status of the US population. 27 The NHANES series of population studies in the US combine assessment of risks and lifestyle factors, physical examination, and laboratory tests conducted at specific medical locations.
The NHANES program, which initially focused on different population groups and health concerns when it began in 1960, became a more continuous survey, adapting over time to a variety of health and nutrition measurements to meet emerging needs. The survey examines a nationally representative sample of about 5000 civilian noninstitutionalized persons each year, releasing new comprehensive reports and data every 2 years. 27
The survey data provides information on vital health statistics across the US annually consisting of socioeconomic, demographic, dietary, and health-related questions including the prevalence of chronic diseases. 27 The assessment variables include medical, dental, physical, and physiological measurements administered by specially trained staff. 27
The information for each 2-year period from 2012 to 2018 was merged to produce a single data set with 29 400 responders. A total of 17 016 individuals responded to the NHANES question “Has a doctor or other health professional ever told {you/SP} that {you/s/he} . . . had arthritis (ar-thry-tis)?.” All non-responders and those who responded “no” were excluded. A total sample size of 3233 out of 4673 that indicated “yes” and provided completed responses about status and the type of arthritis were included from this study (Supplemental figure 1).
Exposure of interest
The exposure of interest in this study was obesity. Using the NHANES body measurements of respondents, obesity was defined based on the individual Body Mass Index (BMI) calculated as the weight in kilograms (kg) divided by the square of height in meter (m2). The results were categorized based on the CDC’s guidelines where a BMI of 18.5 to <25 kg/m2 was designated as normal, 25.0 to <30 kg/m2 as overweight, and 30.0 kg/m2 or higher as obese range. 1
Outcome of interest
The outcome variable of interest was the respondent’s arthritis status. This was self-reported based on the answer to the question “has a doctor or other health professional ever told you that you had arthritis.” 27 All individuals who responded with “yes” were considered to be affected and those who reported “no,” to be unaffected.
Covariates
Both obesity and arthritis are caused by a combination of risk factors, including genetics and environmental factors. This study focused mainly on the environmental factors that could potentially influence any potential relationship between these two conditions. Based on this fact and prior studies, sociodemographic characteristics (age, gender, race), physical activity, smoking status, income level, education level, alcohol consumption, and diet quality of an individual were included as covariates.6,28-34
Age was categorized into two groups; individuals
Individuals were classified as “current smokers” if they responded to currently smoking on some or every day regardless of pack smoked and “non-smoker” if they did not smoke at all. For alcohol (any type of alcoholic beverage) consumption, “often drinkers” were those who indicated drinking > 14 drinks/week versus “normal drinker” if they consumed
Laboratory measurements
Both obesity and some forms of arthritis are known factors associated with elevated inflammatory markers.35,36 As a measure of the presence of body inflammation, available NHANES data on both C-reactive protein (CRP) and white blood cell count (WBC) (1000 cells/µL) of responders were analyzed. Individuals with unusually high WBC count (>16.0 × 10³ µL) were excluded to limit the possibility of including responders with inflammation caused by some other serious underlying factors such as cancer. A WBC count range of (3.9-11.8) × 103 µL for men and (4.1-12.9) × 103 µL for women and a CRP of <7.8 mg/dL were set as the normal ranges based on the action limits set by NHANES to guide physicians on normal laboratory results. 21 All individuals with values below or above the set range were classified as either low or high, respectively.
Power analysis
For power calculation, the effect size was extrapolated from two independent studies, each utilizing data from the first NHANES data set (1971-1975), which provided crucial relative risk and odds ratio estimates, and revealing a significant association between obesity and osteoarthritis across diverse demographic segments.7,16 Insights from other studies, including the Framingham Study and a comprehensive pooled analysis, corroborated and strengthened this association.17-19
Following the guidelines by Cohen, the G*Power statistical tool was used to determine the necessary total population sizes at both small and large effect sizes. The estimate resulted in population size requirements of 87 and 822, respectively.37,38 Consequently, ensuring a sample size surpassing 822 guarantees a power of approximately 0.8 for effectively testing hypotheses involving 10 variables, with a nominal alpha level set at 0.05.
Statistical analysis
A description and comparison of the baseline characteristics of study participants from different risk groups were conducted using a chi-square test, as all variables were categorized, with a significance level set at P < .05. The means of two groups were compared using a t-test. A weighted logistic regression analysis using survey command was employed to assess the relationship between the outcome of interest and all potential covariates calculating odds ratios (OR) and 95% confidence intervals (CI). All statistical analyses were performed using STATA software version 16.0. 39
Patient and public involvement subsection
Patients and the public were not (or will not) be involved in this protocol articles.
In accordance with the STROBE (Strenthening the Reporting of Observational Studies in Epidemiology) guidelines, the methodology for the study was carefully designed and executed to ensure comprehensive and transparent reporting of observational research methods.
Results
Study participants were mostly older than 30 years of age (79.7%). There were more women (51.8%) than men, more non-Hispanic whites (64.0%) than Hispanics (15.3%), Non-Hispanic Blacks (11.4%), and other races including Multi-race (9.4%) (Table 1). About 85% of responders reported living in a family above the poverty level and approximately 69% lacked college education (Table 1). The prevalence of obesity and arthritis among study participants was 40.0% (Table 1) and 27.5% (supplemental Figure 1), respectively. Among those with obesity, 35.2% had arthritis, compared with 22.2% in individuals without obesity (P < .001) (Table 1).
Frequency distribution of the sociodemographic, obesity, and arthritis status from the Nation Health and Nutrition Examination Survey (NHANES) 2012-2018.

Weighted freq. (%) = Survey weighted logistic regression frequency, Unweighted freq. (%) = unweighted logistic regression frequency, n = total number of individuals, * = statistically significant (P-value < .05) difference between observed and expected frequencies within the distribution.
Individuals with obesity were 55% more likely than non-obese ones (OR: 1.55, 95% CI: 1.35-1.80; Table 2) to develop any kind of arthritis. The difference remained statistically significant after adjusting for potential confounders such as age, gender, race, diet quality, income level, physical activity, alcohol consumption, and smoking status. A comparison of arthritis status by BMI showed a statistically significant difference across all weight categories (P < .001; Figure 1). Increasing BMI increases the prevalence of arthritis, with nearly half of participants with a BMI > 40 kg/m² having some form of arthritis (Figure 1).
Univariate and multivariate analysis of the association between arthritis and obesity and possible confounders.
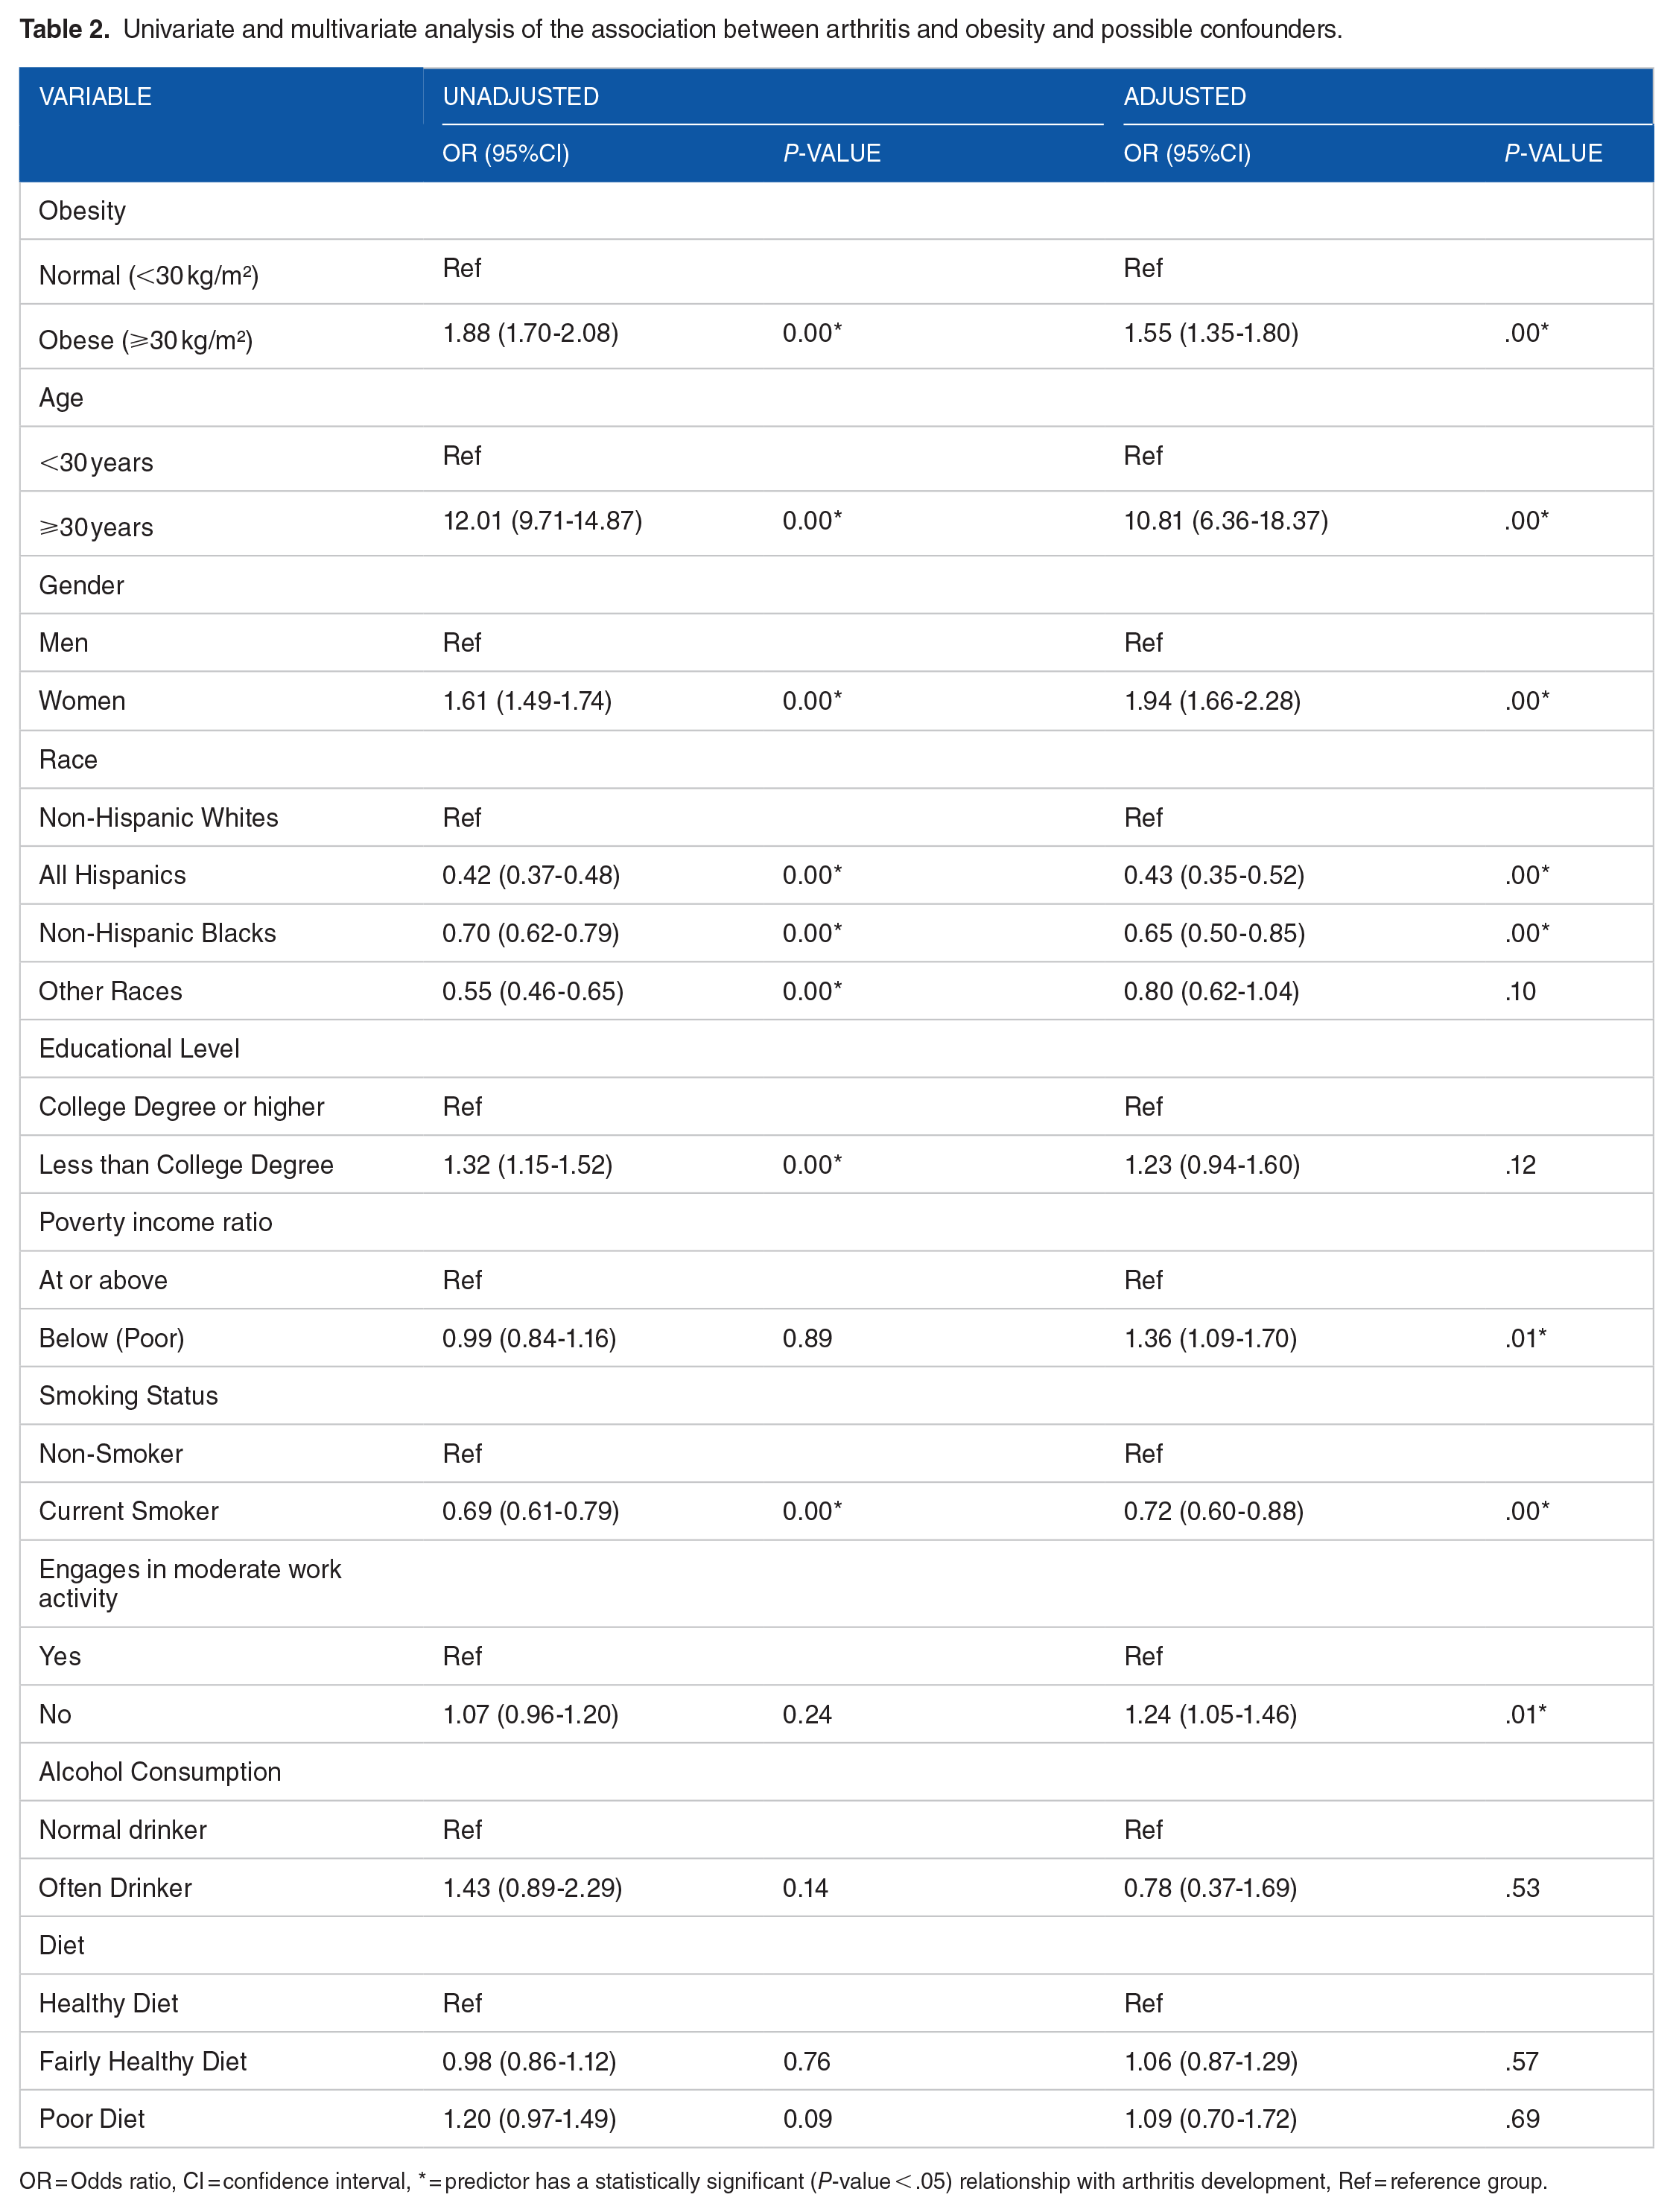
OR = Odds ratio, CI = confidence interval, * = predictor has a statistically significant (P-value < .05) relationship with arthritis development, Ref = reference group.

A diagram showing an increase in the prevalence of arthritis with increasing BMI.
Also, statistically significant were the higher odds of developing arthritis among women (OR: 1.94, 95% CI: 1.66-2.28) compared with men, individuals 30 years and older (OR: 10.81, 95% CI: 6.36-18.37) compared with those who were younger, those who reported not engaging in moderate work activity (OR: 1.24, 95% CI: 1.05-1.46) compared with those who did, and the poor (OR: 1.36, 95% CI: 1.09-1.70) (Table 2). Less likely to develop arthritis, however, were all other races compared with non-Hispanic whites, and smokers, compared with non-smokers (Table 2).
The most common form of arthritis was osteoarthritis or degenerative arthritis 1909 (59.1%), followed by rheumatoid arthritis 829 (25.6%), with psoriatic arthritis being the least reported type at 1.9% (Table 3). There was approximately similar distribution of the various types of arthritis among individuals with obesity and non-obese individuals (Table 3).
Types of arthritis by obesity (BMI

Measures of inflammation
Individuals with obesity exhibited statistically significant higher mean CRP levels (M = 6.03, SD = 10.02; P-value of .000) compared with non-obese individuals (M = 2.80, SD = 5.99; P-value of .000). Similarly, individuals with obesity also demonstrated statistically significantly higher mean WBC levels (M = 7.86, SD = 5.53; P-value of .000) compared with a relatively higher number of non-obese individuals (M = 7.03, SD = 2.56; P-value of .000) (Supplemental Table 1).
Comparing the prevalence of higher inflammatory markers between individuals with obesity with and without arthritis revealed higher prevalence in those without arthritis, CRP (62.1%) and WBC (72.7% for men and 67.0% for women) levels, compared with those with arthritis. However, this difference was not statistically significant (Supplemental Table 2).
Discussion
Many studies, most of which are cross-sectional, have examined the association of obesity and individual diseases, including the various types of arthritis (mostly RA), but to the best of our knowledge, this is the first time the relationship between obesity and several forms of arthritis (including RA, OS, DA, PA) together with potential confounders, have been explored on the basis of a large and representative population study in the United States.
The prevalence of obesity and arthritis among study participants was about 40% and 27%, respectively. These values were comparable to the CDC report of a 42.4% age-adjusted prevalence of obesity (between 2017 and 2018) 40 and a 22.7% prevalence of arthritis (between 2013 and 2015) in the US adult population.5,9,41 There were more individuals with obesity (35.2%) than non-obese individuals with arthritis, a result not too different from one reported by the CDC where 31% of all adults with obesity in the United States between 2013 and 2015 were diagnosed with arthritis by a physician. 9
Non-Hispanic whites compared with all other races are more likely to develop arthritis; a fact well studies and documented6,29-32 This study showed Hispanics, Non-Hispanic Blacks, and other Races including multi-Race were 57%, 35%, and 10% less likely to develop arthritis, respectively.
Besides race, the results of this study suggest that incident patterns of arthritis also vary by sex, age, and environmental factors such as income level, exercise habits, and smoking status of an individual.
Women were 94% more likely to develop arthritis compared with men, and when compared with those younger, the odds of development arthritis was 10 times higher for individuals 30 years and older. These results are consistent with many other studies.8,9,12,14,15,24-26,28,30,40-42 Understandably, the anatomical and hormonal differences between women and men, and the physical and physiological changes associated with aging, place both women and aged individuals at a higher risk of developing arthritis.
The study results show that individuals below the poverty-income ratio were 36% more likely to develop arthritis when other potential confounding factors were controlled for. Although some studies agreed with the findings of this study, for instance, studies conducted in North Carolina in the United States found living in a community of high household poverty rate was associated with increased risk of developing OA33,34,43; several others, including a survival analysis, however, conclude that developing arthritis rather increases the risk of falling into income poverty.44,45 Thus, poverty level and the development of arthritis show a possible simultaneity causality relationship at the very least.
Exercising is a recommended treatment option in controlling arthritis because it stretches and strengthens the structures surrounding the joints, keeps the joints well-nourished, helps to decrease bone loss, and to a certain degree, control joint swelling and pain, among other things.46-48 Unsurprisingly, the study showed individuals who did not engage in moderate work activity had 24% increased odds of developing arthritis compared to those who did. A case-control study conducted in both men and women over 55 years of age residing in Finland (n = 281), found that moderate recreational physical exercise is associated with decreased risk of knee OA. 49 A recent systematic review with a similar finding concluded that exercise therapy has moderate positive benefits for people with symptomatic OA.50,51
Although poverty and the lack of exercise seem to contribute to the development of arthritis among individuals with obesity, smoking, however, seems to be protective from the study results. Current smokers were 28% less likely to develop arthritis compared with non-smokers at a statistically significant (P < .00) level. Finckh et al, 52 for example, reported an unexpected inverse dose-response relationship between current smoking intensity and radiographic joint damage progression; thus, heavy smokers had less radiographic disease progression than moderate smokers and non-smokers. The full extent of the role of smoking in the development of arthritis is not well understood, even though it is a well-established environmental risk factor for the development of some forms of arthritis such as RA.6,22,23,52,53 Studies on the effect of smoking on the development of arthritis show conflicting results; often these results show no effect.52-55 Smoking may be considered nothing more than an important factor in initiating arthritis, and perhaps, it only plays little to no role in the progression of the disease.
Inflammatory arthritis, such as osteoarthritis, often causes damage to the joints, cartilages, and underlying bone. 42 The biochemical and mechanical processes contributing to the progressive joint failure characteristic are tightly linked to the interplay of joint damage, the immune response to perceived damage, and the subsequent state of chronic inflammation resulting in propagation and progression of the condition. 56 Obesity is known to be associated with both acute and chronic inflammation,57-59 with poorly understood mechanisms related to the enlarged adipose tissue.59,60
The study findings aligned with expectations, revealing heightened inflammation in individuals with obesity, as evidenced by elevated CRP and WBC levels compared with a relatively higher number of non-obese counterparts. Interestingly, no significant differences emerged in CRP and WBC levels between obese individuals with and without arthritis. This underscores the intricate interplay among obesity, arthritis, and inflammation.
While arthritis encompasses diverse subtypes with distinct inflammatory pathways, our findings suggest that obesity itself may contribute to systemic inflammation, potentially exacerbating the onset of various forms of arthritis. Even in the case of degenerative OA, the mechanical stress placed on weight-bearing joints by excess weight may induce chronic low-level inflammation akin to other arthritis-induced inflammation. However, the absence of clear evidence indicating that more individuals with obesity and arthritis have higher inflammatory markers compared with obese individuals without arthritis is notable, despite individuals with obesity showing significantly higher mean levels of inflammatory markers compared with non-obese counterpart.
Furthermore, the consistent association of obesity with both rheumatoid and non-rheumatoid arthritis lends support to the notion that obesity likely plays a significant role in arthritis pathogenesis.8,15,18,24,61 Nonetheless, we acknowledge the constraints of our study design, which preclude definitive conclusions regarding causality or the underlying mechanisms driving these associations.
Nevertheless, it is essential to acknowledge the multifaceted nature of arthritis and the potential involvement of other factors, such as genetic predisposition and environmental triggers. Further investigation is warranted to fully elucidate their roles in inflammation and the pathogenesis of arthritis, as well as to potentially establish a temporal relationship between obesity and the development of arthritis.
Strengths and limitations
The use of a large, representative sample size from representative NHANES data analyzed in this study argue for generalizability to American residents of the study findings. The socioeconomic, dietary, and other health-related information NHANES collects on responders in addition to the demographic information made it possible to control for potential confounders in a multivariate analysis to establish a relationship between obesity and arthritis. Laboratory results provided by NHANES also made it possible to analyze the role inflammation plays in the relationship between obesity and the development of arthritis by looking at important inflammatory markers.
Even though NHANES tries to decrease the occurrence of potential bias such as misclassification and information bias by using well-trained and qualified personnel to conduct surveys, and where possible, use accurate scientific measures like the collection of blood samples, secondary data from surveys still have several limitations. The lack of evidence of a clinical diagnosis of the outcome of interest (other than the self-reported responses) in study participants, for instance, makes it difficult to evaluate the influence of potential biases. It is also impossible to establish causality with the use of secondary data.
Conclusion
The study underscores a substantially elevated risk of arthritis development among individuals with obesity compared with non-obese individuals. The findings suggest that the mechanical stress imposed on weight-bearing joints by excess weight may trigger inflammation to a level comparable to that seen in other arthritis-induced inflammation among individuals with obesity. Even without the availability of data from a randomized intervention, which is unlikely to become available any time soon, the advisability of weight loss in people with excess weight gains yet another strong argument.
Supplemental Material
sj-docx-1-amd-10.1177_11795441241264820 – Supplemental material for Obesity and the Development of Arthritis Among Adults in the United States Using NHANES Data
Supplemental material, sj-docx-1-amd-10.1177_11795441241264820 for Obesity and the Development of Arthritis Among Adults in the United States Using NHANES Data by Emmanuel Baah and Martin Kohlmeier in Clinical Medicine Insights: Arthritis and Musculoskeletal Disorders
Footnotes
Acknowledgements
We thank the participants, staff, and all scientists who made NHANES possible.
Parts of this study were presented in abstract form at the American Society for Nutrition meeting, NUTRITION 2020 LIVE ONLINE, June 1-4, 2020.
Ethics approval and consent to participate
The NHANES data used in this study did not contain identifiable nor protected health information and is publicly available for download. The present study was exempt from ethics approval as a secondary analysis of existing NHANES public data under the US Health & Human Services (HHS)’ regulations at 45 CFR 46.101 (b) (4) (available at http://www.hhs.gov/ohrp/policy/cdebiol.html). US National Center for health care Statistics Research Ethics Review Board (ERB) approved the NHANES surveys (![]() ).
).
Consent for publication
The data used in this study are derived from the National Health and Nutrition Examination Survey (NHANES), conducted by the Centers for Disease Control and Prevention (CDC). NHANES data are publicly available and de-identified to protect the confidentiality of participants. No additional consent for publication was required for this analysis.
Author Contributions
First/Corresponding Author: Emmanuel Baah (EB).
Second Author: Martin Kohlmeier (MK).
EB designed and conducted the research, developed the analytical strategy, and did the statistical analysis. MK reviewed the analytical strategy and statistical analysis. All authors contributed to the interpretation of data for the study, critically revised and approved the final version of the manuscript and agree to be accountable for all aspects of the work.
Funding
The authors received no financial support for the research, authorship, and/or publication of this article.
Competing interests
The authors declare that there is no conflict of interest.
Availability of data and materials
The data sets generated and/or analyzed during the current study are available from the National Health and Nutrition Examination Survey (NHANES) website (![]() ). NHANES data are publicly accessible and can be obtained by registering for access on the NHANES website. Detailed documentation, including survey protocols, questionnaires, and data files, are provided to facilitate replication and further analysis of the findings reported in this study. The data set analyzed in the current study is available on reasonable request.
). NHANES data are publicly accessible and can be obtained by registering for access on the NHANES website. Detailed documentation, including survey protocols, questionnaires, and data files, are provided to facilitate replication and further analysis of the findings reported in this study. The data set analyzed in the current study is available on reasonable request.
Data sharing statement
The data set analyzed in the current study is available on reasonable request.
Supplemental material
Supplemental material for this article is available online.
References
Supplementary Material
Please find the following supplemental material available below.
For Open Access articles published under a Creative Commons License, all supplemental material carries the same license as the article it is associated with.
For non-Open Access articles published, all supplemental material carries a non-exclusive license, and permission requests for re-use of supplemental material or any part of supplemental material shall be sent directly to the copyright owner as specified in the copyright notice associated with the article.