
Abstract
Aims:
The aim of this study is to analyze the diagnostic value of weight-bearing radiographs, magnetic resonance images (MRI), and the combination of both in osteoarthritic knees when using arthroscopic findings as the “gold standard” to compare with.
Methods:
A total of 59 patients were studied because of chronic pain in 1 of their knees. Radiographs were classified according to Kellgren-Lawrence scale. Magnetic resonance images were classified according to Vallotton, and arthroscopic findings according to Outerbridge criteria.
Results:
Sensitivity, specificity, positive predictive value, negative predictive value, and accuracy were, respectively, 75.0%, 60.0%, 56.2%, 77.8%, and 66.1% for weight-bearing radiographs, and 70.8%, 88.6%, 81.0%, 81.6%, and 81.4% for MRI. Logistic regression analysis showed that a weight-bearing radiograph added to MRI offered no additional diagnostic value compared with MRI alone (P < .001).
Conclusions:
Magnetic resonance images presented higher specificity, positive and negative predictive values, and accuracy than weight-bearing radiographs for knee osteoarthritis. The combination of radiographs and MRI did not improve the diagnostic accuracy, compared with MRI alone.
Introduction
Weight-bearing radiographs are very useful for the diagnosis of osteoarthritis of the tibiofemoral joint,1-3 showing multiple signs as osteophytes, subchondral sclerosis, and, overall, narrowing of the joint space.2,4,5 These signs are used in Ahlbäck and Kellgren-Lawrence classifications.2,6,7 Some studies evaluated positively the usefulness of weight-bearing radiographs for knee osteoarthritis. 8 The sensitivity of the posteroanterior standing radiograph to detect significant medial compartment osteoarthritis ranged from 3.0% to 95.0%, and the specificity ranged from 60.0% to 98.0%.2,9-11 The most used parameter was joint space narrowing.7,8,12 Sensitivity and specificity of each parameter in weight-bearing radiographs for tibiofemoral osteoarthritis were also studied. Focusing on the medial compartment, marginal osteophytes were the most sensitive feature for the detection of osteoarthritis of the tibiofemoral joint (67.2%), but it was also the least specific finding (72.9%). Joint space narrowing was less sensitive (46.0%), but its specificity was higher (94.6%). It was suggested that osteoarthritis in the tibiofemoral joint should be diagnosed on the basis of marginal osteophytes and that joint space narrowing should be used to assess the severity of the disease. 2 In addition, a recent study by Duncan et al found that the Kellgren-Lawrence system was more sensitive for severe osteoarthritis in the medial compartment, with 95.0% sensitivity versus 83.0% for the joint space narrowing classification (but this was not statistically significant). The joint space narrowing classification was more specific for the medial compartment, showing a specificity of 96.0% versus 59.0% for the Kellgren-Lawrence system (P < .01). 9 Nevertheless, knee joint space depends on knee flexion and X-ray beam position.13,14
Magnetic resonance imaging (MRI) is also a valuable diagnostic tool for knee osteoarthritis. The degree of degenerative chondral lesions may be measured with the Vallotton classification system.15,16 Sensitivity reached only 60% for tibial plateau degenerative changes, especially in mild degrees of the disease, in some studies, whereas specificity was more than 90%.15,17 But it was also reported a sensitivity of 0% to 86% for identifying early grades and up to 98% in advanced grades, and a specificity of 48% to 95% in early grades and up to 100% in advanced grades in a recent systematic review. 18 Magnetic resonance imaging is also considered a better tool for measuring disease progression. 5 Magnetic resonance imaging findings for degenerative disease are dependent on the power of the magnetic field used, and 3.0-T MRI diagnostic results were better compared with the 1.5-T ones.19,20
A study of the relationship between the progression of joint space narrowing on radiographic images and cartilage loss on MRI concluded that radiography was not a sensitive measure, and, if used alone, a substantial proportion of knees with cartilage loss would be missed. 5 Nevertheless, both weight-bearing radiographs and MRI could describe only partially an osteoarthritic knee and underestimate (underdiagnose) mild degrees of the disease, 21 so additional studies to evaluate the relative importance of both diagnostic tools and methods to include the whole joint have been proposed. 21 Galea et al 15 studied the accuracy of MRI in patients with previous diagnosis based on clinical and radiographic examination. The usefulness of each tool (weight-bearing radiographs and MRI) to identify degenerative joint disease was described in the study, but the accuracy of the combination of both compared with each technique separately was not studied. To the best of our knowledge, no previous study has evaluated the diagnostic value of the combination of weight-bearing radiographs and MRI.
Methods
Study design
This is a diagnostic, prospective study on a consecutive cohort of patients comparing diagnostic signs in weight-bearing (standing) radiographs and in MRI with arthroscopic findings.
Inclusion criteria
The inclusion criteria are as follows:
Chronic pain in 1 knee for more than 6 months that limits walking in different grades. Radiologic criteria are used for diagnosing osteoarthritis patients;
No description of previous traumatic episode;
Painful knee is the main limiting factor for the global functional disability of the patient.
Exclusion criteria
The exclusion criteria are as follows:
Inflammatory and autoimmune arthritis;
Pseudogout, hyperuricemia, and other microcrystalline arthritis;
Local acute and/or chronic infection in the knee and/or its sequelae;
Previous surgery in the knee;
Polyarticular disease of any cause;
Osteochondritis dissecans;
Osteonecrosis;
Dysplasia of the knee of any cause;
Although the study is about degenerative changes in the medial compartment, degenerative disease in the lateral and/or patellofemoral compartment is not an exclusion criterion.
Epidemiology
Patients with different diagnoses (meniscal tear, anterior cruciate ligament tear, refractory knee pain) were operated because of chronic pain in their knee in a General Hospital between May 2010 and February 2013. The group was formed by 59 patients with an average age of 49.6 (21-82) years. There were 37 men (62.7%) (average: 44.2%) and 22 women (37.3%) (average: 58.7%) (Figure 1). The left knee was studied in 34 patients and the right knee was studied in 25 (Figure 2). Pain had remained an average of 14.2 (6-60) months before the diagnostic process. Heavy labor activity was performed by 45% of patients, and another 37% of patients practiced a moderate level of sports/leisure activity. Prior to the beginning of the study, between 60 and 65 patients were expected to enroll in this study, which was a statistical estimation of the number of patients fulfilling the inclusion criteria during a period of 3 years. The accuracy was estimated by the width of the confidence intervals. Although numbers could appear small, the sample of patients with osteoarthritis changes was enough to reach significant differences with the employed statistical tests.
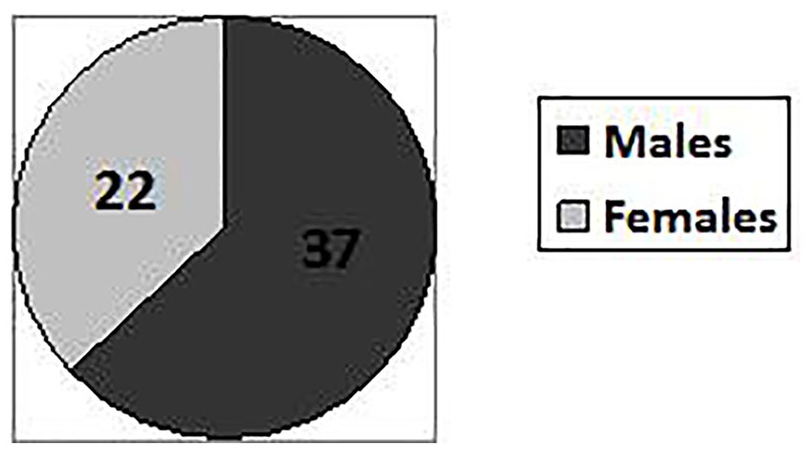
Sex distribution.

Knee involved.
Informed consent and ethical aspects
All patients gave specifically their consent for the clinical interview, physical examination, standing radiograph, MRI, and arthroscopy. All personal data from the patients have been eliminated for research purposes, and confidentiality has been maintained. The local ethical committee has considered the informed consent for the patient ethically acceptable and it has also qualified the work conducted as methodologically appropriate, so the study has been approved by the committee (institutional review board [IRB]).
Weight-bearing radiographs
A standing, semi-flexed posteroanterior radiograph was obtained from all patients with the same protocol: knees flexed 7° to 10° to achieve a parallel alignment of the medial tibial plateau and the central x-ray beam (also parallel to the floor), so the anterior and posterior borders of the medial tibial plateau are not separated more than 1 mm. This measure is the most important item to reach accuracy, and a flexion of 7° to 10° is considered enough. Both feet should rotate until tibial spines are in line with the intercondylar notch of the femur. A parallel radioanatomic alignment of the medial tibial plateau is the only element of positioning that is consistently related to sensitivity in the detection of joint space narrowing in knee osteoarthritis,22,23 and it has been used in several clinical trials.24,25 We found this flexion weight-bearing position appropriate for the reproducibility and sensitivity of joint space narrowing. Conventional extension radiographs will underestimate the degree of degenerative disease. We used a manual method of joint space width measurement, which was less susceptible to be altered by technical factors. 23
These radiographs were the first study made in all cases, and they were analyzed and measured by 1 blinded observer, the main researcher, who did not know any medical information about the patients. We considered that the experience of an orthopedic surgeon was enough to analyze weight-bearing radiographs, as it is commonplace for daily study.
The following signs were investigated: osteophytes in the medial compartment, sclerosis in the subchondral bone of the medial compartment, subchondral cysts, and joint space narrowing according to Spahn criteria (patients with 4 or more of the following factors: a history of osteoarthritis for more than 2 years, obesity, smoking, tibial osteophytes, and joint space narrowing of less 5 mm are associated with a poor outcome of arthroscopy). 26 The Kellgren-Lawrence degree of knee osteoarthritis was determined with all these signs: osteophytes, joint space narrowing, sclerosis, and subchondral cysts (Table 1).
Kellgren-Lawrence classification.

Magnetic resonance imaging
All knees were studied with a Siemens 1.5-T MRI scanner. The knee coil was used in all the patients. We acquired proton density (DS), T1, T2, and spin-echo sequences. The MRI scans were performed and analyzed after the weight-bearing radiographs and before arthroscopy in all cases, with an average time of 3.03 (0-12) months between weight-bearing radiographs and MRI. Only 1 patient suffered a long delay. We considered that the time delay would not affect the results. Signal intensity and changes in the medial compartment cartilage were analyzed independently by 2 blinded observers, the main researcher and a radiologist specialized in the musculoskeletal system, who had a previous calibration session. This analysis was considered blind because neither of them knew weight-bearing radiograph results. The degree of osteoarthritis was assigned to each knee according to the Vallotton score 16 : grade 0 (normal), I (cartilage surface intact, hyposignal or hypersignal), II (minor surface irregularities and/or focal reduction of thickness < 50%), III (noticeable surface irregularities, focal reduction of thickness > 50%), and IV (100% focal loss of thickness with or without bone reaction). The main researcher’s Vallotton grade was finally used for the study because we could see in the results that the radiologist classification involved a description of a lower grade and less accuracy.
Other pathologies such as meniscal tear and anterior cruciate ligament injury were also described.
Arthroscopy
Arthroscopy was the “gold standard” diagnostic test for all patients. It was performed as an ambulatory process under spinal anesthesia and limb ischemia after an average time of 5.4 (0.5-14) months from the weight-bearing radiographs. Time delay between each diagnostic test could not be reduced because of the high demand from patients in waiting lists. We considered it was an adequate time between tests and assumed that degenerative arthritis does not undergo a relevant progression in that period as to affect the results of the study. To be able to prepare the operation correctly, arthroscopies were consecutively performed by different surgeons who knew about the preoperative tests, but they were revised intraoperatively with a blind method by an orthopedic surgeon who was the main researcher of this study. Several arthroscopic operators were involved to improve patient recruitment.
A 30° direction-of-view arthroscope with a 4 mm diameter was used. The images were recorded in video, using digital format and high definition. The diagnostic part of the procedure was performed in a standard manner, and the main researcher probed the articular cartilage lesions and assessed the degree of the cartilage degeneration in the medial compartment intraoperatively, according to the Outerbridge classification 27 : grade 0 (normal), I (cartilage surface intact, noticeable softening, loss of elasticity), II (cartilage surface damaged, lesion thickness < 50%), III (cartilage surface damaged, lesion thickness > 50%), and IV (exposed subchondral bone). Femoropatellar and lateral compartment diseases were described during the surgery, but this information was not included in the study. In some cases, details of surgical procedures were included in the recording.
Statistical analysis
The descriptive analysis included arithmetic mean, median, range, and standard deviation for quantitative variables, as well as absolute frequency and percentage for qualitative variables. Weight-bearing radiographs were analyzed in 2 different days, and the intra-rater correlation of Kellgren-Lawrence grade was calculated using the kappa statistic. Inter-rater correlation for MRI degrees was calculated with the kappa statistic as well, and a McNemar symmetry test analysis was added to study random influence. A total of 60 patients were involved in the inter-rater/intra-rater study, with 10 to 12 years of experience of raters. Kappa index, statistical ratio, and Wilcoxon test were used to calculate the accuracy of radiographs compared with the arthroscopic degree and accuracy of MRI compared as well with the arthroscopic degree.
In a second stage of statistical analysis, the cases were grouped and classified as “normal” (grades 0 and I of Kellgren-Lawrence, Vallotton, and Outerbridge) and “pathologic” (grades II-IV of Kellgren-Lawrence, Vallotton, and Outerbridge). 15 These groups allowed us to calculate the sensitivity, specificity, positive and negative predictive values, and accuracy of radiographs and MRI. The analysis was repeated after an alternative mode of grouping (“normal” for grades 0-II and “pathologic” for grades III and IV) to study if it could be better. Finally, we found the first alternative more useful for the purpose of the study. It was also based in previous studies. 15
Logistic regression analysis was applied to evaluate the diagnostic accuracy of isolated radiographs, isolated MRI, and the combination of both.
A receiver operating characteristic (ROC) curve is a graphical plot that illustrates the diagnostic ability of a test. The ROC curve is created by plotting the true-positive rate (also known as sensitivity) against the false-positive rate (also known as the fall-out or probability of false alarm). The ROC analysis provides tools to select possible optimal models and to discard suboptimal ones, and it is related in a direct way to the cost/benefit analysis of the diagnostic decision making. The area under the ROC curve is a measure of the usefulness of a test, where a great area means a more useful test. The area under the ROC curve was also calculated for both diagnostic techniques (radiographs and MRI) in our study.
Nonparametric Spearman test was used to assess the relation between joint space width and the osteoarthritis degree in weight-bearing radiographs. In addition, cases were grouped according to articular space width (wider or narrower than 5 mm). We found it better to use an absolute value based on Spahn criteria, instead of a relative value, because the first one is related with the poor outcome of degenerative knee disease. 26 The Mann-Whitney U test was used to analyze the relation of narrowing joint space with each osteoarthritis degree according to the Kellgren-Lawrence, Vallotton and Outerbridge classifications. We described Spahn criteria to study joint space narrowing as a secondary aim.
Differences were considered statistically significant when P values were <.05. All statistical calculations were made with the SAS 9.3 software package (SAS Institute, Cary, NC, USA).
Results
Weight-bearing radiographs
Intraobserver correlation reached a 0.95 kappa index. According to the Kellgren-Lawrence score, out of 59 studied knees, 8 (13.6%) were classified as grade 0, 19 (32.2%) as grade I, 19 (32.2%) as grade II, 7 (11.9%) as grade III, and 6 (10.2%) as grade IV (Figure 3).

Distribution in grades according to Kellgren-Lawrence score (weight-bearing radiographs).
Magnetic resonance imaging
The interobserver correlation leads to a 0.37 kappa index (P < .001). Analysis by the McNemar symmetry test established that these differences could not be explained only by random, observing a lower degree (milder classification) for the radiologist classification.
According to the Vallotton classification, out of 59 studied knees, 22 (37.3%) were considered grade 0, 16 (27.1%) grade I, 11 (18.6%) grade II, and 10 (16.9%) grade III. No case was classified as grade IV (Figure 4).

Distribution in grades according to Vallotton score (MRI). MRI indicates magnetic resonance imaging.
Arthroscopic findings
No degenerative changes in articular cartilage were visualized in 10 knees. Out of 59 patients, 10 (16.9%) presented an Outerbridge grade 0, 25 (42.4%) grade I, 7 (11.9%) grade II, 13 (22.0%) grade III, and 4 (6.8%) grade IV (Figure 5).

Distribution in grades according to the Outerbridge classification (arthroscopy).
No severe or important complication or secondary effect was registered after arthroscopy in the whole series.
Correlation of weight-bearing radiographs or MRI with arthroscopic findings
Establishing arthroscopy as the gold standard, the diagnostic accuracy of standing radiograph was calculated as 0.42 and that of MRI as 0.49. Wilcoxon signed rank test showed a tendency toward overdiagnosis with radiographs (P = .25) and significant underdiagnosis with MRI (P = .001). The computed kappa index was 0.25 for radiographs (0.17-0.49) and 0.33 for MRI (0.08-0.41), and this overlapping of confidence intervals made this way of comparison of both diagnostic tests difficult.
Diagnostic accuracy of weight-bearing radiographs or MRI
The sensitivity, specificity, positive and negative predictive values, and accuracy of weight-bearing radiographs and MRI for each degree of knee osteoarthritis are shown in Tables 2 and 3.
Sensitivity, specificity, positive/negative predictive value, and accuracy of weight-bearing radiographs for each degree of knee osteoarthritis.

Abbreviations: A, accuracy; E, specificity; NPV, negative predictive value; PPV, positive predictive value; S, sensitivity.
Sensitivity, specificity, positive/negative predictive value, and accuracy of MRI for each degree of knee osteoarthritis.

Abbreviations: A, accuracy; E, specificity; MRI, magnetic resonance imaging; NPV, negative predictive value; PPV, positive predictive value; S, sensitivity.
After grouping knees in “normal” (grades 0 and I) and “pathologic” (grades II-IV), a sensitivity of 75% (55%-88%) and a specificity of 60% (44%-74%) were calculated for weight-bearing radiographs, whereas the positive predictive value was 56.2% (39%-72%) and the negative predictive value was 77.8% (59%-89%); accuracy was estimated to be 66.1% (53%-80%). When alternative grouping was established (“normal” for grades 0 to II and “pathologic” for grades III and IV of Kellgren-Lawrence), the sensitivity lowered to 45.8%, the specificity increased to 94.3%, the positive predictive value also increased to 84.6%, whereas the negative predictive value lowered to 71.7%; accuracy was estimated to be 74.5% (62%-84%). These results confirm that accuracy is better when the severity of the disease increases (Table 4).
Sensitivity, specificity, positive/negative predictive value, and accuracy of isolated weight-bearing radiographs (alternative grouping included), isolated MRI, and radiographs plus MRI, for the diagnosis of knee osteoarthritis.
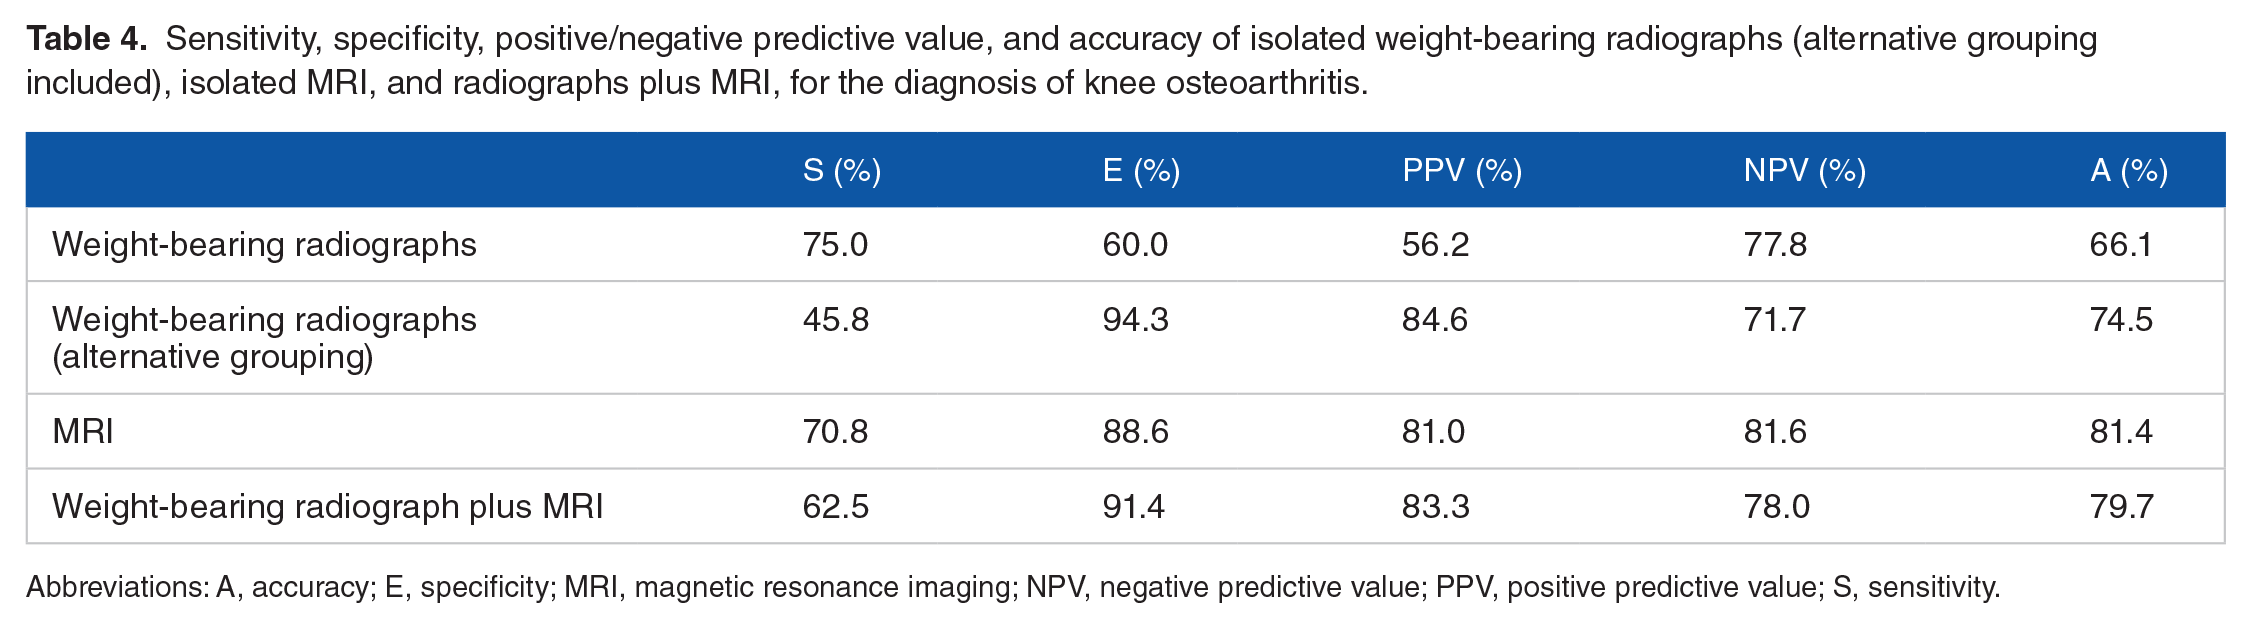
Abbreviations: A, accuracy; E, specificity; MRI, magnetic resonance imaging; NPV, negative predictive value; PPV, positive predictive value; S, sensitivity.
With the same methodology, a sensitivity of 70.8% (51%-85%) and a specificity of 88.6% (74%-95%) were calculated for MRI, whereas the positive predictive value was 81.0% (60%-92%) and the negative predictive value was 81.6% (67%-91%); accuracy was estimated to be 81.4% (70%-89%).
The ROC curve was 0.89 (0.81-0.97) for MRI and 0.77 (0.65-0.89) for weight-bearing radiographs (P < .001). A higher number of the area under the ROC curve means a more useful test, so MRI was more useful than weight-bearing radiographs with a statistically significant result in our study.
Diagnostic value of weight-bearing radiographs plus MRI
Table 4 also offers the diagnostic value when combining the findings in radiographs plus those in MRI. The sensitivity was 62.5%, the specificity was 91.4%, and the positive and negative predictive values were 83.3% and 78.0%, respectively. Accuracy was finally calculated as 79.7%. Moreover, the logistic regression analysis showed that a standing radiograph (P = .520) (0.38-6.72) after an MRI offered no additional diagnostic value compared with MRI alone (P < .001) (3.51-66.93) (Table 5).
Logistic regression analysis of weight-bearing radiographs plus MRI, versus arthroscopy.

Abbreviations: CI, confidence interval; MRI, magnetic resonance imaging.
The logistic regression analysis using the alternative grouping showed that a standing radiograph (P = .115) (0.69-30.31) after an MRI offered no additional diagnostic value compared with MRI alone (P = .001) (2.64-48.78). Confidence intervals were so wide in this case that we consider this grouping inadequate to center the study on it (Table 6).
Logistic regression analysis of weight-bearing radiographs (alternative grouping) plus MRI, versus arthroscopy.
Categorical variable encoding.

Abbreviations: CI, confidence interval; MRI, magnetic resonance imaging.
Importance of joint space narrowing
Medial joint space in weight-bearing radiographs was on average 1.82 mm narrower than lateral joint space (the mean value of medial joint line was 4.33 mm and the mean value of lateral joint space was 6.15 mm, with a difference of 1.82 mm). These results applied to only those patients who showed some medial joint space narrowing (51 patients).
Joint space width was inversely correlated with the osteoarthritis degree in weight-bearing radiographs (correlation coefficient: –0.69) (P < .0001), MRI (correlation coefficient: –0.47) (P < .0001), and arthroscopy (correlation coefficient: –0.50) (P < .0001).
When cases were grouped according to joint space wider or narrower than 5 mm, 7 the Mann-Whitney U test discovered a strong statistical relation among weight-bearing radiographs (P < .001), MRI (P < .005), and arthroscopy (P = .001).
Discussion
Because the results after arthroscopy versus medical therapy for symptomatic knee osteoarthritis have shown no additional benefit for arthroscopic surgery, 28 the ability to detect chondromalacia is becoming more important.
We could summarize our most important findings as follows:
In our study, weight-bearing radiographs did not increase the diagnostic accuracy for knee osteoarthritis compared with MRI alone. As it was previously said, no results can be found in the literature about the diagnostic value of the combination of both tools compared with each technique separately.
Another important result was that weight-bearing radiographs and MRI offered better accuracy when the severity of the disease increased, as it had been described in the literature. 15
Weight-bearing radiographs
Weight-bearing radiographs graded according to Kellgren-Lawrence or Ahlbäck classification continue to be the most employed procedure, but there are some discrepancies about the usefulness of joint space width for osteoarthritis diagnosis and grading,7,29,30 whereas an author proposed tibial osteophytes as better indicators. 2 These recent studies convinced us to use the Kellgren-Lawrence instead of the Ahlbäck classification, as recommended by other authors.6,7 Most authors were in agreement regarding the use of radiological changes in the medial compartment,2,5,31 as we did.
The published sensitivity varies from 3% to 95%, and the specificity ranged from 60% to 98%2,9- 11 (Table 7).
Comparison of published figures and data from this study on the diagnostic value of weight-bearing radiographs for knee osteoarthritis.

Abbreviations: A, accuracy; E, specificity; N, number of patients in series; NPV, negative predictive value; PPV, positive predictive value; S, sensitivity.
Our results were similar to those reported in the literature. According to all these figures, including those obtained in this study, we could conclude that weight-bearing radiographs had limited sensitivity and specificity.
Magnetic resonance imaging
When compared with arthroscopic findings, the sensitivity of MRI for diagnosing knee osteoarthritis varied from 58% to 97%, whereas the specificity was calculated to be in the range from 85% to 100%.15,17,32 Our figures were similar (Table 8). Accuracy was estimated as 47% to 69%,17,32 whereas we obtained a value of 81%. According to our data, some patients of Outerbridge grade II were underdiagnosed as grade I by MRI, as it had also been described previously. 15 Other authors communicated low figures for sensitivity in milder degrees (from 20% to 94% for degrees I-III) and higher (from 77% to 100%) in the most severe degree IV,15,17 but improved in all cases with the 3-T equipment (instead the usual 1.5-T one used in our study). Nevertheless, the economic cost of an MRI was more than 10 times that of a standing radiograph (based on the costs in a university hospital), and this should also be taken into consideration when choosing a diagnostic tool.
Comparison of published figures and data from this study on the diagnostic value of MRI for knee osteoarthritis.

Abbreviations: A, accuracy; E, specificity; N, number of patients in series; NPV, negative predictive value; PPV, positive predictive value; S, sensitivity.
Weight-bearing radiographs and MRI
We could not find any study that analyzes the diagnostic value of combining standing radiograph and MRI findings. Our results are shown in Table 3. It is clear that MRI was statistically significant (P < .001), but standing radiograph did not increase the diagnostic value of MRI (standing radiograph represented P = .520, which means that the results did not add information to MRI).
Some studies5,33 analyzed the diagnostic value of radiographs using MRI as the “gold standard,” without arthroscopy. It could be assured that the results obtained were of less statistical and clinical value than those obtained by comparison with direct arthroscopic visualization, as relevant studies indicated that arthroscopy is the most suitable technique to value cartilage degeneration in osteoarthritis.17,34
Joint space width
Usually, medial joint space is narrower than the lateral one in most osteoarthritic knees. This was measured in our patients and in other published papers. 21
It is generally accepted that articular joint width is the best individual measure of the osteoarthritis degree26,30,31,35 in weight-bearing radiographs. In our study, it was also a good measure of osteoarthritis with a high clinical and radiologic correlation.
In a clinical context, we can say that weight-bearing radiographs were useful to exclude severe osteoarthritis prior to arthroscopic surgery. But MRI could diagnose the osteoarthritis degree more accurately, so it could be the only diagnostic tool used if we were just studying the osteoarthritis grade, especially for mild degrees. Weight-bearing radiographs could be added to rule out other diseases or to study some items for prosthetic surgery, for example.
Conclusions
Magnetic resonance imaging presented higher specificity, positive and negative predictive values, and accuracy than standing radiograph for knee osteoarthritis. Only sensitivity was slightly higher for weight-bearing radiographs when classes were grouped. Both diagnostic tools offered better results when the severity of the disease increased. The combination of radiographs and MRI did not increase the diagnostic accuracy for knee osteoarthritis, compared with MRI alone.
In a clinical context, it can be said that, when radiographic findings are already given, an MRI should be useful, especially to better study cases of mild osteoarthritis before arthroscopic surgery. Furthermore, if MRI has been already made, weight-bearing radiographs might not be necessary in the cases of mild osteoarthritis.
Footnotes
Funding:
The author(s) received no financial support for the research, authorship, and/or publication of this article.
Declaration of conflicting interest:
The author(s) declared no potential conflicts of interest with respect to the research, authorship, and/or publication of this article.
Author Contributions
Conception and design of the study: N.M.G., J.C.A and R.M.J. Adquisition of data: N.M.G. Analysis and interpretation data: N.M.G, J.C.A and R.M.J. Writing and editing: N.M.G. and J.C.A.
Ethical Approval and Informed Consent
The local ethical committee has considered the work submitted ethically acceptable. Written informed consent was obtained from all patients. The local ethical committee has also qualified it as methodologically appropriate. Because of all these positive evaluations, the study has been approved by the local ethical committee (IRB).
Location
This work was performed in the Orthopedic Surgery Department, La Princesa University Hospital, Autonoma University, Madrid, Spain.